TX-SBOE Maps

Today in the Texas House, the Committee Substitute to HB 600 was read a 3rd time and passed.

HB 600 redraws the State Board of Education seats.

There has been some talk about increasing the size of the SBOE. It currently has only 15 members which means the ideal population size for the new districts is 1.6 million.

Who cares about some SBOE seats? Considering that Texas is one of the biggest buyers of textbooks (when the state has the money to purchase them), and that these 15 people decide what goes in the textbooks, these 15 seats can have a national impact.

So what did the House finally agree to?

It should be noted that all 15 of these seats will be up in 2012. The year after redistricting all of the members of the State Senate and the State Board of Education run.  They then draw to see who runs in 2 years (i.e. 2014) or 4 years (i.e. 2016)

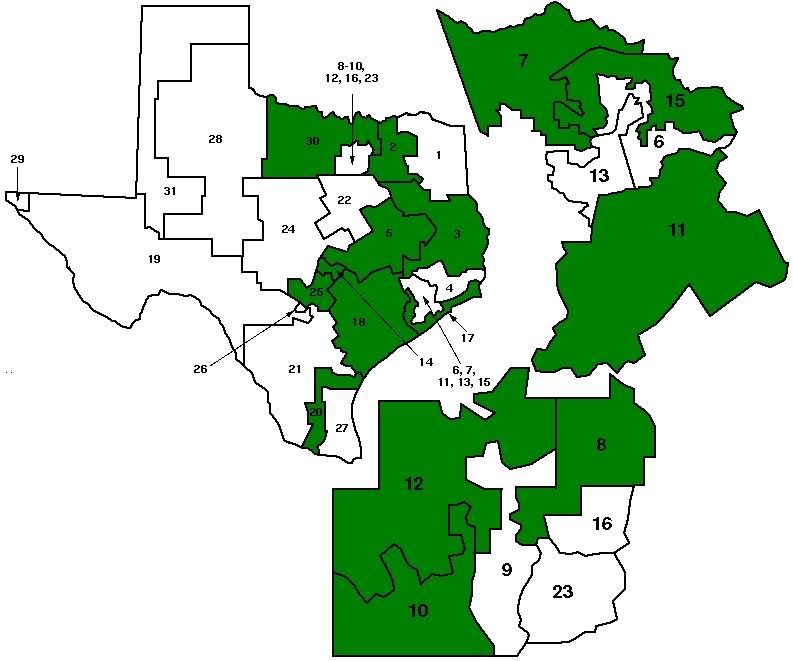
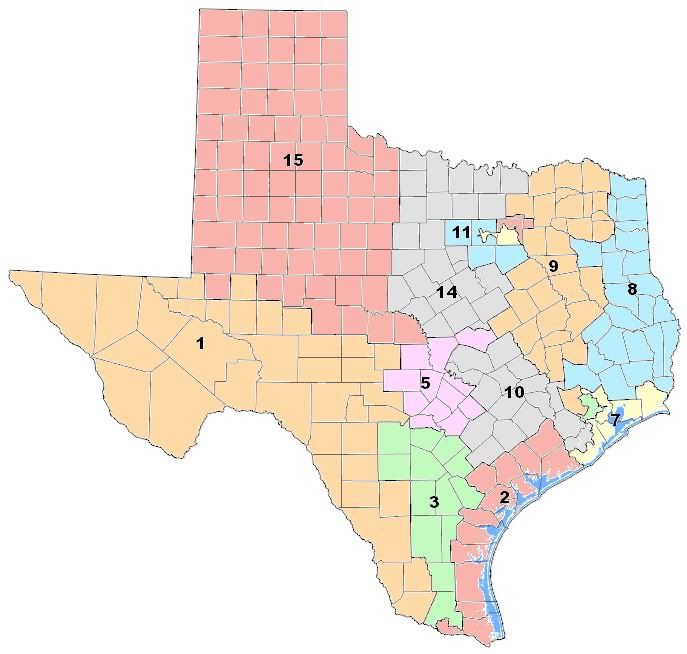
First, here’s a map of the current SBOE districts.
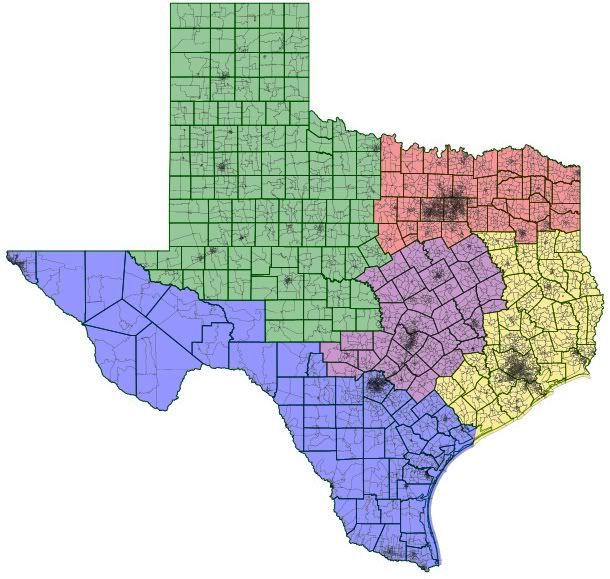
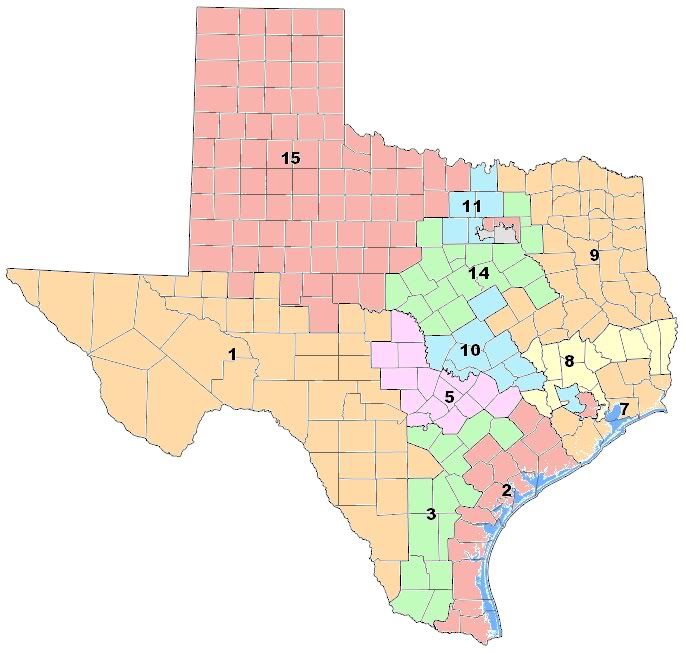
The new districts:

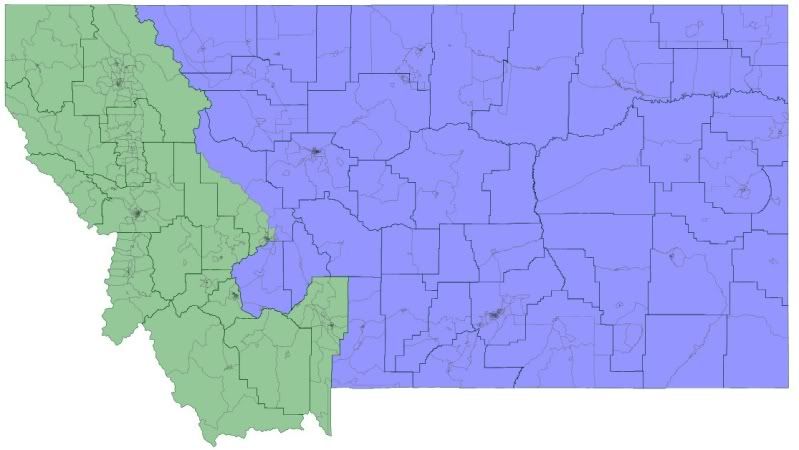
New districts in Dave’s App

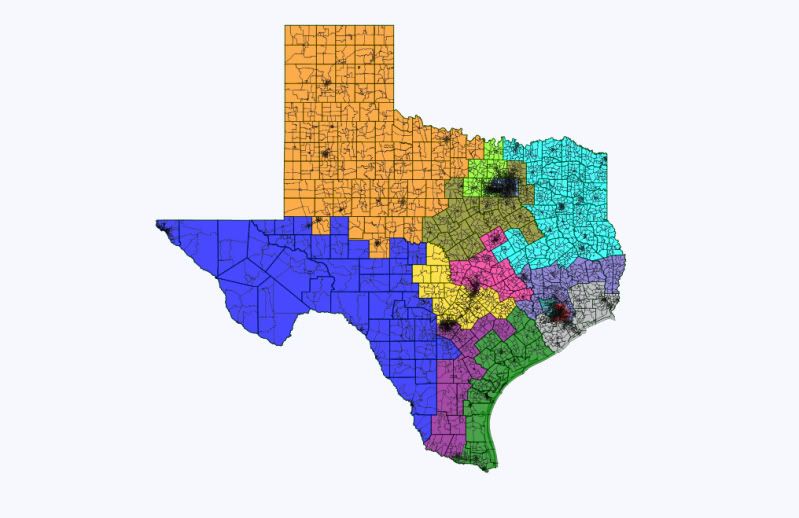
These maps are from the state’s redistricting website, but they didn’t provide any partisan data. So I drew them using Dave’s App.

District 1

Lean-Likely D

55% Obama/45% McCain

73% Hispanic, 24% White, 3% Black, 1% Asian

This district is interesting because in 2010 it elected a Republican. The incumbent Democrat may have gotten a little complacent having been elected in 1988 and his only previously close election being in 1994 when he won 53% to 47%. Although with a district that contains both El Paso and Laredo, you have to think you’d be pretty safe as a Hispanic Democrat. Democrats have the chance to recapture this seat in 2012.

District 2

Lean D

52% Obama/47% McCain

69% Hispanic, 27% White, 3% Black, 1% Asian

This district features a longtime incumbent with Democrat Mary Helen Berlanga. She’s been on the board since 1982. That’s long enough to have been elected to the SBOE (in 1982), appointed to the SBOE (in 1984 when the Lege made it an appointed body), and elected again (in 1988 when it went back to an elected body).  In spite of the closeness of this district, Berlanga has managed to solidly win every time.

District 3

Safe D

60% Obama/39% McCain

68% Hispanic, 27% White, 7% Black, 2% Asian

This district pretty much stays safe for a Democrat.

District 4

Light Red (next to District 7)

Safe D

73% Obama/26% McCain

49% Hispanic, 30% Black, 16% White, 5% Asian

Stays a solid Democratic district.

District 5

Yellow

Lean-Likely R

44% Obama/54% McCain

60% White, 31% Hispanic, 6% Black, 4% Asian

This district still takes in heavily Republican areas in north Bexar County. In Bexar County it trades some Republican areas in NE Bexar County (Live Oak, Universal City, Converse, Schertz, and Randolph AFB) for some others (Alamo Heights, Olmos Park, and Terrell Hills). It keeps the Republican counties of Kendall, Comal, and Guadalupe. It only slightly increases its coverage of Travis County. It sheds Bell County which contains Killeen-Temple-Fort Hood.

District 6

Light Blue (below District 8, directly to the left of District 4)

Likely R

41% Obama/58% McCain

48% White, 30% Hispanic, 12% Black, 11% Asian

This district pretty much stays the same, only losing a small slice of Harris County.

District 7

Likely R

41% Obama/58% McCain

54% White, 18% Black, 19% Hispanic, 9% Asian

This district sheds east Harris County and adds 4 new counties. This could be a ripe district for Democrats to target because the new configuration includes Fort Bend County.  This county has been trending Democratic. In 2008, the county went 49% Obama/51% McCain. In 2010 it went 47% Bill White/52% Rick Perry.

District 8

Safe R

65% White, 20% Hispanic, 11% Black, 4% Asian

This district has some changes. Previously it ran up east Texas. It now moves south and becomes more compact.

District 9

Safe R

30% Obama/70% McCain

73% White, 15% Black, 11% Hispanic, 2% Asian

This district takes in a lot of the old 8th.

District 10

Toss Up

49% Obama/49% McCain

61% White, 21% Hispanic, 12% Black, 6% Asian

I never thought I’d be able to write tossup about either a State Senate seat or an SBOE seat. *The 2008 vote totals for this district were 298,091 for Obama and 298,430 for McCain. 339 votes. Democrats may finally be able to win a new seat on the SBOE.  If Judy Jennings wants another crack at this seat, 2012 is the year to do it with the presidential race and Travis County. This district now doesn’t go all the way from Austin to the Houston suburbs.

*Thanks to Greg at Greg’s Opinion for the updated numbers. And thanks to blank for the prodding that got the update.

District 11

Safe R

37% Obama/62% McCain

67% White, 17% Hispanic, 9% Black, 6% Asian

Takes in plenty of Republican areas to still make it safe for Republicans.

District 12

Red (covers northern portion of Dallas County and NE quadrant of Tarrant County)

Likely R

43% Obama/57% McCain

58% White, 21% Hispanic, 12% Black, 8% Asian

Here is another potential opportunity for Democrats. It sheds Rockwall County and a portion of Collin County, while adding a portion of Tarrant County. Thanks to the success of Dallas County Democrats, this district has the potential to be competitive.

District 13

Gray (weird looking district that covers Dallas and Tarrant counties)

Safe D

69% Obama/30% McCain

41% Hispanic, 26% White, 30% Black, 4% Asian

Takes in more of Tarrant County, but continues to be a safe Democratic seat.

District 14

Safe R

32% Obama/67% McCain

71% White, 14% Hispanic, 7% Black, 7% Asian

District 15

Safe R

25% Obama/74% McCain

65% White, 27% Hispanic, 6% Black, 3% Asian

Currently the board is split 4 D – 11 R. If Democrats play their cards right, they could conceivably wind up with a 6 D – 9 R split on the SBOE. Democrats should go for broke and make a serious play for Districts 5, 7, & 12, if only to try and get an idea of what the Democratic performance is like in the new districts.

Populations for districts are VAP from the state.

VA St. Sen. Howell Districts in Dave’s App

[Ed. note: This is impressive work. I took the liberty of moving the list of demographic & political info into a table. – David]

There was a request for the .drf file that I created for the Howell proposal of the VA State Senate, so why not make a diary.

For the .drf file, click here.

Caution: the Howell plan splits precincts, which I don’t think Dave’s App allows for. On some districts, it’s a judgement call, like on the borders of the 15th & 20th districts or the 7th & 14th districts. The non-ability to split precincts is also why districts will have the variances in population.

And yes, the numbers correspond to the Howell numbers, i.e. District 1 below is District 1 in the Howell plan.

Data table below the fold.


District Obama McCain White Black Hisp. Asian W VAP B VAP H VAP A VAP 2000-09 D 2000-09 R
1 58% 42% 55% 31% 8% 3% 59% 29% 7% 4% 52% 48%
2 70% 30% 38% 51% 5% 3% 41% 50% 4% 3% 65% 35%
3 38% 62% 81% 13% 3% 2% 82% 12% 2% 2% 39% 62%
4 39% 61% 77% 15% 4% 1% 78% 15% 3% 1% 38% 62%
5 74% 26% 35% 55% 5% 3% 38% 53% 5% 3% 69% 32%
6 57% 43% 60% 26% 8% 3% 62% 25% 7% 3% 54% 46%
7 52% 48% 55% 28% 8% 7% 59% 24% 7% 7% 52% 48%
8 63% 37% 53% 30% 10% 5% 57% 28% 9% 5% 56% 44%
9 75% 25% 38% 55% 3% 2% 41% 52% 2% 2% 71% 29%
10 39% 61% 76% 15% 3% 3% 78% 16% 3% 3% 37% 63%
11 42% 58% 68% 25% 4% 1% 70% 25% 3% 1% 40% 60%
12 41% 59% 77% 11% 4% 7% 78% 11% 3% 6% 39% 61%
13 43% 57% 66% 21% 4% 6% 68% 21% 4% 6% 43% 57%
14 37% 63% 81% 9% 4% 3% 83% 9% 4% 3% 38% 62%
15 37% 64% 74% 22% 2% 1% 76% 21% 2% 1% 37% 63%
16 72% 29% 35% 53% 8% 2% 38% 52% 7% 2% 64% 37%
17 51% 49% 70% 17% 8% 2% 72% 17% 7% 2% 47% 53%
18 64% 36% 42% 52% 3% 1% 44% 51% 2% 1% 61% 39%
19 37% 63% 91% 4% 2% 1% 92% 4% 2% 1% 39% 61%
20 49% 51% 66% 28% 4% 1% 69% 27% 3% 0 49% 52%
21 57% 43% 73% 16% 4% 4% 76% 15% 4% 4% 55% 45%
22 51% 49% 65% 9% 10% 13% 67% 9% 9% 13% 46% 54%
23 37% 63% 80% 14% 2% 2% 82% 14% 2% 1% 39% 61%
24 36% 64% 88% 6% 3% 1% 89% 7% 3% 1% 35% 66%
25 58% 43% 81% 10% 4% 3% 82% 9% 3% 4% 56% 44%
26 41% 59% 86% 3% 7% 1% 88% 3% 6% 1% 38% 63%
27 43% 57% 83% 6% 7% 2% 85% 6% 6% 2% 40% 60%
28 44% 56% 71% 16% 7% 3% 73% 16% 6% 3% 41% 59%
29 61% 39% 41% 20% 28% 7% 45% 20% 25% 8% 52% 48%
30 66% 34% 62% 13% 16% 6% 64% 12% 14% 7% 64% 36%
31 62% 39% 68% 5% 12% 12% 69% 5% 11% 12% 60% 40%
32 61% 39% 68% 5% 9% 14% 71% 5% 8% 14% 59% 41%
33 59% 41% 48% 9% 20% 20% 51% 9% 19% 19% 52% 48%
34 57% 43% 61% 5% 11% 19% 63% 5% 10% 19% 54% 46%
35 66% 34% 42% 12% 26% 16% 45% 12% 25% 16% 63% 37%
36 64% 36% 42% 25% 22% 8% 46% 24% 20% 8% 59% 41%
37 57% 43% 52% 7% 15% 23% 54% 7% 14% 23% 52% 48%
38 41% 59% 94% 4% 1% 1% 94% 4% 1% 1% 47% 53%
39 59% 41% 54% 17% 13% 13% 57% 16% 12% 13% 54% 46%
40 33% 67% 95% 2% 1% 0 95% 2% 1% 0 38% 62%

Under the Howell lines:

21 Senate districts voted for Obama and have a history of voting Democratic

2 Senate districts voted for Obama but have a history of voting Republican

17 Senate districts voted for McCain and have a history of voting Republican

Texas Lege Redistricting

With 4 new congressional seats, Texas of course grew. While we get to increase our congressional delegation, our legislature will stay the same. This means, that state senators will continue to have even larger constituencies and districts than members of congress.

Everyone has speculated where the new congressional districts will be, and looking at the state legislature, especially the house, you can also get a good visual of the growth.

The new population of 25,145,561 means that State Senate districts (31) should have an ideal population of 811,147 and State House districts (150) 167,637.

Which districts will need to grow and which will need to shrink?

Green colored districts (green because they grew over the past decade) are those that are currently over the ideal population and will need to lose people.  White/non-colored districts are those that will need to add population.

Right now 15 State Senate districts will need to shrink and 16 will need to grow. Half and half.


District Population Deviation Party
1 731,108 (80,039) R
2 856,525 45,378 R
3 818,359 7,212 R
4 790,149 (20,998) R
5 899,155 88,008 R
6 643,019 (168,128) D
7 1,015,027 203,880 R
8 940,963 129,816 R
9 807,907 (3,240) R
10 834,265 23,118 D
11 838,090 26,943 R
12 1,013,641 202,494 R
13 730,086 (81,061) D
14 872,176 61,029 D
15 824,336 13,189 D
16 641,007 (170,140) R
17 847,887 36,740 R
18 861,831 50,684 R
19 766,044 (45,103) D
20 836,938 25,791 D
21 752,602 (58,545) D
22 789,412 (21,735) R
23 749,622 (61,525) D
24 778,148 (32,999) R
25 984,664 173,517 R
26 721,704 (89,443) D
27 786,946 (24,201) D
28 704,340 (106,807) R
29 758,901 (52,246) D
30 823,594 12,447 R
31 727,1151 (84,032) R
Total: 25,145,561

As the list shows, the two largest districts right now, population wise, are 7 & 12. 7 is represented by Republican Dan Patrick who is committed to solving the budget crisis with his abortion sonogram bill. 12 is represented by Republican Jane Nelson.

Patrick and Nelson each represent more people than the states of Wyoming, Vermont, North Dakota, Alaska, South Dakota, Delaware, and Montana. (not combined, just each state individually)

Out of the districts that need to lose population 4 have Democratic state senators (10, 14, 15, 20), with the other 11 having Republican state senators.

Of the districts that need to add people, it’s exactly 8 Democratic districts (6, 13, 19, 21, 23, 26, 27, 29) and 8 Republican districts (1, 4, 9, 16, 22, 24, 28, 31).


District Population Deviation Party
1 146,509 (21,128) R
2 149,622 (18,015) R
3 145,984 (21,653) R
4 181,882 14,245 R
5 159,305 (8,332) R
6 170,168 2,531 R
7 161,276 (6,361) R
8 149,393 (18,244) R
9 145,381 (22,256) R
10 184,699 17,062 R
11 151,703 (15,934) R
12 149,506 (18,131) R
13 156,600 (11,037) R
14 182,078 14,441 R
15 222,505 54,868 R
16 203,299 35,662 R
17 166,171 (1,466) R
18 150,998 (16,639) R
19 139,948 (27,689) R
20 228,091 60,454 R
21 137,058 (30,579) R
22 126,184 (41,453) D
23 144,933 (22,704) D
24 181,472 13,835 R
25 141,704 (25,933) R
26 180,729 13,092 R
27 225,449 57,812 D
28 263,682 96,045 R
29 208,164 40,527 R
30 147,611 (20,026) R
31 165,121 (2,516) D
32 157,055 (10,582) R
33 148,929 (18,708) R
34 143,582 (24,055) R
35 151,882 (15,755) R
36 201,386 33,749 D
37 142,621 (25,016) D
38 182,363 14,726 D
39 172,273 4,636 D
40 215,412 47,775 R
41 185,698 18,061 D
42 171,951 4,314 D
43 148,370 (19,267) D
44 194,258 26,621 R
45 205,670 38,033 R
46 172,464 4,827 D
47 198,311 30,674 R
48 161,817 (5,820) D
49 141,144 (26,493) D
50 191,756 24,119 D
51 158,774 (8,863) D
52 219,345 51,708 R
53 145,845 (21,792) R
54 196,447 28,810 R
55 176,215 8,578 R
56 155,303 (12,334) R
57 144,556 (23,081) R
58 169,146 1,509 R
59 149,195 (18,442) R
60 148,990 (18,647) R
61 176,054 8,417 R
62 154,792 (12,845) R
63 218,386 50,749 R
64 219,345 51,708 R
65 224,883 57,246 R
66 160,543 (7,094) R
67 145,358 (22,279) R
68 135,942 (31,695) R
69 140,554 (27,083) R
70 300,801 133,164 R
71 146,722 (20,915) R
72 139,868 (27,769) R
73 187,204 19,567 R
74 143,566 (24,071) D
75 219,408 51,771 D
76 132,715 (34,922) D
77 132,567 (35,070) D
78 168,785 1,148 R
79 147,172 (20,465) D
80 149,638 (17,999) D
81 159,026 (8,611) R
82 163,234 (4,403) R
83 173,230 5,593 R
84 157,068 (10,569) R
85 143,267 (24,370) R
86 154,914 (12,723) R
87 152,193 (15,444) R
88 141,962 (25,675) R
89 253,976 86,339 R
90 141,349 (26,288) D
91 164,484 (3,153) R
92 154,749 (12,888) R
93 179,024 11,387 R
94 143,509 (24,128) R
95 155,511 (12,126) D
96 231,782 64,145 R
97 168,045 408 R
98 239,343 71,706 R
99 231,238 63,601 R
100 149,033 (18,604) D
101 163,601 (4,036) R
102 131,327 (36,310) R
103 117,346 (50,291) D
104 131,900 (35,737) D
105 164,238 (3,399) R
106 159,716 (7,921) R
107 140,457 (27,180) R
108 143,531 (24,106) R
109 175,255 7,618 D
110 150,703 (16,934) D
111 163,374 (4,263) D
112 148,911 (18,726) R
113 161,303 (6,334) R
114 126,576 (41,061) R
115 140,868 (26,769) R
116 142,944 (24,693) D
117 220,360 52,723 R
118 152,809 (14,828) D
119 157,106 (10,531) D
120 163,187 (4,450) D
121 158,873 (8,764) R
122 246,846 79,209 R
123 132,442 (35,195) D
124 178,044 10,407 D
125 162,162 (5,475) D
126 172,274 4,637 R
127 187,102 19,465 R
128 148,817 (18,820) R
129 150,798 (16,839) R
130 252,386 84,749 R
131 152,889 (14,748) D
132 264,426 96,789 R
133 155,296 (12,341) R
134 147,146 (20,491) R
135 166,937 (700) R
136 146,854 (20,783) R
137 137,876 (29,761) D
138 136,881 (30,756) R
139 150,919 (16,718) D
140 139,275 (28,362) D
141 184,720 17,083 D
142 154,794 (12,843) D
143 127,381 (40,256) D
144 169,715 2,078 R
145 132,730 (34,907) D
146 143,120 (24,517) D
147 146,857 (20,780) D
148 140,946 (26,691) D
149 169,836 2,199 D
150 212,484 44,847 R
Total: 25,145,561

The district with the largest population is 70 represented by Republican Ken Paxton.

54 House districts need to lose population, while 96 House districts need to add people.

Of the districts that need to lose population, 13 are represented by Democrats (27, 36, 38, 39, 41, 42, 46, 50, 75, 109, 124, 141, 149) and 41 are represented by Republicans.

Of the districts that need to add population, 36 are represented by Democrats (22, 23, 31, 37, 43, 48, 49, 51, 74, 76, 77, 79, 80, 90, 95, 100, 103, 104, 110, 111, 116, 118-120, 123, 125, 131, 137, 139, 140, 142, 143, 145-148) and 60 are represented by Republicans.

Of the 24 seats that Republicans picked up last November (I’m also counting the 2 turn coats), 8 districts (40, 45, 47, 52, 78, 93, 96, 117) will need to lose population and 16 districts (1, 3, 12, 21, 33-35, 57, 69, 85, 101, 102, 106, 107, 133, 134) will need to add people.

Texas Split

For those who don’t know “a clause in the document annexing Texas to the United States allowed for Texas to be divided into five different states.”

For more info on that topic, you can visit: http://www.snopes.com/history/…

Long story short, it’s kind of unnecessary since Article IV, Sec. 3 of the U.S. Constitution already allows for states to be split apart.

Since Texas can’t succeed (sorry Gov. Perry) I thought why not for fun split it into five states.

Texas being so big it’s hard to classify the state. East Texas in general is more like the old South. West Texas is more like the plains states. South Texas is more like a border state in the Southwest. In addition:

…El Paso, in the western corner of the state, is closer to San Diego, California than to Beaumont, near the Louisiana state line; Beaumont, in turn, is closer to Jacksonville, Florida than it is to El Paso. Texarkana, in the northeastern corner of the state, is about the same distance from Chicago, Illinois as it is to El Paso, and Dalhart, in the northwestern corner of the state, is closer to the state capitals of Kansas, Colorado, New Mexico, Oklahoma and Wyoming than it is to Austin, its own state capital.

http://en.wikipedia.org/wiki/G…

Here goes…

After racking my brain to come up with some clever names for these 5 new states I finally came up with North Texas, South Texas, East Texas, West Texas, Central Texas. I also tried to estimate how the 36 congressional districts might get split between the 5 new states.

Starting with the smallest and working our way up.

West Texas

Green

Pop. 1.8 million

66% White/26% Hispanic/6% Black/2% Asian

75% McCain/25% Obama

Major cities: Midland, Odessa, Abilene, Amarillo, Lubbock, San Angelo, and Wichita Falls.

Now Gov. Perry can go back to West Texas and be governor.

Think of this as the Texas of the movies, i.e. Giant.

In terms of population it’s in between West Virginia and New Mexico, which would give it 3 congressional districts. No matter what, this would be a state that Republicans would dominate.

Central Texas

Purple

Pop. 3.3 million

65% White/21% Hispanic/10% Black/4% Asian

54% McCain/46% Obama

Major cities: Austin, Round Rock, Killeen, Temple, Fort Hood, Waco, Bryan, College Station

Although it has a Republican lean, I could easily see this state having a Governor Chet Edwards. A moderate-conservative Democrat could win statewide here.

In terms of population, it would be between Iowa and Connecticut with probably 4 congressional districts with maybe a 3-1 Republican majority or even at 2-2.

South Texas

Blue

Pop. 5 million

68% Hispanic/26% White/4% Black/2% Aisan

56% Obama/44% McCain

Major cities: San Antonio, El Paso, Laredo, Corpus Christi, Brownsville, McAllen

A state with a solid Hispanic majority, it’s a state that Democrats would definitely be the governing majority.

In terms of population, it would be just ahead of Colorado, so it would likely have 7 congressional districts, possibly all Democrats or a 6-1 Democratic majority.

East Texas

Yellow

Pop. 7.1 million

53% White/25% Hispanic/17% Black/5% Asian

56% McCain/44% Obama

Houston would be the dominate city in this state, followed by the smaller ones like Beaumont and Galveston

This state would definitely a Republican majority, but the right Democrat could probably win it.  If the minority population continues to increase, so could the Democratic influence. The right Democrat could probably have a chance here.

In terms of population, it would be in between Washington and Virginia so probably 10 congressional districts with a 6-4 Republican split or 7-3 Republican tilt.

North Texas

Pink

Pop. 7.7 million

64% White/18% Hispanic/13% Black/5% Asian

58% McCain/42% Obama

Major cities would of course be DFW, followed by the bedroom communities around them plus Tyler.

An even stronger Republican tilt, but again like East Texas, with increasing minority strength, it should be contested by Democrats.

In terms of population, again like East Texas, in between Washington and Virginia, so again, 10 congressional districts with a 6-4 or 7-3 Republican tilt.

For the two left over congressional districts, I’d lean to towards giving one to Central Texas and one to South Texas.  Both lean closer than the others to getting the extra seats.

In terms of the Electoral College, Democrats would come out ahead. The new division means the Senate and the Electoral College have to grow.

West Texas: 5 EV

Central Texas: 7 EV

South Texas: 10 EV

East Texas: 12 EV

North Texas: 12 EV

Republicans would conceivably win 36 EV, while Democrats would win 10 EV. The new reapportionment mean Texas gets 38 EV votes likely to go Republican.

Redistricting At Large States (Sans Alaska)

Just for fun, I wanted to see what I could come up with in the event the House of Representatives increases in size so that each state with an at-large representative (excluding Alaska which isn’t yet supported) gets a second rep.

Couldn’t remember it being done (if it has, sorry for the repetitiveness).

Funny, I read left to right, but redistrict right to left.  I guess it’s that manifest destiny thing, moving from east to west.

Delaware, Montana, North Dakota, South Dakota, Vermont, and Wyoming.

CD1, Lean Republican

Blue

86% White, 9% Native American, 2% Hispanic

54% McCain/46% Obama

CD2, Lean Democratic

Green

93% White, 3% Native American, 2% Hispanic

51% Obama/49% McCain

Even though the app doesn’t have the presidential breakdown, it’s pretty easy to figure it out when you keep the counties together and then just get the county figures. The county that’s split in Montana had a corresponding map that I was able to allocate the votes.

CD1, Lean Democratic

Blue

94% White, 3% Native American

52% Obama/48% McCain

Earl Pomeroy might still be a Congressman with this district.

CD2, Safe Republican

Green

90% White, 7% Native American

39% Obama/61% McCain

CD1, Lean Republican

Blue

94% White, 3% Native American

49% Obama/51% McCain

Stephanie Herseth-Sandlin might also still be in Congress with a district like this.

CD2, Likely Republican

Green

83% White, 13% Native American

42% Obama/58% McCain

CD1, Safe Republican

Blue

89% White, 7% Hispanic

34% Obama/66% McCain

CD2, Safe Republican

Green

89% White, 5% Hispanic, 3% Native American

33% Obama/67% McCain

This was a little interesting.  When I ran the 2006 numbers for the Congressional race between Gary Trauner (D) and Barbare Cubin (R) the result was a little different.

CD1, 50.12% Trauner/49.87% Cubin

45846/45624

CD2, 49% Trauner/51% Cubin

46478/47712

So by those numbers Gary Trauner would have been a Congressman by 222 votes.

CD1, Safe Democratic

Blue

95% White

70% Obama/30% McCain

CD2, Safe Democratic

Green

97% White

68% Obama/32% McCain

Surprisingly easy to break up Washington County (Montpelier) and allocate the votes.  Wikipedia had maps for the locations of the towns which is how the Secretary of State’s office broke down the election results in that county. Just put the towns into the right districts.

In case you might be wondering, since I ran the 2006 numbers in Wyoming, I also did it in Vermont (Peter Welch vs. Martha Rainville) where the Republicans had their big recruit.  Unfortunately for the Republicans, she lost in both districts.

CD1, 53% Welch/47% Rainville

69203/62567

CD2, 56% Welch/44% Rainville

70612/54456

CD1, Safe Democratic

Blue

70% White, 20% Black, 6% Hispanic, 3% Asian

63% Obama/37% McCain

CD2, Likely Democratic

Green

75% White, 17% Black, Hispanic 4%

55% Obama/45% McCain

A big asterisk needs to go by this map, because it is a big guesstimate. New Castle County didn’t have easy precincts or districts that corresponded to the map.  Or if it did, I couldn’t find it.  The election district maps I found at the Delaware Elections site were .pdfs of each small election district with breakdowns, but I didn’t feel like playing Match Game with them.

I used the state house races in New Castle and gave the Democratic votes to Obama and the Republican votes to McCain.  Obviously, I didn’t get the right numbers, I know. Again, I just did it for fun.

TX Redistricting 20R-16D Map

Never done a map, so I thought why not.

First, I have no illusions that there is anyway a map that would have the chance to elect 16 Democrats would ever pass the current legislature, let alone survive a veto by Rick Perry.

I just wanted to see if i could a map that had districts that were a little more compact.

Let me just say that I threw out most of the current map and renumbered the districts and probably ended up redistricting a lot of current reps out of their districts.  

I also threw out the old numbers. I just have this pet peeve about numbering.  I hate to have district 1 and then district 2 on the other side of the state.  You can pretty much follow a trail from NE TX to SE TX, over to Houston, down the coast to the border, up to San Antonio, then Austin, then to El Paso, up to the Panhandle and south, then over and north into DFW.

Photobucket

TX-1, Safe Republican

Blue, NE corner of the state.

76% White, 16% Black, 7% Hispanic, 2% Asian

70% McCain/29% Obama

I think I redistricted Louie Gohmert out of this district and into the 2nd, which contains most of his old district.

TX-2, Safe Republican

Green, east Texas

73% White, 16% Black, 9% Hispanic, 1% Asian

70% McCain/29% Obama

TX-3, Safe Republican

Dark Magenta, SE corner of the state.

63% White, 21% Black, 13% Hispanic, 3% Asian

59% McCain/41% Obama

I gave the Golden Triangle (Beaumont, Port Arthur, & Orange) it’s own district.  I redistricted Ted Poe out of this district.  Although it’s a 60-40 district, I think someone like Nick Lampson could have a chance in it since it contains both Beaumont and Galveston.

Photobucket

TX-4, Safe Republican

Red, just north of Harris County (Houston)

77% White, 13% Hispanic, 8% Black, 2% Asian

73% McCain/26% Obama

Although it has less population than the other districts, it’s a fast growing area that will likely grow.  I also figured why not give the Houston suburbs their own district.

TX-5, Safe Republican

Gold

67% White, 15% Hispanic, 11% Black, 6% Asian

62% McCain/37% Obama

As Houston expands, this area may get more Democratic.  I don’t live in the Houston area, so I can’t say for certain.

TX-6, Safe Democratic

Teal

Majority-Minority

37% Hispanic, 33% White, 24% Black, 6% Asian

60% Obama/40% McCain

TX-7, Lean Democratic

Dark Gray

Majority-Minority

41% Hispanic, 40% White, 14% Black, 4% Asian

51% Obama/48% McCain

TX-8, Likely Republican

Slate Blue

Majority-Minority

47% White, 40% Hispanic, 9% Black, 4% Asian

56% McCain/43% Obama

TX-9, Safe Democratic

Cyan

Majority-Minority

33% White, 31% Hispanic, 29% Black, 6% Asian

67% Obama/32% McCain

TX-10, Likely Democratic

Deep Pink

Majority-Minority

34% White, 26% Hispanic, 26% Black, 14% Asian

55% Obama/45% McCain

TX-11, Likely Republican

Chartreuse

56% White, 22% Hispanic, 14% Black, 8% Asian

56% McCain/43% Obama

TX-12, Safe Republican

Cornflower Blue

59% White, 28% Hispanic, 9% Black, 3% Asian

65% McCain/34% Obama

Ron Paul gets to keep his seat.  This district combines most of the current 14th and 25th CDs.

TX-13, Lean Democratic

Dark Salmon

Majority-Minority

70% Hispanic, 26% White, 2% Black, 2% Asian

54% Obama/45% McCain

Although it’s a lean Democratic district, the right Democratic shouldn’t have trouble holding it.  This district takes in Corpus Christi and Brownsville.

TX-14, Safe Democratic

Olive

Majority-Minority

86% Hispanic, 13% White, 1% Asian

67% Obama/32% McCain

A border district, easy hold.

TX-15, Safe Democratic

Dark Orange

Majority-Minority

88% Hispanic, 10% White, 1% Asian

68% Obama/31% McCain

This district is anchored by Laredo.  Henry Cuellar gets to keep his job.

TX-16, Safe Democratic

Lime

Majority-Minority

71% Hispanic, 20% White, 7% Black, 2% Asian

66% Obama/33% McCain

Encompasses most of San Antonio.  Charlie Gonzalez gets to keep his job.

TX-17, Toss Up

Dark Slate Blue

Majority-Minority

50% Hispanic, 41% White, 5% Black, 3% Asian

50% Obama/49% McCain

This would be my new district.  I took in more of San Antonio and Bexar County and was able to cut down the size of this district.  Rather than stretching to El Paso, it now only goes to Del Rio.  In addition to cutting down the size, I also cut out a lot of the Republican areas in northern Bexar County that really came out in 2010 (such as Fair Oaks Ranch and Stone Oak).  Ciro Rodriguez could probably win this district.

TX-18, Safe Republican

Yellow

64% White, 26% Hispanic, 7% Black, 3% Asian

62% McCain/37% Obama

Democrats in the NE part of Bexar County won’t like it, but I made Lamar Smith’s district much more Republican.  I took those Republican areas from Ciro’s old district (haven’t gotten used to having Canseco yet) and gave them to Lamar Smith.  Austin Democrats should love this district because no longer do they have to deal with Lamar Smith.

TX-19, Safe Democratic

Lime Green

56% White, 30% Hispanic, 8% Black, 6% Asian

68% Obama/30% McCain

Here’s another reason Austin Democrats should love this map…Austin gets its own district.  Welcome back to a compact district Lloyd Doggett.

TX-20, Toss Up

Pink

65% White, 23% Hispanic, 8% Black, 4% Asian

50% Obama/49% McCain

Thanks to Travis, Bastrop, and Hays Counties, this district is a toss up and may continue in the Democratic direction.

TX-21, Safe Republican

Maroon, West Texas and Border

57% White, 38% Hispanic, 3% Black, 2% Asian

71% McCain/28% Obama

This district combines a lot of the current 23rd as well as the current 11th.  This district is dominated by San Angelo, Midland, & Odessa.

TX-22, Safe Democratic

Sienna

Majority-Minority

76% Hispanic, 18% White, 3% Black, 2% Asian

65% Obama/34% McCain

Silvestre Reyes gets to keep his El Paso district.

TX-23, Safe Republican

Aquamarine, Panhandle

66% White, 26% Hispanic, 6% Black, 2% Asian

74% McCain/25% Obama

Republicans keep breaking up Austin, so I thought I’d combine Amarillo and Lubbock and let them fight over one district.

TX-24, Safe Republican

Indigo, West Texas

70% White, 22% Hispanic, 6% Black, 2% Asian

74% McCain/25% Obama

Abilene is the biggest city here.  Charlie Stenholm might have been able to win this district.

TX-25, Likely Republican

Pale Violet Red

69% White, 16% Hispanic, 11% Black, 4% Asian

55% McCain/43% Obama

North of Austin it takes in Williamson County and Killeen.

Photobucket

TX-26, Safe Republican

Gray

67% White, 16% Black, 14% Hispanic, 2% Asian

66% McCain/33% Obama

Waco is the predominant city here.

TX-27, Safe Republican

Red

86% White, 9% Hispanic, 3% Black, 2% Asian

75% McCain/25% Obama

TX-28, Likely Republican

Dark Green

64% White, 24% Hispanic, 8% Black, 4% Asian

57% McCain/42% Obama

Western Tarrant County/Fort Worth.  Depending on where she resides, this district could be ripe in some years for a Congresswoman Wendy Davis.

TX-29, Lean Democratic

Dark Sea Green

54% White, 21% Black, 18% Hispanic, 6% Asian

53% Obama/47% McCain

SE Tarrant County/Fort Worth and Arlington.  If Wendy Davis wanted a better district right away, she could choose this one.

TX-30, Safe Republican

Yellow

80% White, 9% Hispanic, 5% Asian, 5% Black

65% McCain/34% Obama

TX-31, Safe Republican

Khaki

76% White, 11% Hispanic, 7% Asian, 6% Black

60% McCain/39% Obama

TX-32, Likely Republican

Cyan

67% White, 14% Hispanic, 11% Asian, 8% Black

57% McCain/42% Obama

TX-33, Safe Republican

Dark Goldenrod

78% White, 12% Hispanic, 7% Black, 2% Asian

69% McCain/30% Obama

TX-34, Toss Up

Lime Green

Majority-Minority

47% White, 35% Hispanic, 11% Black, 7% Asian

50% Obama/49% McCain

As Dallas goes more Democratic, so should this district.

TX-35, Toss Up

Dark Orchid

53% White, 27% Hispanic, 15% Black, 4% Asian

50% Obama/49% McCain

Second verse, same as the first.

TX-36, Safe Democratic

Orange

Majority-Minority

41% Black, 31% Hispanic, 26% Black, 2% Asian

80% Obama/20% McCain

SD-Gov: Herseth Sandlin In?

From Stateline.org:

By contrast, the Republicans have serious concerns only about Arizona, the three open seats in solidly Democratic territory (California, Hawaii and Rhode Island) plus Nevada, where first-term Gov. Jim Gibbons has gotten himself into a series of self-inflicted scrapes, and South Dakota, where a strong Democratic candidate, U.S. Rep. Stephanie Herseth Sandlin, is planning an open-seat bid.

Hardly definitive, but this phrasing makes it sound pretty certain she’s going to run.

IL-Sen: Giannoulis & Schakowsky Looking to Primary Burris

From the Chicago Sun-Times:

Newly appointed Sen. Roland Burris opened a campaign fund to raise money for a 2010 election bid as it looks like he may face a Democratic primary challenge: State Treasurer Alexi Giannoulias is mulling a Senate run, and Rep. Jan Schakowsky isn’t ruling it out.

Trust me on this — Giannoulias, who the ability to self-finance a campaign, is looking very closely at challenging Burris. Schakowsky is also considering her first statewide run. An issue for Burris — in office for a week — would be to explain to Illinois voters in the February 2010 Democratic Illinois primary why he took an appointment from the tainted Gov. Blagojevich…

MO-Sen: Bond Not Running Again

Via Political Wire from Politico:

Sen. Kit Bond, the senior Republican from Missouri who sits on powerful Senate committees, announced Thursday that he will not run for reelection in 2010, giving Democrats a shot to pick up a seat in a state that has emerged as a major battleground.

The announcement is a blow to Senate Republicans who now will have at least four of their incumbents seeking retirement at the end of the session, a sign that 2010 could be another tough cycle for the weakened GOP minority.

In addition to Bond, Sens. Mel Martinez of Florida and Sam Brownback of Kansas are retiring, and Sen. Kay Bailey Hutchison of Texas may run for governor of her home state, creating another opening.