Today in the Texas House, the Committee Substitute to HB 600 was read a 3rd time and passed.
HB 600 redraws the State Board of Education seats.
There has been some talk about increasing the size of the SBOE. It currently has only 15 members which means the ideal population size for the new districts is 1.6 million.
Who cares about some SBOE seats? Considering that Texas is one of the biggest buyers of textbooks (when the state has the money to purchase them), and that these 15 people decide what goes in the textbooks, these 15 seats can have a national impact.
So what did the House finally agree to?
It should be noted that all 15 of these seats will be up in 2012. The year after redistricting all of the members of the State Senate and the State Board of Education run. They then draw to see who runs in 2 years (i.e. 2014) or 4 years (i.e. 2016)
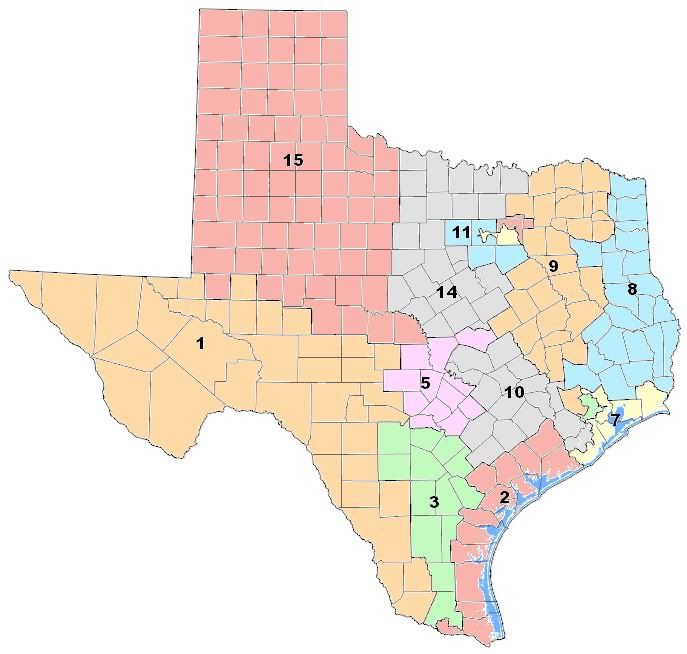
First, here’s a map of the current SBOE districts.

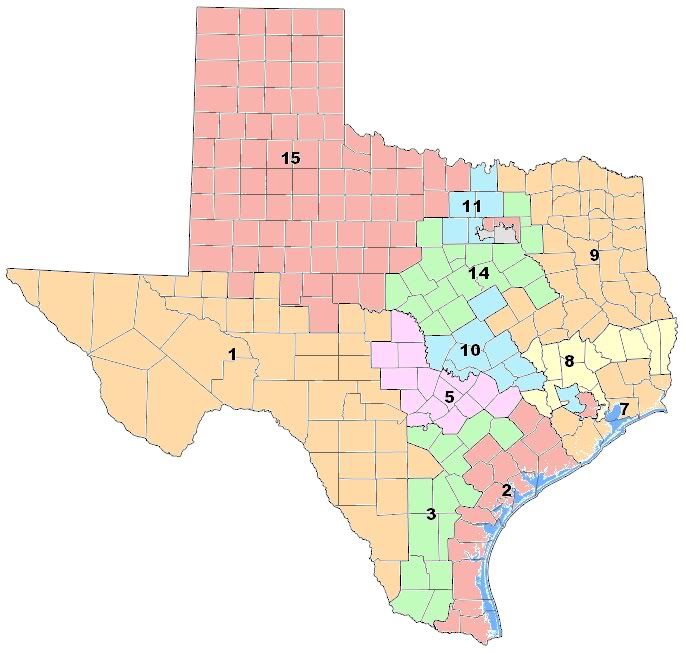
The new districts:

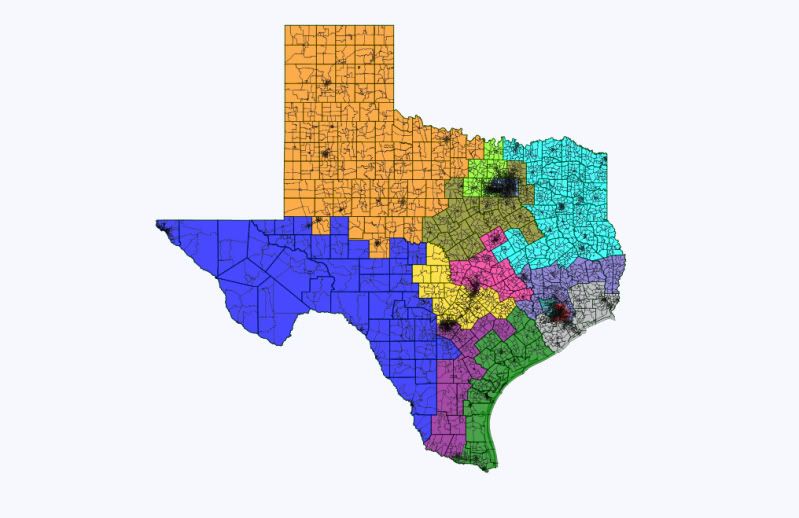
New districts in Dave’s App

These maps are from the state’s redistricting website, but they didn’t provide any partisan data. So I drew them using Dave’s App.
District 1
Lean-Likely D
55% Obama/45% McCain
73% Hispanic, 24% White, 3% Black, 1% Asian
This district is interesting because in 2010 it elected a Republican. The incumbent Democrat may have gotten a little complacent having been elected in 1988 and his only previously close election being in 1994 when he won 53% to 47%. Although with a district that contains both El Paso and Laredo, you have to think you’d be pretty safe as a Hispanic Democrat. Democrats have the chance to recapture this seat in 2012.
District 2
Lean D
52% Obama/47% McCain
69% Hispanic, 27% White, 3% Black, 1% Asian
This district features a longtime incumbent with Democrat Mary Helen Berlanga. She’s been on the board since 1982. That’s long enough to have been elected to the SBOE (in 1982), appointed to the SBOE (in 1984 when the Lege made it an appointed body), and elected again (in 1988 when it went back to an elected body). In spite of the closeness of this district, Berlanga has managed to solidly win every time.
District 3
Safe D
60% Obama/39% McCain
68% Hispanic, 27% White, 7% Black, 2% Asian
This district pretty much stays safe for a Democrat.
District 4
Light Red (next to District 7)
Safe D
73% Obama/26% McCain
49% Hispanic, 30% Black, 16% White, 5% Asian
Stays a solid Democratic district.
District 5
Yellow
Lean-Likely R
44% Obama/54% McCain
60% White, 31% Hispanic, 6% Black, 4% Asian
This district still takes in heavily Republican areas in north Bexar County. In Bexar County it trades some Republican areas in NE Bexar County (Live Oak, Universal City, Converse, Schertz, and Randolph AFB) for some others (Alamo Heights, Olmos Park, and Terrell Hills). It keeps the Republican counties of Kendall, Comal, and Guadalupe. It only slightly increases its coverage of Travis County. It sheds Bell County which contains Killeen-Temple-Fort Hood.
District 6
Light Blue (below District 8, directly to the left of District 4)
Likely R
41% Obama/58% McCain
48% White, 30% Hispanic, 12% Black, 11% Asian
This district pretty much stays the same, only losing a small slice of Harris County.
District 7
Likely R
41% Obama/58% McCain
54% White, 18% Black, 19% Hispanic, 9% Asian
This district sheds east Harris County and adds 4 new counties. This could be a ripe district for Democrats to target because the new configuration includes Fort Bend County. This county has been trending Democratic. In 2008, the county went 49% Obama/51% McCain. In 2010 it went 47% Bill White/52% Rick Perry.
District 8
Safe R
65% White, 20% Hispanic, 11% Black, 4% Asian
This district has some changes. Previously it ran up east Texas. It now moves south and becomes more compact.
District 9
Safe R
30% Obama/70% McCain
73% White, 15% Black, 11% Hispanic, 2% Asian
This district takes in a lot of the old 8th.
District 10
Toss Up
49% Obama/49% McCain
61% White, 21% Hispanic, 12% Black, 6% Asian
I never thought I’d be able to write tossup about either a State Senate seat or an SBOE seat. *The 2008 vote totals for this district were 298,091 for Obama and 298,430 for McCain. 339 votes. Democrats may finally be able to win a new seat on the SBOE. If Judy Jennings wants another crack at this seat, 2012 is the year to do it with the presidential race and Travis County. This district now doesn’t go all the way from Austin to the Houston suburbs.
*Thanks to Greg at Greg’s Opinion for the updated numbers. And thanks to blank for the prodding that got the update.
District 11
Safe R
37% Obama/62% McCain
67% White, 17% Hispanic, 9% Black, 6% Asian
Takes in plenty of Republican areas to still make it safe for Republicans.
District 12
Red (covers northern portion of Dallas County and NE quadrant of Tarrant County)
Likely R
43% Obama/57% McCain
58% White, 21% Hispanic, 12% Black, 8% Asian
Here is another potential opportunity for Democrats. It sheds Rockwall County and a portion of Collin County, while adding a portion of Tarrant County. Thanks to the success of Dallas County Democrats, this district has the potential to be competitive.
District 13
Gray (weird looking district that covers Dallas and Tarrant counties)
Safe D
69% Obama/30% McCain
41% Hispanic, 26% White, 30% Black, 4% Asian
Takes in more of Tarrant County, but continues to be a safe Democratic seat.
District 14
Safe R
32% Obama/67% McCain
71% White, 14% Hispanic, 7% Black, 7% Asian
District 15
Safe R
25% Obama/74% McCain
65% White, 27% Hispanic, 6% Black, 3% Asian
Currently the board is split 4 D – 11 R. If Democrats play their cards right, they could conceivably wind up with a 6 D – 9 R split on the SBOE. Democrats should go for broke and make a serious play for Districts 5, 7, & 12, if only to try and get an idea of what the Democratic performance is like in the new districts.
Populations for districts are VAP from the state.
I finished mapping out the new state house maps in DRA last night and will be working on a spreadsheet and posting that this weekend with the 2008% and racial breakdowns.
A constant 6-9 is a pretty big get for us, especially if the GOP is hit down to just 2 “swing/moderate” individuals. My mom was a close friend to Laura Ewing who ran for district 7 in 2008 and did well all things considered (no money, excellent candidate). Problem is as Fort Bend shits dem, Galveston shits GOP. Thanks for positing White’s Fort Bend numbers, after seeing that, I’m convinced Obama is winning Fort Bend in 2012, I hope the county party gets their act together and starts drafting some great candidates who can ride the wave!
I agree with trowman, and I too thank you for posting this. In fact, I have been saying to any who will listen that I think this map is an illegal retrogression. Here are the important facts:
1) It created no new majority-minority or VRA protected seats despite Texas’s clear growth in minority demographics.
2) It reduced the minority representation in 4 of the 5 VRA protected seats.
3) It reduced the minority representation in the 1 non-VRA protected majority-minority seat.
4) It drew a district line through the middle of a minority community in Austin .
(1) & (2) combined are the definition of retrogression. (3) & (4) just make the case stronger, even though they shouldn’t even be necessary.
Also, your and Greg’s numbers don’t agree on this map. Furthermore, you demographic info doesn’t agree with District viewer. Where did you get your numbers?
Finally, we have quite a few Waco Democrats who lost last cycle, Edwards, Dunnam… Maybe one of them is interested in District 10?
I also added some tags for your diary, since I think this is pretty important stuff that is getting neglected.
I enjoy seeing down-ticket redistrictings, even when I can’t comment intelligently on them.