Help Support Dave’s Redistricting App

(Bumped – promoted by DavidNYC)

Guys, it’s time to shell out to help Dave’s Redistricting App. I mean it.

For two years, countless Swingnuts have drawn innumerable maps using Dave’s App, which filled a huge void in an enormously crucial way. Indeed, as we wade further and further into redistricting season, it’s almost impossible to imagine what things would be like without the app. If it weren’t for one man’s vision, energy, talent, and dedication, we’d still be mucking around with Microsoft Paint. In short, Dave’s has been a total game-changer for us, and we owe him a great deal.

Until now, we haven’t had a good way to show our appreciation for Dave’s generosity, but fortunately Dave’s app recently became a project of Progressive Congress – and we can support his efforts through his new partner to improve and expand the app. As Dave himself explained:

This means that more members and visitors of Progressive Congress will get to know about DRA and that more users of DRA will get to know about Progressive Congress. This means that the Progressive Congress team will be providing advice and guidance for DRA. (Some of Darcy [Burner]’s suggestions have already been included in the app, in fact.) This means that Progressive Congress and DRA will be teaming up to help you better understand what’s going on with redistricting and what you can do about it. And this means working together to make government better for the people!

In seven-and-a-half years of running SSP, I don’t think I’ve ever solicited money for anyone or anything other than Democratic candidates running for office. This is going to be my one big exception, and I’m going to be blunt here:

If you’ve ever drawn a map with Dave’s App, or enjoyed a diary that featured maps drawn with the app, you need to plunk down some change to support Dave.

It’s important that we support Dave’s hard work over the last two years and his continued work in the future, so any amount is appreciated. I know you can skip Starbucks for a week to find $5 or $10. (If a monetary contribution is genuinely beyond your means, then you should contact Dave to see how you can help with adding new data to the app.) And here’s a nice side-benefit: All contributions are tax-deductible.

I just threw down $100, and I hope everyone else here joins in. While there are many things which have made the Swing State Project a great site, I think it’s safe to say that Dave’s Redistricting App is definitely one of them, and I’m proud to support him. I hope you’ll do the same.

UPDATE: I just got a report from Progressive Congress, and we’ve raised $590 from 18 people so far. I’d love to hit $600 and 20 donors. Who can put us over the top?

Arkansas Redistricting: New Pres Numbers by CD

Arkansas rounds out the first batch (along with Iowa and Louisiana) of states finishing their redistricting tasks, so we’ve crunched the data to see how the last few elections went in the newly-designed districts. (If you’re unfamiliar with the new map, which wound up without the infamous “Fayetteville Finger,” you can take a gander here.)


District Obama # McCain # Obama % McCain % Beebe % Keet % Lincoln % Boozman %
AR-01 102,670 151,918 39.17 57.96 67.68 30.32 42.29 52.34
AR-02 129,888 157,732 44.29 53.79 66.06 32.28 42.02 53.77
AR-03 85,866 161,902 33.86 63.85 57.84 39.93 26.01 68.32
AR-04 103,886 166,465 37.41 59.95 65.54 32.52 36.49 58.07

Unlike last decade’s map (which placed in Arkansas in the company of only Iowa and West Virginia in keeping every county intact), the new Arkansas map splits several counties down the middle, making this a more difficult task than Iowa (and more difficult than Louisiana, which seems to have more useful data). Jeffmd’s data crunching involved not only some estimation of how to allocate absentee ballots, but also some approximation of Sebastian County (i.e Fort Smith, now split between the 3rd and 4th) votes, which aren’t listed by precinct but rather by polling location, meaning rather tediously mapping the county and pinpointing polling places. (You can check out the full spreadsheet here.)

Despite controlling the redistricting trifecta here (the Gov. plus both legislative chambers), it doesn’t seem like Arkansas Dems did much to advance their cause here, leaving the numbers pretty much as is, despite shifting around a lot of counties (especially in the dark-red northwest, where there’s now an unsightly bulge of the 4th into the former 3rd). The old districts were 38 Obama/59 McCain in AR-01, 44/54 in AR-02, 34/64 in AR-03, and 39/58 in AR-04… hardly any change at all, although the 1st improved very slightly at the expense of the 4th. If there was any consideration given to either improving Dem chances at picking up the 2nd or strengthening the 4th in the event of a Mike Ross retirement, it didn’t pan out.

Puerto Rico: What its six districts would look like if it were a state

I like to think of interesting topics for diaries and this is one that came to me. If Puerto Rico was a state it would have six seats. I looked at the census data, did a spreadsheet and filled in my map based on my calculations. I took a few guesses on splitting municipalities, so the deviations aren’t exact at all. It would be nice if this was made available on the Redistricting App if possible (obvious hint to Dave), so everyone could work with this just for hypotheticals.

Photobucket

Now, since Puerto Rico has no presidential vote, it’s hard to say how any of these districts would vote or how they’d lean. Since Puerto Rico has it’s own parties, I assume elections would be decided on issues relating to those parties and it doesn’t seem to heavily lean toward either of the main ones there. Many in the PPD align with Democrats, while the PNP has a mix of those who align with the US parties, with those leaning toward Republicans having the edge.

PR-1:

Mayaguez anchors this district. Looking at previous election results, the PPD  seems to do very well in and around Mayaguez, so it would probably lean PPD/Dem.

PR-2:

Ponce is the population center and leans PPD, but it also includes many of lower population density areas, which seem to lean PNP. I would guess it would be a toss-up.

PR-3:

Toa Alta and Toa Baja make up the biggest share of population here, both of which have PNP mayors and seem to vote PNP in most gubernatorial elections, which indicates a PNP lean for this district.

PR-4:

Bayamon is largest municipality and has a pronounced PNP lean, but PPD leaning Cauguas makes a up a good share of the district as well, which adds balance. It might be a toss-up or slight PNP lean.

PR-5:

The capital of San Juan anchors the district smallest in size. San Juan swings between both parties, with a slight edge to PPD. PPD leaning Carolina is also a portion of this district, which should equal a PPD edge overall for this district.

PR-6:

Has a portion of PPD leaning Carolina, but all the rest, save for Humacao, leans PNP. It doesn’t appear that there is a huge edge toward either side, so I’d all it a toss-up.

Overall, none of this analysis counts for much, as we have no idea how Puerto Rico would swing on a federal level. The island is socially conservative, but economically liberal in many aspects and that could be what determined a lot of voting patterns.

Geenius at Wrok Attempts to Redistrict Illinois

So, on the one hand, I love fairness and justice and support the Voting Rights Act.

On the other hand, I hate stupid gerrymandering and the jiggering of districts to try to make them “safe.” For either party. (I mean, really, it’s fun to pretend to be Tom DeLay for a while . . . but only on Halloween.)

So I decided to use Dave’s Redistricting App to try my hand at redistricting Illinois. Fo’ realz. As in, I wanted to create a map that (a) could actually be adopted, (b) wouldn’t make an outsider gape in horror and (c) within those parameters, does all the things a good liberal would like it to do. Unlike other posters here, I’m not trying to optimize for Democratic interests — I’m trying to optimize for the interests of everyone in the state. A state that happens to contain a lot of Democrats.

One problem, though, is that I don’t know where to find the district-by-district voting data that would tell me which of my districts are solid Democratic, solid Republican or leaners. I can make educated guesses, but I don’t know for sure. This is one of the things I’m hoping you folks will help me with.

Photobucket

Methodology and more maps below the jump.

I began my mapmaking process without reference to existing districts. Outside Chicagoland, I formed districts around Census-recognized metropolitan and micropolitan statistical areas. For instance, in my map, IL-15 began as the Peoria MSA. As I saw where districts were forming, and knowing how many districts I ultimately had to create, I made the Springfield MSA part of IL-15 as well, then joined them by adding the counties in between. To my mind, metropolitan areas are “communities of interest,” and stunts like splitting Bloomington in half to dilute its vote burn my ass. (That being said, a large enough city may certainly contain more than one community of interest, but I’ll come to that later.)

Within Chicagoland, I started off with locally recognized super-communities: North Side, Northwest Side, West Side, etc. Because of the need to create majority-minority districts, I drew district lines along sharp ethnic boundaries (which in any case are inseparable from people’s notions of what neighborhoods belong to which “side”). None of these districts was large enough to be contained within the city, so I extended them outward into Cook County in ways that (I hoped) wouldn’t dilute their composition too much. Particularly in western Cook County, this took some jiggering.

As much as possible, I strove to keep these areas intact and my district boundaries in close conformity to county boundaries. Where I couldn’t go by counties, I tried to go by townships. I violated the convexity principle only where necessary to achieve population balance in a district, and I avoided “stringy” districts entirely. I can’t stand those things.

All districts deviate less than 1 percent from equal population share (712,813).

Enough talk. Maps!

Photobucket

Closeup on Chicagoland.

Photobucket

Central and southern Chicago.

IL-01 (South Side Chicago, Evergreen Park, Oak Lawn): 712,314, 62% black, 25% white, 10.3% Latino

IL-02 (Southwest Side Chicago, Burbank, Lemont): 712,295, 56.9% Latino, 31.4% white, 6% black

IL-03 (South Loop, West Side Chicago, Oak Park, La Grange, Burr Ridge, Argonne): 715,690, 41% white, 38.2% black, 14.1% Latino, 5.3% Asian

IL-01 was the easiest to draw. IL-02 was easy to draw in the city and inner suburbs, but became tricker the further out I had to go. Its shape comes in part from southward pressure from IL-03, which was a lot more difficult. The West Side has really emptied out in the last decade, and it was a challenge to include enough African American residents, even reaching out into the majority-black suburbs. I tried to make sure the district comprised the more progressive western suburbs.

Photobucket

Northern Chicago.

IL-04 (Northwest Side Chicago, Bensenville, Addison): 714,664, 49.6% white, 40.8% Latino, 5.4% Asian

IL-05 (North Side Chicago, North Shore): 715,394, 67.7% white, 10.8% Latino, 10.1% Asian, 9.3% black

I wish I could have stretched IL-04 all the way out to Elgin, but it wasn’t to be; any direction I try to expand it in just dilutes the Latino vote further. This seems to be as good as it gets. To compensate, it includes the Albany Park neighborhood, which is home to a large population of immigrants of various ethnicities, who presumably will share certain interests with the Latino community. IL-05 originally included Skokie and Lincolnwood, but then I decided to give those to IL-07 (to give the northwest suburban district more Democrats) and drown wealthy Wilmette, Kenilworth and Winnetka in a sea of lakefront liberals. Ha! (And you can’t say it’s not a community of interest, because if there’s one thing true North Shore residents agree on, it’s that if it’s inland, it’s not the North Shore! If cliquish identity protection doesn’t indicate a community of interest, what does?)

Photobucket

Northern Chicagoland.

IL-07 (Skokie, Northwest Cook): 716,103, 74.2% white, 13.2% Asian, 9.5% Latino

IL-08 (Lake): 710,303, 69.3% white, 16.8% Latino, 6.3% black, 6.2% Asian

IL-09 (McHenry, Elgin, Schaumburg): 710,672, 71.4% white, 16.8% Latino, 7.9% Asian

The northwest suburbs are clearly a community of interest and belong together, though I tried to give the sprawliest parts of Outer Sprawlville to IL-09. Lake County was so close to the necessary population size all by itself that it made sense to make it a single district, with just enough of McHenry County to finish the job.

Photobucket

DuPage County.

IL-10 (DuPage, Geneva-St. Charles): 713,223, 76.3% white, 9.9% Latino, 9.1% Asian

This district’s backbone is the Metra Union Pacific West Line (there’s a bright-line distinction in my mind between streetcar suburbia and sprawl suburbia). Naperville had to be cut out because otherwise the population would just be too darn big, and because I think Napervillians need to be cognizant of the fact that there wouldn’t be a Naperville without Aurora.

Photobucket

Western and Southern Chicagoland.

IL-06 (South Cook, University Park): 712,794, 52.2% black, 36.5% white, 8.9% Latino

IL-11 (Kane, Naperville, Bolingbrook, Oswego): 713,266, 66.5% white, 18% Latino, 7.3% Asian, 7.2% black

IL-12 (Will, Kankakee): 715,230, 77.6% white, 11.3% Latino, 8.2% black

Unfortunately, Orland Hills and Tinley Park are just too populous and too white to include them in IL-06, which is why I violate county borders here to exclude them and include University Park. IL-11 and IL-12 practically drew themselves once the other Chicagoland districts were in place — except for Grundy County, where IL-12 meets IL-14 and even stepping down to township boundaries made it hard to find the right balance. My apologies to Morris. Aurora and Naperville will have to find some way to live together in peace and harmony.

Photobucket

Northwest Illinois.

IL-13 (Rockford, DeKalb, Northwest Illinois): 710,857, 82.7% white, 8.3% Latino, 6.4% black

This is the district I reside in at the moment, and it gives me pleasure to take the McHenry County exurbs away from Don Manzullo. Tool.

Photobucket

Central Illinois.

IL-14 (Quad Cities, Ottawa/La Salle, Western Illinois): 713,441, 89.5% white

IL-15 (Peoria, Springfield, Central Illinois): 707,857, 87.9% white, 7.6% black

IL-16 (Champaign, Bloomington, Decatur, Eastern Illinois): 708,620, 82.8% white, 8.4% black

Eggheads unite! No more shall Champaign and Bloomington be kept apart! (And no more shall one side of Bloomington be kept apart from the other!) Peoria and Springfield grew together organically, and IL-14, which seemed to be too underpopulated no matter what I tried, just sort of seeped into what was left between the other districts I drew, which is how it ended up including so much of the I-80 corridor.

Photobucket

Southern Illinois.

IL-17 (St. Louis MSA): 711,447, 82.1% white, 13.6% black

IL-18 (Southern Illinois): 716,642, 91.6% white, 5% black

I do have some concern about whether East St. Louis will be outshouted by exurban Tea Partiers, but without any voting data to go by, I have no basis for splitting up the Illinois portion of the St. Louis MSA. The highest-numbered district, in my scheme as in the current one, gets everything that’s left.

OK, so . . . does my districting scheme fail to maximize Democratic votes? Absolutely, yes, if maximizing Democratic votes means doing what silver spring did. But I’m not looking to maximize Democratic votes per se, but rather to let that voice come out where it’s naturally strong. If I have any concern on this score, it’s whether the lines I’ve drawn have accidentally amplified the Republican voice. That I wouldn’t want to do. My goal is a map that’s fair to everyone, yet reflects the reality of a majority-Democratic state.

So here’s what I’m asking for:

– Analysis of the likely partisan leanings of each of my districts, since I don’t have the voter data and don’t know where to get it, but obviously many of you do. (Envy! Envy!)

– Observations of where I’ve accidentally undermined my own goals (for instance, if I’ve actually violated the VRA somewhere).

– Suggestions of how I might improve my map without turning it ugly (and I think you know what I mean by “ugly”). My ultimate goal is a map that can be submitted to the state redistricting committee as the serious product of a concerned and involved citizen. Which I’m pretty sure will fall on deaf ears, but I still intend to try.

– Whether there’s any sufficiently large (let’s say, > 70,000 residents) community of interest somewhere that’s so much at odds with the rest of its surroundings that it needs to be part of a different district, and whether there’s any appropriate district near enough to which it could feasibly be joined.

5-2 Colorado Dem map

There have been many fantastic maps drawn that highlight the potential extremes of gerrymandering, from both political parties.  I humbly submit my attempt at making a safe 5-2 map in Colorado that will endure even in bad years for us.  Now, I know that either a compromise map or a court-picked one is likely due to the split control in the Colorado legislature, this is purely a what-if scenario if Democrats ran the process and were very aggressive.

Also, this is my first time using Dave’s redistricting app and I would appreciate comments and helpful criticism.

My goals were difficult.  Colorado is historically a Republican-leaning state and though our statewide ticket did great in 2010, we lost two of our five incumbent representatives.  The red counties simply got redder, but there is reason for optimism at the way some other areas of Colorado have trended, in particular the Denver area and suburbs, Boulder, and Fort Collins.

I started with this map as a baseline for what to expect in a tough election, that of the 2004 presidential race where Kerry lost Colorado by 5%, and compared that to Obama’s easy win in 2008.

Massive swings across the state, with the most impressive being those in the corridor from Colorado Springs, up to the top of the state.  Several counties flipped to blue in a big way…Larimer, Jefferson, and Arapahoe being the most significant I think for long-term Democratic strength in Colorado.

So it was my goal to build on the emerging Democratic strength in those areas, make two GOP vote sinks by combining Mike Coffman’s and Doug Lamborn’s districts, as well as Cory Gardner’s and Scott Tipton’s districts, and leave the rest reasonably safe for us.  Here goes:

In short, I looked to the maps being proposed by Colorado legislature Democrats for inspiration (primarily in what I did with CO-05, CO-06, and CO-07), and then read a number of good ideas in the comments that I tried to incorporate.

The maps proposed by Democrats in the legislature are good, and more or less ensure a 4-3 split for us by turning CO-06 into a Democratic district.  But they don’t budge the needle much in CO-03 or CO-04, leaving both as winnable, but still Republican-favored.  Such is the nature of compromise and preparing to win should they go to court.  I am free from such concerns.

1st-Dark Blue: (DeGette).  Tradition seems to favor keeping the oddly shaped Denver county as whole as possible in this district, but I clipped the northern parts, and moved this district more to the south, eating up a portion of Arapahoe County and even getting into the northern-most parts of GOP stronghold Douglas county.  It certainly drops at least 10 points worth of Democratic performance, but this doesn’t come close to being competitive.  The bulk of the district is in precincts Obama was hitting 70% in.  There’s simply no reason to waste so many Democratic votes in CO-01.  Stats: 67% White, 6% Black, 21% Hispanic, 4% Asian (old: 52% W, 9% B, 33% H, 4% A).

2nd-Green: (Polis).  State Democrats were already looking to expand this Boulder-based district out to grab more physical area than it has now.  Instead of sending him out to Grand Junction, I had him go north to take Larimer County (home of Fort Collins) which Obama won by 10%.  This is still a very safe Democratic district, and by depriving CO-04 of it’s biggest current county, I am able to do other fun things.  Stats: 81% W, 1% B, 13% H, 3% A (old: 79% W, 1% B, 15% H, 3% A).

3rd-Light Blue: (no incumbent).  There’s Dem-leaning Pueblo, all by itself down there in the current CO-03, and the proposed Dem maps take GOP-stronghold Grand Junction out but put in a bunch of red counties currently in CO-04 and CO-05 that still makes it hard for us.  I simply chose to have it go for the ski counties instead, and turned this into a district I’m sure Obama won by a good margin.  Since the Dem maps already attempt to split El Paso county this time, I figured I might as well follow suit, and sent a finger up to grab a bunch of majority-minority precincts in southern Colorado Springs.  Even if that is not politically likely, just by removing all the ultra-red counties along the western border, and substituting them for central ski counties, we should be able to make a Democratic seat.  Stats: 69% W, 3% B, 24% H, 1% A (old: 75% W, 1% B, 22% H).

4th-Red: (Gardner and Tipton).  Now the fun begins.  By removing Fort Collins from CO-04, it must seek additional population, so I simply had it run around the perimeter of the state and go up through the conservative counties of the current CO-03, in effect combining both districts to make an ultra-GOP vote sink, based in Greeley and Grand Junction.  Yeah it looks bad, but hey the Republicans are always complaining that the rural counties don’t get a voice…here’s your dream district!  Stats: 75% W, 1% B, 20% H (old: 79% W, 1% B, 17% H).

5th-Yellow: (Lamborn and possibly Coffman).  An idea I borrowed from the legislature Democrats.  Why have two solid GOP districts along the I-25 when the districts can be narrowed and combined into an ultra-GOP vote sink?  Coffman doesn’t live in this district but unfortunately for him most of the current CO-06 is here, including his best performing areas in Douglas County.  He could try to run in the new Aurora-based 7th but he would get destroyed.  My guess is he would seek other office or retire.  He wouldn’t be the first guy to see his district evaporate.  Stats: 79% W, 3% B, 11% H, 3% A (old: 77% W, 6% B, 11% H, 2% A).

6th-Purple: (no incumbent).  Also basically copied from the proposed maps.  Changes from an exurban GOP stronghold south of Denver into an east suburban Aurora district.  Contains swingy areas in the south, but the northern half of this district contains some of the most heavily minority precincts in the state…Coffman has no chance in this district, no Republican does.  It skips across a few county lines, but it’s fairly compact compared to the oddly-shaped current CO-07 that contains a lot of this area right now.  Stats: 51% W, 12% B, 29% H, 5% A (old: 88% W, 2% B, 6% H, 3% A).

7th-Orange: (Perlmutter).  Drops most of the eastern Aurora-based earmuff and settles into a nice compact Jefferson County based district.  The location plays to Perlmutter’s strength in Jefferson but even if he leaves, the pieces in Denver and Adams county ensure it will stay blue.  Stats: 68% W, 1% B, 25% H, 3% A (old: 69% W, 6% B, 20% H, 3% A).

Louisiana Redistricting: New Pres Numbers by CD

With the Louisiana redistricting map one of the first to emerge intact from the sausage-making process, it’s time to crunch the numbers and see just what kind of districts we wound up with. (Notice that I’m not saying the map is a done deal… the Obama DOJ might still weigh in and shake things up, as they could conceivably push for a second African-American plurality district under the VRA.) Our resident data guru, jeffmd, has sliced and diced the shapefiles on the state House’s website, overlaid that onto the VTDs available from the Census Bureau, matched the VTDs to 2008 and 2010 election results available from the Louisiana SoS website, and voila:


District Obama # McCain # Obama % McCain % Fayard % Dardenne % Melancon % Vitter %
LA-01 81,515 233,789 25.34 72.68 25.30 74.70 24.89 69.79
LA-02 235,554 81,703 73.36 25.44 73.01 26.99 70.38 24.72
LA-03 111,831 210,951 34.06 64.25 39.36 60.64 31.40 62.55
LA-04 126,899 187,020 39.94 58.86 45.78 54.22 36.29 57.54
LA-05 124,119 209,705 36.69 61.98 40.04 59.96 32.98 60.31
LA-06 103,071 225,094 30.90 67.49 33.04 66.96 32.45 62.02

The full precinct-by-precinct dataset, courtesy of Google Docs, is available here.

If you aren’t familiar with the contours of the new map, you can take a look here. In a nutshell, the 1st remains the New Orleans suburbs, the 2nd remains New Orleans proper (although now it reaches into Baton Rouge’s African-American neighborhoods as well), the 4th is still centered on Shreveport, the 5th is still Monroe and Alexandria, and the 6th is still centered on Baton Rouge (even if its core is now missing). The big difference is the 3rd, which now mostly occupies what used to be the 7th, across Lake Charles and Lafayette; the old 3rd, in Cajun country south of New Orleans, has been parceled out to the 1st, new 3rd/former 7th, and also the 6th and 2nd.

As you can see, the redistricting result is very, very likely to result in a 5-1 map. The friendliest district for Dems, after the 2nd, is now the Shreveport-based 4th, but even it didn’t even see Barack Obama hit 40%. That’s not much different from the current setup (where he did hit 40%); the old 6th was the friendliest for Dems, but barely more so (with 41% for Obama).

Greg Giroux has some other interesting tidbits available on how the 3rd district (which is now poised to become a battleground between incumbent GOPers Charles Boustany and Jeff Landry) got neatly dismantled: Boustany represents 575K of the 3rd’s residents, while Landry represents only 180K of them, a nearly 3:1 advantage for Boustany. Of the old 3rd, 29% of it wound up in LA-01, 28% in new LA-03, 24% in LA-06, and 18% in LA-02. (The Daily Kingfish has picked up on this, and speculates that Landry might be better off challenging Steve Scalise in the 1st instead.)  

Where can you gain more Democrats in Central Illinois?

Photobucket

After tweaking this district all evening, I am stumped.  Are there any obvious batch of Democrats I am missing?  I want to save southern Montgomery and Macoupin Counties for bolstering the 12th.  I suppose I could always go into Fulton County, but then I would have to replace those Democrats with other voters for my new 17th.  Coles County with Mattoon and Charleston might be another possibility, but if you are going mainly by Kerry 2004 results (which I am – the 2008 Obama results are just too rosy everywhere in the state although not as bad in the central and southern part of the state as in the Chicago metro area), Kerry lost that county quite handily in 2004.  Either way you look at it, because both Springfield and Bloomington-Normal in a neutral year (like 2004) are lean-GOP cities, even with the powerhouses of Urbana-Champaign, Decatur, and the lean-Democratic cities of Peoria and Dansville, you still end up no better than 51.41% Kerry (at least at my valiant attempt at it).

Any thoughts of how I should try to bolster this district to 52-53% Kerry.  That is my goal for creating 3 downstate lean-Democratic seats.  I got Jerry Costello’s district up to 53-46 simply by axing out Williamson, Union, Pulaski, and Alexander and adding in the town of Edwardsville in Madison County and bits of southern Macoupin and Montgomeryt counties.  Likewise it is easy to make the 17th into a 53-47 Kerry district by going into Rockford.

This district for what it’s worth, voted 59-40 for Obama in 2008 but only 51-48 for Kerry 4 years prior.  I suspect the reason has largely to do with turnout issues among minorities and college students.  We won’t have those worries in 2012 but I worry about the remaining 4 election cycles.

I would still advocate drawing this map, even if it is not possible to go higher than 51-48.  Other than Dick Durbin (who represented Springfield and Decatur when he was in the House), these cities as far as I know have never been a) brought together; or b) represented by a Democrat.  Instead Illinois suffers from decades’ worth of GOP gerrymanders with the result that these cities are always split up.

Still, if Democrats get a bit skittish, I would not be entirely surprised if they sought to bolster the 17th a bit more as well as the 12th at the expense of a new district.

I welcome your thoughts.

Redistricting a 5-3 Democratic Wisconsin

This is my first foray into the redistricting game, so I decided to use my adoptive home state of Wisconsin. I tried to create the most Democratic map possible while maintaining reasonably compact districts and for the most part respecting communities of interest. The result was a map that should go 5-3 democratic in all but the very worst of years.


Madison / Milwaukee Close-Up:

Detailed analysis of the districts below the fold

1st (Blue, Ryan): Okay, so I know the smartass way to nuke Paul Ryan is to draw Janesville into Tammy’s district and give the new first district a huge chuck of Milwaukee proper so he can’t move, but I felt that that didn’t really respect communities of interest, so this is the next best option. What I did was get rid of Waukesha and the annoying parts of Racine, and gave him Whitewater, the rest of Rock County, Green, some of the less annoying (although still probably mildly Republican) parts of Jefferson, and southern Dane county. With a strong Dem candidate, this district should boot Paul Ryan, and continue electing that Democrat for the foreseeable future.

2nd (Green, Baldwin): To some extent, Tammy’s district got cannibalized to make some of the other districts more democratic. I had her eat half of Jefferson County, all of Dodge, Half of Fond du Lac County, and even gave her corners of Waukesha and Washington. I took some steps to avoid weakening her district too much, though. She still has all of Madison proper, over half of her votes are still in Dane, and I gave her Oshkosh in addition to some of the more heavily Republican stuff.

3rd (Purple, Kind): Ron Kind’s district is perhaps a smidgin more Republican, but if so, not by much, and he probably still would have beaten Kapanke last year in it. It drops Eau Claire and Dunn Counties, but picks up Columbia and a corner of Dane from Tammy and Adams and most of Marquette from Petri. All of that is light blue turf except for Marquette County, which doesn’t have a terribly huge population.

4th (Red, Duffy): Duffy will have an extremely hard time hanging on in this district. I left him with the already Democratic parts of his district (Sevens Point and the Superior stuff) while throwing in the heavily democratic Eau Claire and Dunn and hollowing out a lot of the reddish rural stuff that he had. Any competent democrat should be able to win this district.

5th (Yellow, Moore): Not much to see here. Milwaukee is a huge Democratic vote sink, but there’s not much I can do about that if I want to respect compactness and communities of interest.

6th (Teal, Sennsenbrenner): Basically, Sennsenbrenner’s district moves south a bit to eat up the parts of Ryan’s district I wanted to get rid of. Still solidly Republican.

7th (Grey, Petri): This was the most frustrating district for me. I struggled a lot with the decision to give Petri Appleton, but if I hadn’t, I would have had to give him a lot of Rural turf up north, which would have been a bit snake-like for the sort of map I was trying to draw. I also probably could have made this district a bit cleaner (and forced Petri to move) by giving Tammy Fond du Lac city and some more of Washington or Waukesha instead of Oshkosh, but I thought that might be pushing it. Despite the addition of Appleton, probably still pretty safely republican.

8th (Slate Blue, Ribble): Alas, while Ribble would be forced to move, getting rid of Appleton makes this district far more safe for Ribble, although a Democrat could probably still win in a really good year. Not much else to say here, besides that Ribble also ate a lot of Duffy’s reddish rural turf.

Colorado Redistricting: Maps from the “Kumbaya Committee”

Yesterday afternoon the 12 maps were released by the Joint Committee on Redistricting.  The committee has also been tagged as the “Kumbaya Committee” for it’s attempt to bring bipartisanshippyness to the most partisan issue possible.

Of the 12 maps, 6 were brought forward by the Democrats on the Committee and 6 from the Republicans.  All 6 Democratic maps followed a similar pattern of keeping whole cities intact as well as entire rural counties and were appropriately named “city integrity”.  The Republican maps all stayed close to the current map, probably realizing that’s the best deal they could get at this point.  

Several of the changes from both maps incorporated the wishes of different constituencies in the hearings the committee held all over the state.  The biggest wish “Keep us separate from Boulder.”  Other major wishes included putting Grand and Chaffee counties in the 3rd (or at least not in their current 2nd and 5th CDs) and keeping the city and county of Denver whole (which is a shame).  

I’ve only included 1 map from each side as the other 5 on both sides are similar to them and change only a county or city here and there.  

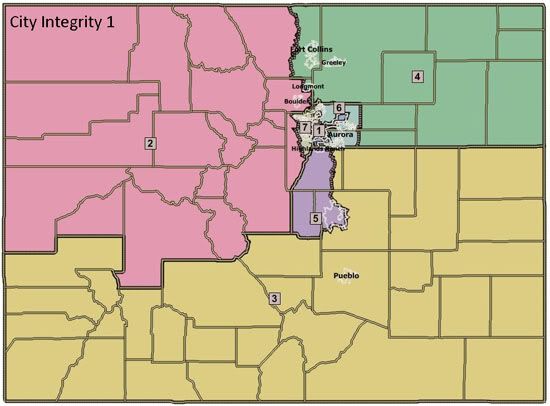
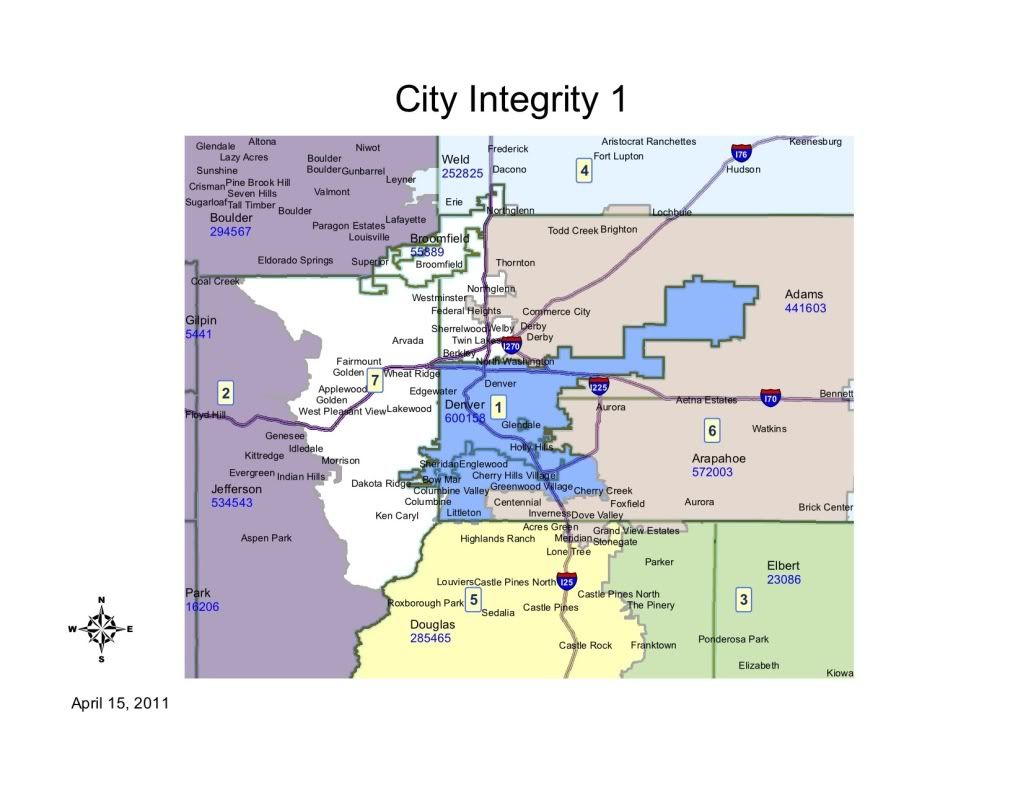
City Integrity 1

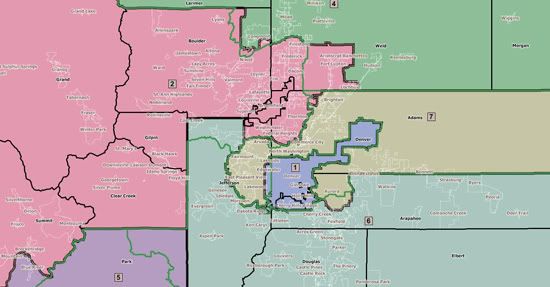
First, the Democrats map, known as “City Integrity 1.”  This is my personal favorite of all the Democratic maps and it’s also the “cleanest map” according to Sen. Rollie Heath (D-Boulder), co-chair of the committee.  All of the “City Integrity” maps strived to follow transportation corridors as well as striving for competitiveness.  The 1st, 2nd and 7th CDs are consistent throughout all the Democratic maps.

Photobucket

Photobucket

1st CD:  The 1st CD probably has the fewest changes.  It contains all of Denver County, Englewood, Cherry Hills Village, and Sheridan as before.  It adds Littleton, Greenwood Village, Bowmar, Cherry Creek Reservoir and some surrounding unincorporated areas of Arapahoe County.  The additions to the district are more Republican than the district as a whole, but the changes should be minimal, just making the district somewhat whiter than before.

2nd CD: The 2nd CD has some radical changes, going from it’s base in Boulder County (minus Longmont and Erie) west to take in all the north-west corner of the state.  The biggest new addition is Mesa County, one of the most Republican counties in the state and now the 2nd largest county in the district.  Chaffee, Lake and Park were taken from the 5th (as requested by the residents of Lake and Chaffee.  The district now includes all the major ski towns, Aspen, the oil and gas counties and the foothills towns in western Jefferson County.  If nothing else the district is now much more diverse in it’s interests and much more Republican.  The party break down is now 31 D, 31 R and 26 U, much more similar to the 7th CD when it was drawn a decade ago to be the most competitive.  We should be thankful Polis has more money than God and can probably hold this district in a non-2010 year.

3rd CD: The biggest disappointment of this map (especially to House Minority Leader Sal Pace of Pueblo) is the new 3rd CD.  It does a great job of keeping together the communities of interest in southern Colorado (despite what Republicans say, the south has more in common than the western slope and eastern plains as a whole).  It still contains all of Pueblo, but also adds Fremont, the rest of Otero, all the rural plains counties south of I-70 and the non-Colorado Springs portions of El Paso county, as well Parker and rural parts of Douglas county.  Overall this makes for a much more Republican district, probably out of reach for Democrats, but if you had to cut one loose, this was probably the district to do it with as several of the blue areas are shifting more and more R every year (San Luis Valley, Pueblo, Las Animas, Huerfano).  It still keeps Rep. Tipton’s home in Montrose so he can’t be too disappointed.

4th CD: The 4th CD needed to lose population and it did it with the most Republican parts of the district, now ending at Arapahoe/Washington/Yuma rather than taking in all the eastern plains down to the New Mexico Border.  It also loses the western half of Larimer County to the 2nd.  Most of the population lives in eastern Larimer so not much change other than shedding many republican precincts.  It then adds Erie and the eastern portions of Adams and Arapahoe counties, which are republican but not nearly as much as the counties given up.  These changes probably produce a district Obama and McCain were even in, if not a slight Obama win.  It becomes more winnable for Democrats, but still very competitive.  Sen. President Brandon Shaffer (D-Longmont) has to be pleased with this map as it keeps him in the district for a potential run.  Rep. Cory Gardner would not be happy at all with this district, but definitely still won it in it’s new configuration and the district keeps his home in Yuma.

5th CD:  Officially the southern I-25 corridor district, the 5th probably becomes even more Republican, adding most of Douglas, while shedding the swingier Chaffee and the blue Lake County.  Maintaining the home of Rep. Lamborn and also maintaing the districts center of gravity in Colorado Springs, the district will be to his liking (except for the absence of Fort Carson, which is now in the 3rd).  This is the beginning of the screwing-over of Rep. Coffman by taking out his best area in Douglas.  

6th CD:  The best change this map makes is the changing of the 6th from a suburban-Republican stronghold to a swingy eastern-suburban district.  While it keeps Coffman’s home in Aurora, he’s basically screwed in this district.  The extent to which this district takes in parts of Douglas and/or Weld changes between maps, but the heart of the district is the Arapahoe suburbs not in the 1st and most of the Adams Co. suburbs, including all the most hispanic areas.  Obama certainly won this district and in any normal year it would elect a solid Dem candidate.  This is probably the biggest reason this map will never be acceptable to the Republican House (while they have no love for Coffman I can’t see them being this willing to give up a safe seat).

7th CD: Another great change is in the 7th CD.  Keeping it’s base in Jefferson County, it sheds most of it’s Adams Co. areas and all of Aurora.  It then adds all of Arvada, Westminster, Northglenn and Broomfield (formerly in the 2nd).  It also takes in the Ken Caryl and unincorporated Jeffco (sometimes referred to as part of Littleton).  The district probably doesn’t change much in it’s tilt (maybe a very slight shift to the right), but it does remove the possibility of a Ryan Frasier challenge as he lives in Aurora.  This district makes more sense, while also maintaining it’s competitiveness.

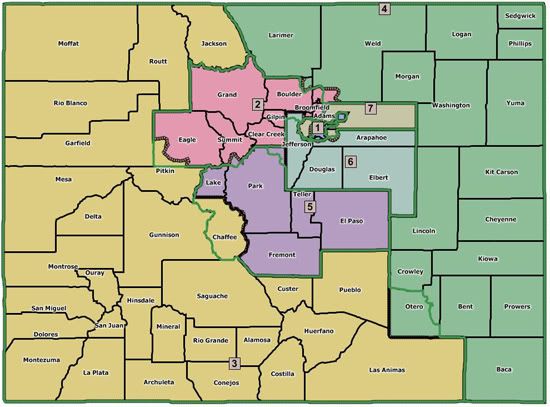
Balmer Map 1

The first Republican Map, known as “Balmer Map 1” for it’s author Rep. Balmer (R-Foxfield).  It is typical of all the Republican maps, keeping to the current boundaries as much as possible.  The biggest changes are the removal of Chaffee county from the 5th, the rest of Otero county in the 4th and more of Weld into the 2nd and southern Aurora into the 7th.  

The map below has helpful green lines where the current districts are so you can track the changes.

Photobucket

Photobucket

1st CD: Few changes here, but to add population the lines were moved from the county line between Denver to Jefferson (Sheridan Blvd.) to Wadsworth Blvd., all the precincts in between include parts Wheat Ridge and Lakewood and are probably some of the most Democratic precincts in Jefferson county.  The district remains as Democratic as before.

2nd CD: Biggest changes here were putting south-west Eagle County into the 3rd, a sliver of summit into the 5th to balance population there and the addition of Fort Lupton in Weld County.  The meter will be moved very little here either.  

3rd CD: The addition of Chaffee county is the biggest change along with the removal of the rest of Otero.  Little change here, but maybe a smidge in the Democratic direction.  

4th CD: Only the addition of the rest of Otero and the removal of Fort Lupton, doubtful to have much impact on the partisan make up.

5th CD: Removal of Chaffee county and the addition of the rest of Park and the Summit County Sliver, making it just a point or 2 more Republican.

6th CD: While appearing to have little change, the 6th actually has the most radical change in that it removed Rep. Coffman’s home in southern Aurora and puts it in the 7th!  Coffman has already reacted to the maps, lashing out at the Democratic maps for not including his home in his current district, when in fact they do…  But he plans to move to Greenwood Village, so he is actually angry at his future home being removed from the district and isn’t mad at the Republicans at all for screwing out of a district in their maps.  Gotta love that!

7th CD: Almost no change, except now being the home to Rep. Coffman!  

Likely result

Unless the “Kumbaya Committee” suddenly has a desire to actually work together, looks like neither of these maps or any of the other 10 maps will make it.  The rural Republicans are already screaming about the dividing of the eastern plains and western slope, which they consider to be “communities of interest.”  So we’re more likely than not to have the issue before the courts.  Lucky for Dems the Colorado Supreme Court is packed with Democratic-appointed Justices and in 2000 they chose the current map, which was proposed by Democrats.  

Louisiana with 2 “VRA” districts?

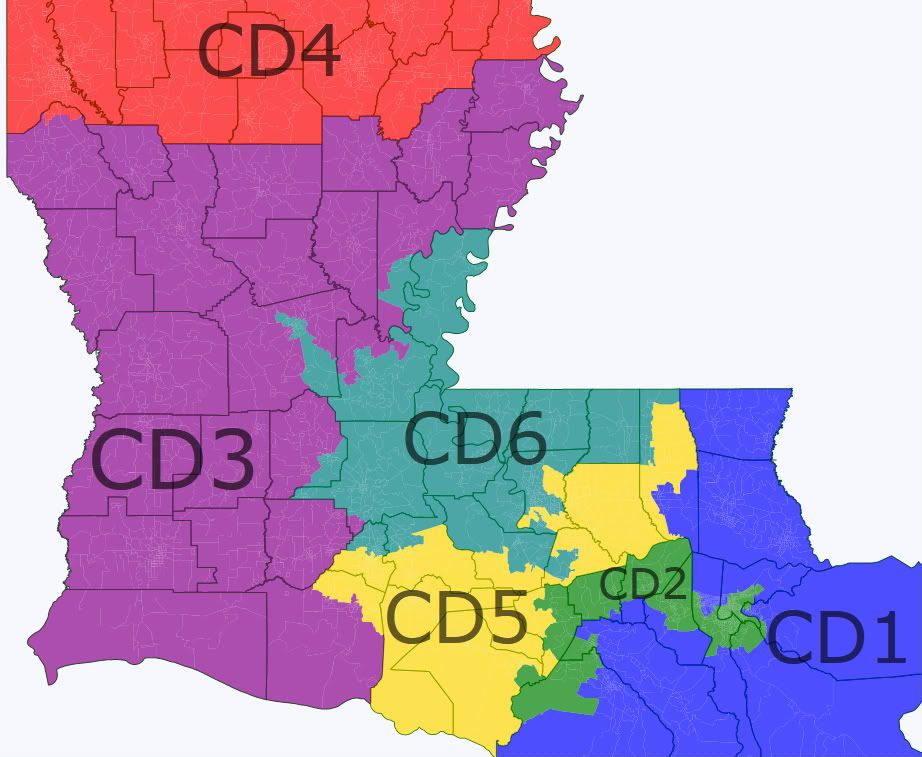
A few days ago in the discussion of the proposed Louisiana map someone drew a map with two majority-black districts but nothing else filled in. I drew this map to see (a) if I could get the New Orleans district to be more compact and (b) what the other districts would look like. As it turns out, the answer to (a) is yes, but it’s plurality black as opposed to majority black, and the answer to (b) is ugly.

Here’s the map.

louisiana

In district descriptions, the percentages are for voting age population. w is non-Hispanic white, b is black, h is Hispanic, and a is Asian.

LA1 (blue): 77.6w-12.3b-6.0h-1.7a. Still mostly a suburban New Orleans seat, but it was forced to move into the Thibodaux-Houma area by the positions of the VRA districts. Safe R.

LA2 (green): 41.7w-46.5b-7.3h-3.0a. Because of the depopulation of New Orleans, this district has to extend west and then south to pick up some heavily black areas. Probably likely D to safe D, as it’s still 58% minority and its white population is probably relatively moderate compared to the rest of the state. While less compact than a typical district, it’s far more compact than either its current or proposed versions.

LA3 (purple): 74.0w-20.7b-2.4h-0.9a. Ugh. It’s geographically impossible for it to take all of Cajun country, so it has to extend much further north. It wasn’t possible for it to take everything along the west side of the state up to and including Shreveport so I had to take it practically to the northeast corner of the state to avoid splitting up the Shreveport area. The result is a sprawling, incoherent mess that takes up maybe 40% of the state’s land area. Safe R.

LA4 (red): 59.8w-35.6b-2.4h-1.0a. The one clean district, the I-20 district. Likely R.

LA5 (yellow): 79.6w-13.9b-3.5h-1.7a. This ugly district with nodes in Baton Rouge and Cajun country connected by a narrow strip was necessary because the two VRA districts pass so close to each other. Safe R.

LA6 (teal): 44.6w-50.2b-2.6h-1.3a. The Baton Rouge-based majority-black district is nice and compact, but it has some community-of-interest issues as it takes pieces of Lafayette, Ville Platte, and Alexandria in addition to part of the capital city. Probably close to safe D even though it’s likely only D+6 or so: it looks like it would be easy for a Republican to get to 40% but nearly impossible to get over the hump. Compare it to Sanford Bishop’s current district, which is probably about as polarized as this LA6 would be but has black-white percentages that are basically the reverse of what this district has. It’s D+1.

I’m pretty sure that a court would accept this proposed LA6 if the state submitted it, as courts have accepted some really ugly and incoherent districts.  But here’s the question: would a court compel a state to draw something like the proposed LA6–which looks ok but slices and dices some widely separated cities–if the state isn’t inclined to draw it in the first place? Perhaps someone with a better understanding of the VRA can weigh in on this. Thoughts?

By what margin will Bob Shamansky win?

View Results

Loading ... Loading ...