Puerto Rico: What its six districts would look like if it were a state

I like to think of interesting topics for diaries and this is one that came to me. If Puerto Rico was a state it would have six seats. I looked at the census data, did a spreadsheet and filled in my map based on my calculations. I took a few guesses on splitting municipalities, so the deviations aren’t exact at all. It would be nice if this was made available on the Redistricting App if possible (obvious hint to Dave), so everyone could work with this just for hypotheticals.

Photobucket

Now, since Puerto Rico has no presidential vote, it’s hard to say how any of these districts would vote or how they’d lean. Since Puerto Rico has it’s own parties, I assume elections would be decided on issues relating to those parties and it doesn’t seem to heavily lean toward either of the main ones there. Many in the PPD align with Democrats, while the PNP has a mix of those who align with the US parties, with those leaning toward Republicans having the edge.

PR-1:

Mayaguez anchors this district. Looking at previous election results, the PPD  seems to do very well in and around Mayaguez, so it would probably lean PPD/Dem.

PR-2:

Ponce is the population center and leans PPD, but it also includes many of lower population density areas, which seem to lean PNP. I would guess it would be a toss-up.

PR-3:

Toa Alta and Toa Baja make up the biggest share of population here, both of which have PNP mayors and seem to vote PNP in most gubernatorial elections, which indicates a PNP lean for this district.

PR-4:

Bayamon is largest municipality and has a pronounced PNP lean, but PPD leaning Cauguas makes a up a good share of the district as well, which adds balance. It might be a toss-up or slight PNP lean.

PR-5:

The capital of San Juan anchors the district smallest in size. San Juan swings between both parties, with a slight edge to PPD. PPD leaning Carolina is also a portion of this district, which should equal a PPD edge overall for this district.

PR-6:

Has a portion of PPD leaning Carolina, but all the rest, save for Humacao, leans PNP. It doesn’t appear that there is a huge edge toward either side, so I’d all it a toss-up.

Overall, none of this analysis counts for much, as we have no idea how Puerto Rico would swing on a federal level. The island is socially conservative, but economically liberal in many aspects and that could be what determined a lot of voting patterns.

2010 California Gubernatorial: City by City results for Los Angeles County and suburbs

My analysis after the numbers

https://spreadsheets.google.co…

  Brown Whitman Total Votes D% R%
Agoura Hills 4037 4295 8332 48.45% 51.55%
Alhambra 11075 5267 16342 67.77% 32.23%
Arcadia 6012 8070 14082 42.69% 57.31%
Artesia 1618 1160 2778 58.24% 41.76%
Avalon 456 447 903 50.50% 49.50%
Azusa 5505 2914 8419 65.39% 34.61%
Baldwin Park 8403 2235 10638 78.99% 21.01%
Bell 3732 727 4459 83.70% 16.30%
Bell Gardens 3647 652 4299 84.83% 15.17%
Bellflower 8462 4924 13386 63.22% 36.78%
Beverly Hills 7156 5579 12735 56.19% 43.81%
Bradbury 117 247 364 32.14% 67.86%
Burbank 17818 12079 29897 59.60% 40.40%
Calabasas 4194 3988 8182 51.26% 48.74%
Carson 19010 5060 24070 78.98% 21.02%
Cerritos 8087 7109 15196 53.22% 46.78%
Claremont 8254 5426 13680 60.34% 39.66%
Commerce 2126 437 2563 82.95% 17.05%
Compton 14783 759 15542 95.12% 4.88%
Covina 6364 5409 11773 54.06% 45.94%
Cudahy 1932 337 2269 85.15% 14.85%
Culver City 11810 3759 15569 75.86% 24.14%
Diamond Bar 7271 7449 14720 49.40% 50.60%
Downey 14314 9269 23583 60.70% 39.30%
Duarte 3576 2125 5701 62.73% 37.27%
El Monte 9385 3175 12560 74.72% 25.28%
El Segundo 2925 3489 6414 45.60% 54.40%
Gardena 9995 2936 12931 77.29% 22.71%
Glendale 24362 16771 41133 59.23% 40.77%
Glendora 6582 10251 16833 39.10% 60.90%
Hawaiian Gardens 1186 393 1579 75.11% 24.89%
Hawthorne 11037 3260 14297 77.20% 22.80%
Hermosa Beach 3948 3907 7855 50.26% 49.74%
Hidden Hills 336 562 898 37.42% 62.58%
Huntington Park 5561 896 6457 86.12% 13.88%
Industry 19 31 50 38.00% 62.00%
Inglewood 22667 1810 24477 92.61% 7.39%
Irwindale 306 93 399 76.69% 23.31%
La Canada Flintridge 3744 5569 9313 40.20% 59.80%
La Habra Heights 739 1645 2384 31.00% 69.00%
La Mirada 6275 7474 13749 45.64% 54.36%
La Puente 4798 1290 6088 78.81% 21.19%
La Verne 4954 6523 11477 43.16% 56.84%
Lakewood 12636 11322 23958 52.74% 47.26%
Lancaster 14276 15632 29908 47.73% 52.27%
Lawndale 3610 1545 5155 70.03% 29.97%
Lomita 2836 2691 5527 51.31% 48.69%
Long Beach 68343 36700 105043 65.06% 34.94%
Los Angeles 590793 213305 804098 73.47% 26.53%
Lynwood 7739 1055 8794 88.00% 12.00%
Malibu 2919 2528 5447 53.59% 46.41%
Manhattan Beach 7162 8587 15749 45.48% 54.52%
Maywood 2723 391 3114 87.44% 12.56%
Monrovia 5984 5037 11021 54.30% 45.70%
Montebello 9631 2983 12614 76.35% 23.65%
Monterey Park 7632 4138 11770 64.84% 35.16%
Norwalk 13042 5862 18904 68.99% 31.01%
Palmdale 15179 12707 27886 54.43% 45.57%
Palos Verdes Estates 2329 4535 6864 33.93% 66.07%
Paramount 5627 1315 6942 81.06% 18.94%
Pasadena 28307 13897 42204 67.07% 32.93%
Pico Rivera 10777 2806 13583 79.34% 20.66%
Pomona 15825 6406 22231 71.18% 28.82%
Rancho Palos Verdes 7322 10508 17830 41.07% 58.93%
Redondo Beach 12730 11692 24422 52.13% 47.87%
Rolling Hills 238 784 1022 23.29% 76.71%
Rolling Hills Estates 1334 2432 3766 35.42% 64.58%
Rosemead 5144 2157 7301 70.46% 29.54%
San Dimas 4852 6357 11209 43.29% 56.71%
San Fernando 2855 828 3683 77.52% 22.48%
San Gabriel 4263 2852 7115 59.92% 40.08%
San Marino 1817 3266 5083 35.75% 64.25%
Santa Clarita 21113 31224 52337 40.34% 59.66%
Santa Fe Springs 2739 1203 3942 69.48% 30.52%
Santa Monica 26817 9164 35981 74.53% 25.47%
Sierra Madre 2759 2559 5318 51.88% 48.12%
Signal Hill 1871 1007 2878 65.01% 34.99%
South El Monte 2070 492 2562 80.80% 19.20%
South Gate 11093 2502 13595 81.60% 18.40%
South Pasadena 6456 3353 9809 65.82% 34.18%
Temple City 4318 3923 8241 52.40% 47.60%
Torrance 20974 23561 44535 47.10% 52.90%
Vernon 10 14 24 41.67% 58.33%
Walnut 4223 4021 8244 51.23% 48.77%
West Covina 14056 8930 22986 61.15% 38.85%
West Hollywood 11026 2457 13483 81.78% 18.22%
Westlake Village 1628 2308 3936 41.36% 58.64%
Whittier 12770 10409 23179 55.09% 44.91%
Unincorporated area of Los Angeles County 144758 78196 222954 64.93% 35.07%
           
Aliso Viejo 5363 8067 13430 39.93% 60.07%
Anaheim 29395 34529 63924 45.98% 54.02%
Brea 4546 8698 13244 34.32% 65.68%
Buena Park 8044 8476 16520 48.69% 51.31%
Costa Mesa 11389 15715 27104 42.02% 57.98%
Cypress 6129 8836 14965 40.96% 59.04%
Dana Point 4808 8555 13363 35.98% 64.02%
Fountain Valley 6960 12816 19776 35.19% 64.81%
Fullerton 14349 20155 34504 41.59% 58.41%
Garden Grove 16601 19682 36283 45.75% 54.25%
Huntington Beach 24769 43552 68321 36.25% 63.75%
Irvine 25659 30915 56574 45.35% 54.65%
La Habra 5750 7176 12926 44.48% 55.52%
La Palma 2109 2672 4781 44.11% 55.89%
Laguna Beach 5707 5259 10966 52.04% 47.96%
Laguna Hills 3703 6975 10678 34.68% 65.32%
Laguna Niguel 8450 16007 24457 34.55% 65.45%
Laguna Woods 4849 5096 9945 48.76% 51.24%
Lake Forest 8048 15745 23793 33.83% 66.17%
Los Alamitos 1607 2077 3684 43.62% 56.38%
Mission Viejo 11727 23818 35545 32.99% 67.01%
Newport Beach 10546 26983 37529 28.10% 71.90%
Orange 13839 24103 37942 36.47% 63.53%
Placentia 5344 9681 15025 35.57% 64.43%
Rancho Santa Margarita 4701 10550 15251 30.82% 69.18%
San Clemente 7829 16243 24072 32.52% 67.48%
San Juan Capistrano 3838 7681 11519 33.32% 66.68%
Santa Ana 27616 15471 43087 64.09% 35.91%
Seal Beach 5018 6999 12017 41.76% 58.24%
Stanton 3052 2837 5889 51.83% 48.17%
Tustin 6838 9770 16608 41.17% 58.83%
Villa Park 658 2552 3210 20.50% 79.50%
Westminster 9356 12705 22061 42.41% 57.59%
Yorba Linda 6889 19832 26721 25.78% 74.22%
Unincorporated area of Orange County 13177 29650 42827 30.77% 69.23%
           
Banning 3498 4219 7717 45.33% 54.67%
Beaumont 3413 4484 7897 43.22% 56.78%
Blythe 1739 881 2620 66.37% 33.63%
Calimesa 919 1635 2554 35.98% 64.02%
Canyon Lake 1000 2829 3829 26.12% 73.88%
Cathedral City 5475 4102 9577 57.17% 42.83%
Coachella 2806 530 3336 84.11% 15.89%
Corona 13285 17573 30858 43.05% 56.95%
Desert Hot Springs 2044 1657 3701 55.23% 44.77%
Eastvale 4222 4012 8234 51.28% 48.72%
Hemet 7235 10213 17448 41.47% 58.53%
Indian Wells 567 1764 2331 24.32% 75.68%
Indio 6854 6578 13432 51.03% 48.97%
La Quinta 4119 7699 11818 34.85% 65.15%
Lake Elsinore 3619 4314 7933 45.62% 54.38%
Menifee 7538 12231 19769 38.13% 61.87%
Moreno Valley 19145 11567 30712 62.34% 37.66%
Murrieta 8544 16493 25037 34.13% 65.87%
Norco 2100 4499 6599 31.82% 68.18%
Palm Desert 6043 9839 15882 38.05% 61.95%
Palm Springs 9848 5518 15366 64.09% 39.33%
Perris 4755 1911 6666 71.33% 28.67%
Rancho Mirage 2870 4269 7139 40.20% 59.80%
Riverside 31925 28034 59959 53.24% 46.76%
San Jacinto 3323 3493 6816 48.75% 51.25%
Temecula 7956 16088 24044 33.09% 66.91%
Wildomar 2601 4757 7358 35.35% 64.65%
Unincorporated area of Riverside County 38955 53470 92425 42.15% 57.85%
           
Adelanto 1739 1078 2817 61.73% 38.27%
Apple Valley 6237 12279 18516 33.68% 66.32%
Barstow 1880 1785 3665 51.30% 48.70%
Big Bear Lake 582 1356 1938 30.03% 69.97%
Chino 7556 8122 15678 48.19% 51.81%
Chino Hills 8771 12020 20791 42.19% 57.81%
Colton 5551 2454 8005 69.34% 30.66%
Fontana 18868 9922 28790 65.54% 34.46%
Grand Terrace 1664 1867 3531 47.13% 52.87%
Hesperia 6253 9419 15672 39.90% 60.10%
Highland 5746 5191 10937 52.54% 47.46%
Loma Linda 2119 2549 4668 45.39% 54.61%
Montclair 3549 1943 5492 64.62% 35.38%
Needles 536 489 1025 52.29% 47.71%
Ontario 15031 10177 25208 59.63% 40.37%
Rancho Cucamonga 19542 23661 43203 45.23% 54.77%
Redlands 9762 11635 21397 45.62% 54.38%
Rialto 10473 4035 14508 72.19% 27.81%
San Bernardino 19302 10638 29940 64.47% 35.53%
Twenty-nine Palms 1052 1604 2656 39.61% 60.39%
Upland 9207 11708 20915 44.02% 55.98%
Victorville 8747 8106 16853 51.90% 48.10%
Yucaipa 5284 9144 14428 36.62% 63.38%
Yucca Valley 2002 3504 5506 36.36% 63.64%
Unincorporated area of San Bernardino County 26125 37531 63656 41.04% 58.96%


I’ve opted to break down some of the larger counties and the ones that I know a lot about. Results by city are very telling. I’ve compared results just by the two way vote between Brown and Whitman, just to get a clearer look at how the both main parties match up head to head in each municipality. I got the numbers from the Secretary of State’s site, but I worked out the percentages myself with the help of Calc (please point any errors if you notice any).

Los Angeles County

As you can see, most of the usual pockets of Republican strength went to Whitman, with wealthier municipalities giving her the highest margins. The Senate results were almost identical, with only Lomita voting Democratic for Governor and Republican for Senate. The income polarization is very noticeable, the highest income place won by Brown was Beverly Hills. Malibu was probably the second highest income area Brown won, while Calabasas would likely rank behind it.

Orange County

Clearly, no surprise that most municipalities voted Republican and by sizable numbers. Laguna Beach, Santa Ana and Stanton voted for Brown. The lighter Republican voting areas aren’t that surprising, save for Laguna Woods, which is an exclusive retirement community. Again, income counts for a lot, since most of the municipalities won by Whitman are very high income and exclusive. Minority population growth has cause Republican numbers to erode, but it still is decisively Republican.

Riverside County

Whitman won the county overall, but well below the margins Republicans used to post here. Minority population growth has really boosted Democratic fortunes in Riverside County. Riverside proper and Moreno Valley have seen the biggest increase in minority population. Once again, the higher income communities are the darkest red, with exclusive Canyon Lake being the most heavily GOP voting.

San Bernardino County

Voted along the lines of Riverside County, but had a couple of split decisions. Barstow and Needles voted Democratic for Governor and Republican for Senate. I would imagine that Brown’s crossover appeal from his previous service helped him here a bit. Just like Riverside County, Whitman’s performance was well below what most Republicans in other states get in suburbs in good GOP years. Democrats have a solid foundation in Fontana, Ontario, Rialto and San Bernardino proper, which have grown a lot over time, with most of that growth being minorities who have left Los Angeles seeking better housing and work.

Arkansas Redistricting: A Compromise and a gerrymander

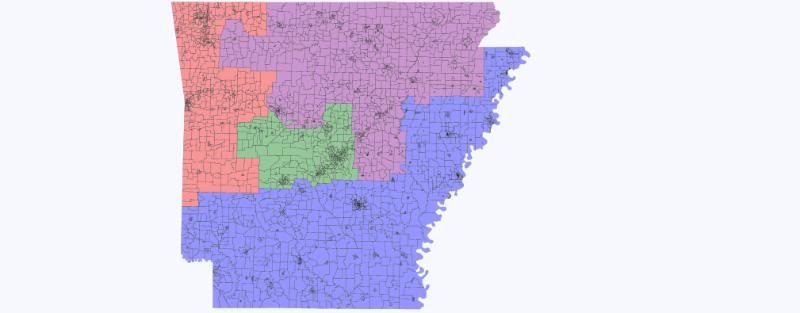
Arkansas is one of the few states where Democrats have complete control of the process. It’s not clear exactly what Democrats there have in mind, but there is some indication that they do want to create that they want to keep Mike Ross safe and not make AR-2 too comfortable for Tim Griffin. It also looks as if the no county splitting tradition is out the window this time around.

Photobucket

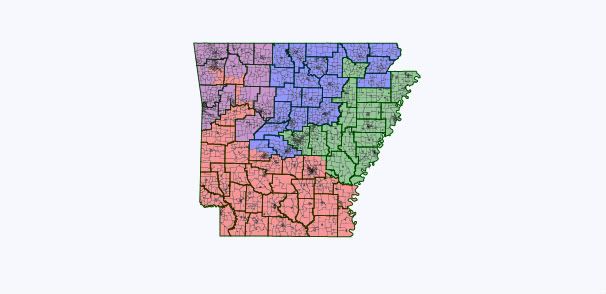
This first map is very rough cut of a compromise map. Crawford gets safer by shedding numerous Delta counties to Ross. Griffin doesn’t change much either way and Shane Broadway or Bill Halter would be a formidable challenger to him. Steve Womack stays exactly the same.

The set up I have created here would satisfy local concerns well. One possible move would be to put Fort Smith in the 4th district, but seeing as Fort Smith doesn’t have a whole lot in common with much of what else is in the 4th and some Fort Smith business interest have objected to such a move. Plus, Mike Ross would probably feel more secure not taking it on, so this set up is satisfactory as a compromise on those fronts.

Are far as demographics, AR-2 is a few points more African-American than before and AR-4 jumps from 16% to 30%, with voting age population close to that number.

_____________________________________________

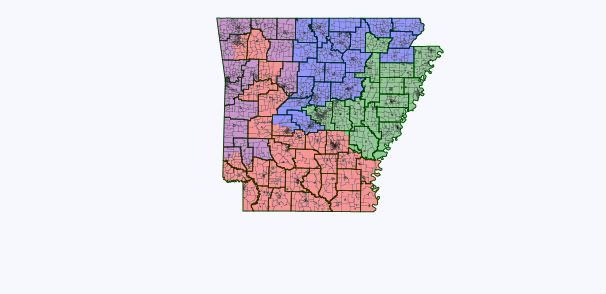
Now, things may not turn out so smoothly. State Senator Sue Madison, D-Fayetteville, as indicated that Fayetteville may be plucked out of AR-3 and put in AR-4. This wouldn’t look too clean, but it would be a 2-2 map, as I assume Democrats may also go after Tim Griffin and Fayetteville would give Mike Ross better security by giving him a second Dem anchor outside of Pine Bluff.

Photobucket

This would be another more version that would divide counties less, but have the same effect.

Photobucket

I’ve also read some information about a push for a majority-black district by some in the Legislative Black Caucus and of course, Republicans. It’s would take some very creative drawing to get a district like this and the shape would very likely cause it to end it getting thrown out in court.

Redistricting Indiana (two maps)

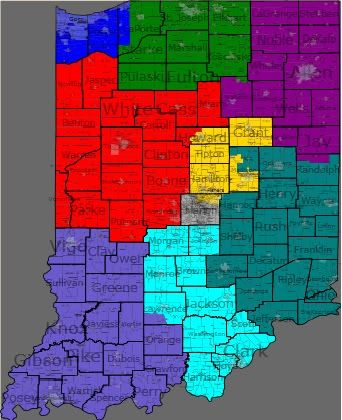
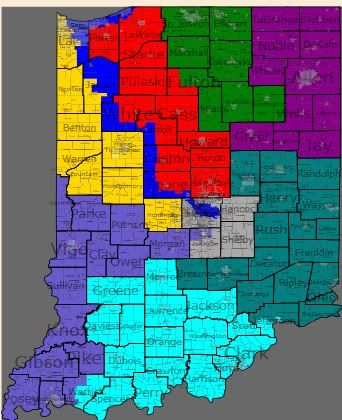
I tried my hand at redistricting Indiana, since it’s census data was out. I have two maps I created, one is a fair map (at least what the Republican legislature would call fair) and the other is a gerrymander. It’s been said the Gov. Daniels doesn’t want to go too crazy with the map, so we can’t be too sure exactly how aggressive the GOP will get.

Photobucket

IN-2 is modified enough where a Republican can win it and it didn’t take much to achieve that. Joe Donnelly would have probably lost this district in 2010. IN-5 changes a bit and gets more compact, but it’s still solid Republican. IN-9 should be safer GOP by taking on Lawrence and Morgan Counties, while all other districts stay close to the same. Now, onto the gerrymander.

Photobucket

I mistakenly reversed the colors for the 4th and 5th districts, so I thought I’d point that out first. What I have done here is throw Visclosky and Carson together into a vote sink that sucks up the most strongly Democratic voting areas. To make this possible, I had to give Hammond to Rokita, but it wouldn’t pose much of a problem for him, as there is plenty of strong Republican territory still attached. Burton picks up portions of LaPorte and Porter Counties, but still remains safe. IN-7 should have a Republican PVI now, as it takes in out portions of the county and some surrounding counties. IN-6 had minimal changes, while IN-8 and IN-9 are slightly better for Republicans.

I have doubts the GOP will become so aggressive as far as IN-1 goes, but I would not be surprised if something like this were at least attempted by the legislature. I like coming up with egregious gerrymanders, so it was drawn mostly for fun, but it should be kept in mind.

Idawyoming: Idaho with three districts

I wanted to get in on the Wyoming fun, so I decided the state I’d do would be Idaho.

Photobucket

ID-1: More Republican without Ada County, which has trended less Republican over the past few cycles. The counties in the panhandle lean Dem in strong Democratic years.

ID-2: Covers Southern Idaho.

ID-3: Covers all of Ada County and portions of Canyon. Looking at the district, I would estimate it to be about R+8.

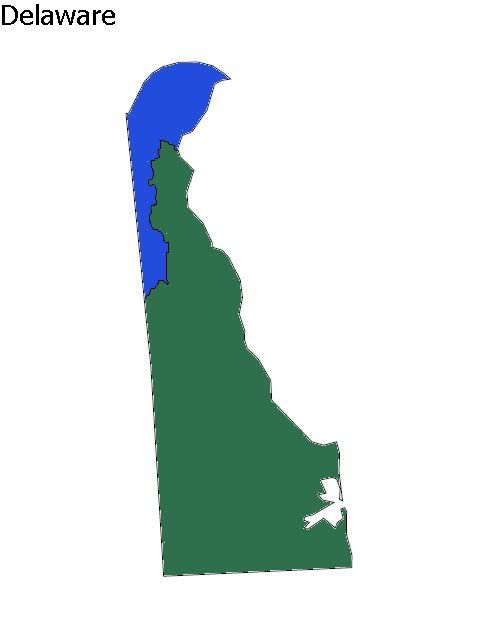
Bonus: Delaware with two districts

Photobucket

DE-1: Covers most of New Castle County and would be D+16. To make it, I looked at a map of New Castle County Council districts and figured out where to divide the county properly.

DE-2: Covers part of New Castle County and all of Kent and Sussex Counties. The PVI would be around D+1 based on 2008, but it probably would be more like R+2 in regular years. It might elect Christine O’Donnell, as both Kent and Sussex voted for her in the Senate race.

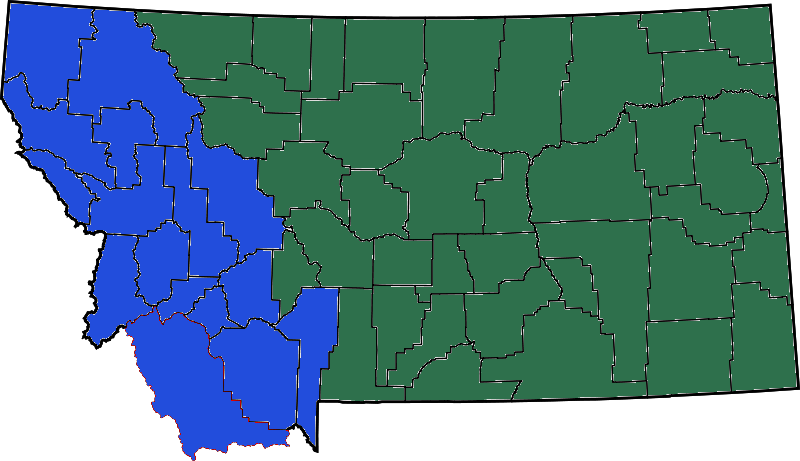
Second Bonus: Montana with two districts.

Photobucket

MT-1: This district would be about R+3 and would certainly be open to electing a Democrat, as it includes most of the places where Democrats perform well.

MT-2: Didn’t do much math on this one, but it would have a Republican PVI.

Redistricting California (revised)

My second attempt at redistricting California. I scrapped my first attempt, because it didn’t look quite like something the commission would do in most places, after reading some comments and taking a second look, I saw many flaws. Now this map isn’t perfect and I’m not as good at this as some other members, but I did my best and it looks a lot better than the last one. It’s probably 75% close to what we might see from the commission.

Revision: I modified some of the Central Valley and Bay Area Districts.

Goals:

Avoid county and city splitting where possible.

Attempt to follow communities of interest.

Keep lines looking as clean as possible.

Possible Incumbent face offs:

Garamendi vs. Lungren

Honda vs. Stark

Cardoza vs. Denham

Gallegly vs. Sherman

Napolitano vs. Sanchez

Davis vs. Bilbray (rematch)

Uploaded with ImageShack.us

CA-1: (Blue)

OPEN

Obama 50%, McCain 47%.

This district includes much of the old CA-1 and CA-2. It compacts this part of the state, which was previous very gerrymandered. It’s the definition of a swing district, with a PVI of R+1. I have no idea who would run here on the Democratic side, but there are several Republican legislators who have been termed out who could make of a go of it.

CA-2: (Green)

Mike Thompson

Obama 65%, McCain 33%

Mike Thompson’s district gets a whole lot smaller, as it shrinks down to include just Napa, Solano and a portion of Yolo County.

CA-3: (Purple)

Wally Herger

McCain 51%, Obama 46%

Herger’s hometown of Chico is still here, as well as some previously represented territory, but it’s more squared off to look compact. I couldn’t get the population just right on this one, but I estimate that new population numbers would probably allow for this district to balance out.

CA-4: (Red)

Tom McClintock

McCain 55%, Obama 43%

McClintock loses some counties in the north and picks up some other counties to further south. Inyo, Alpine and Mono are always hard to place because of their position, I can’t be sure where the commission would place them, but this wouldn’t be an unreasonable place. Population was a little off here too, but it would likely balance out with new census numbers.

Uploaded with ImageShack.us

CA-5: (Gold)

Doris Matsui

Obama 69%, McCain 29%

Not much to say here, it’s practically the same as it was before.

CA-6: (Teal)

Lynn Woolsey

Obama 76%, McCain 22%

Another one that I can’t say much about, as it’s almost exactly the same.

CA-7: (Gray)

George Miller

Obama 71%, McCain 27%

Strictly a Contra Costa County district. Much more compact than the previous incarnation.

CA-8: (Violet)

Nancy Pelosi

Obama 85%, McCain 13%

Takes in more of San Francisco.

CA-9: (Electric Blue)

Barbara Lee

Obama 88%, McCain 10%

Not much change, just picks up some territory from the old CA-13.

CA-10: (Hot Pink)

John Garamendi, Dan Lungren

Obama 50%, McCain 48%

Garamendi and Lungren are thrown together here for a compact, Sacramento County district. Garamendi is a strong candidate and he has the potential to defeat Lungren, who would be at somewhat of a disadvantage without Amador and Calaveras Counties, which are now in CA-4.

CA-11: (Electric Green)

Jerry McNerney

Obama 66%, McCain 32%

This district includes most of it’s old territory in Alameda and Contra Costa Counties, as well as picking up Hayward and some other places. The Commission might opt for a different formation, but if they want to make the Bay Area look as clean as possible, this is the best route for CA-11.

CA-12: (Medium Pastel Blue)

Jackie Speier

Obama 74%, McCain 25%

A bit of San Francisco and almost all of San Mateo County,

CA-13: (Salmon)

OPEN

Obama 60%, McCain 38%

Stockton gets it’s own district. It also includes a portion of Contra Costa Counties, leftovers from what I had from making the other districts. Not sure who would run here, but my revised version is now D+7. Still could be a swing district.

CA-14: (Camouflage)

Anna Eshoo

Obama 73%, McCain 25%

Drops parts of Santa Cruz and San Mateo Counties to become a compact Silicon Valley district.

CA-15: (Orange)

Mike Honda, Pete Stark

Obama 71%, McCain 27%

Two more incumbents drawn together, this time it’s two Democrats. There just wasn’t enough growth around here to sustain every district in a compact way. Stark may opt to retire.

CA-16: (Bright Green)

Zoe Lofgren

Obama 67%, McCain 31%

Lots of San Jose, along with Gilroy and Morgan Hill.

CA-17: (Dark Purple)

Sam Farr

Obama 72%, McCain 25%

All of Santa Cruz and Monterey Counties are unified here, with a portion of Santa Clara.

CA-18: (Yellow)

Dennis Cardoza, Jeff Denham

52% McCain, 47% Obama

Yet another pair of incumbents thrown together. This would be a hard climb for Cardoza, so he might opt to run in another district, like the new CA-13 or CA-19, which I’m discussing next.

CA-19: (Lime)

OPEN

50% Obama, 48% McCain

Now cut down to do just Stanislaus and a portion of San Joaquin. Very much a swing district, but Dennis Cardoza could win it if he moved here.

CA-20: (Pink)

Jim Costa

54% Obama, 44% McCain

Fresno County won’t fit in one district, so I had to figure out how to split it in sensible way. This takes in all of the city of Fresno itself, along with some outlying areas.I also took into account Hispanic voters, with all the other Central Valley districts being majority or plurality white, I think there would have to be  one Hispanic majority or at least plurality district in the Central Valley. The commission will be traveling and getting input, that might be one of the concerns raised by Hispanics in the Central Valley

CA-21: (Dark Red)

Devin Nunes

59% McCain, 39% Obama.

Nunes keeps all of Tulare, but picks up Kings and some of Kern in place of portions of Fresno.

CA-22: (Brown)

Kevin McCarthy

56% McCain, 42% Obama

Finally, a district completely within Kern County.

Uploaded with ImageShack.us

CA-23: (Aqua)

Lois Capps

57% Obama, 41% McCain

Almost identical to a previous incarnation of the district, which was a swing district. It’s D+4 and that’s close to swing territory, but Santa Barbara proper has trended very Democratic over the past couple of cycles and the PVI might rise a little more over time.

CA-24: (Deep Purple)

OPEN

58% Obama, 41% McCain

This one has the potential to be a swing district, but Democratic leaning Oxnard might prevent that. State Senator Fran Pavley of Agoura Hills could win this district handily. I do know of one Republican who could win it and that would be Ventura County Supervisor Linda Parks of Thousand Oaks, who is very moderate (I voted for her). A Pavley vs. Parks battle would be epic. State Senator Tony Strickland or his wife,  soon to be former Assemblymember Audra Strickland might make a run for it, but they probably are too conservative for the district.

Uploaded with ImageShack.us

CA-25: (Magenta)

Buck McKeon

McCain 49%, Obama 48%

This PVI drops from R+6, to just R+3. Lots of minorities have moved into the Antelope Valley and High Desert, setting it on a track to turn blue. McKeon would be fine here, but when he retires, it would  be a potential Democratic target.

CA-26: (Dark Gray)

David Dreier

Obama 60%, McCain 38%

This goes from R+3 to D+7 just by making it more compact, which proves of crazily gerrymandered the other incarnation was. David Dreier would probably attempt to run here, but a good Democrat would defeat him hands down. Gary Miller also lives here, but it doesn’t include any of his other territory.

CA-27: (Fluorescent Green)

Brad Sherman

Obama 58%, McCain 40%

A lot of this was just leftovers from other districts. Sherman keeps most of his territory in the valley and picks up parts of Ventura County that wouldn’t fit in CA-24. Some of these areas have been paired up in the past. Elton Gallegy was about to retire some years ago, he might actually do that as opposed to running in this district.

CA-28: (Light Purple)

Howard Berman

Obama 72%, McCain 26%

Not too different than Berman’s current district, just a little more compact.

CA-29: (Dollar Bill)

Adam Schiff

Obama 64%, McCain 34%

A little less Democratic to be more compact, but still about the same district.

CA-30: (Burnt Sienna)

Henry Waxman

Obama 76%, McCain 22%

Nothing much to say about this one, it’s just more compact.

CA-31: (Vanilla)

Xavier Becerra

Obama 77%, McCain 21%

Includes much of Los Angeles and some outlying communites.

CA-32: (Medium Orange)

Judy Chu

Obama 68%, McCain 30%

Getting clean district lines in this part of Los Angeles County was hard, but I think I did a fairly good job of it here.

CA-33: (Denim Blue)

Karen Bass

Obama 85%, McCain 14%

It shrinks down some, but isn’t hugely different.

CA-34: (Emerald)

Lucille Roybal-Allard

Obama 85%, McCain 13%

Still holds portions of East Los Angeles and surrounding communities.

CA-35: (Purple)

Maxine Waters

Obama 85%, McCain 14%

Nothing much changed, only more compact.

CA-36: (Yellow Orange)

Jane Harman

Obama 63%, McCain 35%

Picks up Santa Monica and more the Palos Verdes Peninsula.

CA-37: (Blue)

Laura Richardson

Obama 78%, McCain 21%

Nothing much different here.

CA-38: (Sea Green)

Linda Sanchez, Grace Napolitano

Obama 61%, McCain 37%

Put together all of the gateway cities of L.A. County. Would likely be a bellwether district. I’d expect Napolitano to challenge Sanchez in the primary, Sanchez would have an edge because more of her old district is included.

CA-39: (Burgundy)

Ed Royce

McCain 54%, Obama 44%

Pulls together Fullerton, Orange, Yorba Linda and parts off Anaheim.

CA-40: (Bright Green)

OPEN

Obama 57%, McCain 41%

All the cities in the tail of San Bernardino County come together with Pomona for one compact district. Assemblymember Norma Torres would be a good recruit for the Democrats here.

Uploaded with ImageShack.us

CA-41: (Chocolate Brown)

Jerry Lewis

McCain 54%, Obama 44%

Almost no changes here, except it takes in all of empty San Bernardino County.

CA-42: (Fuchsia)

Joe Baca

Obama 63%, McCain 35%

Now includes Rancho Cucamonga. Was a swing district drawn like this in the past, but it’s majority-minority and should be a hold for Democrats.

CA-43: (Magenta)

Ken Calvert

Obama 53%, McCain 45%

Bill Hedrick ran strong in the current version which is very gerrymandered, so under lines that just contain this portion of Riverside County, he could win. Ken Calvert needed the Orange County portions to be safe, without them, it’s a different ball game.

CA-44: (Cyan)

Mary Bono Mack

Obama 55%, McCain 43%

This district would very likely elect a Democrat under these lines and I’m positive the commission will draw a district here, just because there is so much population and no place to go but a new district. Steve Pougnet, who ran in 2010 against Mary Bono Mack, would have a much better chance here. Mack may run here, but she does have another option that I’m about to discuss.

CA-45: (Baby Blue)

OPEN

McCain 54%, Obama 44%

A nice, compact district and probably a sure bet from the commission. Mary Bono Mack might run here, even though she’s from Palm Springs which is now in the new CA-44. It’s been said that she actually lives in Florida, so residency probably isn’t a big deal to her.

CA-46: (Coral)

Dana Rohrabacher

McCain 49%, Obama 49%

This district got a little more narrowly divided than the previous one. Looks pretty much the same, but it loses the Palos Verdes Peninsula, picks up some areas from the old CA-40 and a small portion of Long Beach. It looks very compact, but the commission might got another route.

CA-47: (Periwinkle)

Loretta Sanchez

Obama 58%, McCain 40%

Gets slightly less Democratic as I put in most of Garden Grove. I didn’t bother with this one too much, because the commission might have to leave it majority Hispanic.

CA-48: (Copper)

John Campbell

Obama 51%, McCain 48%

Gets a little more Democratic as it grabs Costa Mesa, while shedding some territory to CA-39 and CA-49.

Uploaded with ImageShack.us

CA-49: (Brick)

Darrell Issa

McCain 54%, Obama 44%

Goes into Orange County, instead of Riverside County like in the previous incarnation. Looks reasonably good for communities of interest.

CA-50: (Cream)

Susan Davis, Brian Bilbray

Obama 62%, McCain 36%

I attempted to divide San Diego County more evenly, including the city proper. I put most of the coastal cities here with some of San Diego proper. It looks as if it would be a bellwether district for the statewide vote. I think Susan Davis would prevail here.

CA-51: (Light Blue)

Bob Filner

Obama 62%, McCain 36%

I took out Imperial County and shrunk Filner’s district down to a Chula Vista centered one.

CA-52: (Forest Green)

OPEN

Obama 52%, McCain 46%

Another swing district, with an almost even PVI, it could go either way. Imperial County is always going to be attached to a district that is anchored to some larger density places, I thought it looked best in this district.

CA-53: (Light Gray)

Duncan Hunter Jr.

McCain 52%, Obama 46%

Should be fairly safe Republican district, although it is slightly less Republican than Hunter’s old district.

Maps without county and city lines.

Uploaded with ImageShack.us

Uploaded with ImageShack.us

Uploaded with ImageShack.us

Overall, that would be almost a net gain of 6 for the Democrats, just from drawing more compact districts. In reality, it will probably be 4 or 5, because I’m sure the Central Valley will turn out a bit differently than I had it, but there will nonetheless be another swing district up no matter how they draw it.

Fair Redistricting California

EDIT: I thought I used the proper population estimate, but I didn’t, so I’ll have to do this over shortly.
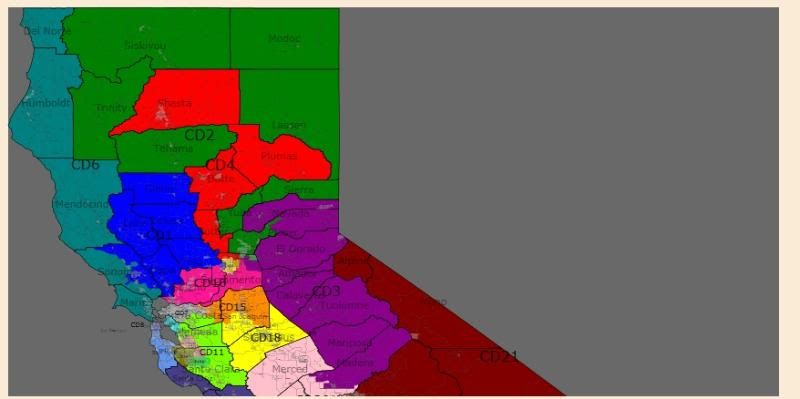
Photobucket

CA-1 (BLUE): Mike Thompson

Includes all of Colusa, Glenn, Lake and Napa Counties, along with portions of Yolo and Sonoma Counties. This district is about 50% different than his old one, but he’s still more than safe, as his district now includes Santa Rosa, as well as Davis and Napa, all heavily Democratic places. Probably about 60-65% Obama, maybe more.

CA-2 (GREEN): Tom McClintock

Includes Lassen, Modoc, Sierra, Siskiyou, Tehama, Trinity, Yuba and portions of Placer and Sacramento Counties. McClintock takes in much of rural California, because my goal was to consolidate most of those areas into one district (communities of interest). I would imagine this district would be around the same percentage that it was in 2008, 55% McCain.

CA-3 (Purple): Dan Lungren

Includes Amador, Calaveras, El Dorado, Mariposa, Nevada, Tuolumne and portions of Madera, Placer and Sacramento Counties. This district is very different that his former one, as it includes more rural territory and less of suburban Sacramento. I would say it around 55-56% McCain.

CA-4 (RED): Wally Herger

Includes Butte, Plumas, Sutter and Shasta Counties and portions of Sacramento County. This includes Herger’s base of Redding and his hometown of Chico. My goal was to consolidate the more populated parts of counties in these parts together. Estimated 56-57% McCain.

CA-5 (YELLOW GOLD): Doris Matsui

Contained in Sacramento County. Doris Matsui will be fine here, this district remains that same and would be around 68-70% Obama.

CA-6 (TEAL): Lynn Woolsey

Includes Del Norte, Marin and Mendocino Counties, along with portions of Sonoma. The North Coast should be in one district and that’s exactly what I did. Woolsey will not having any problems here, the district will still be 70% plus for Obama.
Photobucket

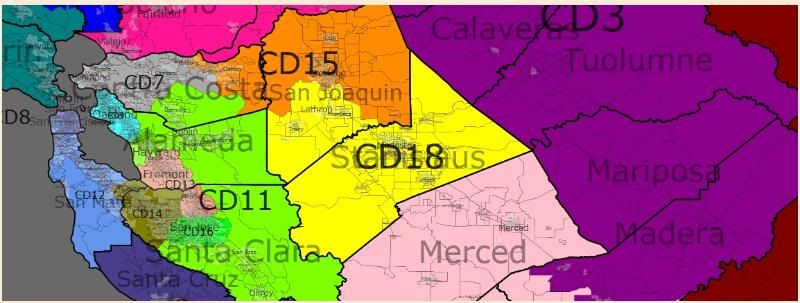
CA-7 (GRAY): George Miller

Contained within Contra Costa. My goal here was to clean up Contra Costa, give it more consolidation between districts. George Miller keeps Richmond, but add other interior areas, like Walnut Creek. Again, another Democratic incumbent with modifications, but still perfectly safe. 65-70% Obama.

CA-8 (VIOLET): Nancy Pelosi

Contained within San Francisco County. Not much change here, except the district covers more of San Francisco. 80-85% Obama.

CA-9 (LIGHT BLUE): Barbara Lee

Contained within Alameda County. This district is slightly different, as it includes Alameda and San Leandro in addition to Oakland and Berkeley. 80-90% Obama.

CA-10 (PINK): John Garamendi

Contains Solano County and portions of Yolo and Sacramento Counties. This is one of the biggest modifications I made. Garamendi’s district no longer sprawls and is now neat. My best estimate on this one would be 60% Obama, close to a good bellwether for the state.

CA-11 (LIGHT GREEN): Jerry McNerney

Contains portions of Alameda, Contra Costa and Santa Clara Counties. McNerney keeps all of the Alameda portion of his old district and most of the Contra Costa and Santa Clara parts, while shedding the San Joaquin portions. He picks up Hayward. I felt that this looked very compact compared to the old one. 65-66% Obama.

CA-12 (SKY BLUE): Jackie Speier

Contains portions of San Mateo County and a portion of San Franscisco. The biggest difference here is that Speier has more of San Mateo County, making for a much more compact district. 70%+ Obama.

CA-13 (SALMON): Mike Honda or Pete Stark

Portions of Alameda and Santa Clara Counties. Alameda County didn’t grow much since last census, so it was very difficult to retain CA-13. Pete Stark and Mike Honda would likely face off in a primary here, unless Stark opted for retirement. Either way, still a safe Democratic district, 70%+ Obama.

CA-14 (CAMOUFLAGE): Anna Eshoo

Portions of San Clara and Santa Mateo Counties. This district shrinks and is confined neatly within the Silicon Valley. 70%+ Obama.

CA-15 (ORANGE): OPEN

Portions of Contra Costa and San Joaquin counties. Stockton is finally contained within one district and the district overall is very compact. I’m not sure who would run here, but the district would be winnable for the right Democrat. 60% Obama, a pretty good bellwether.

CA-16 (BRIGHT GREEN): Zoe Lofgren

Contained within Santa Clara County. A nice compact district that takes in San Jose and some adjacent communities. 69-70% Obama.

CA-17 (PURPLE): Sam Farr

Includes San Benito and Santa Cruz Counties, along with portions Monterey County. This district in a compact form is slightly more Democratic than the old one. 70+ Obama.

CA-18 (YELLOW) : Dennis Cardoza or Jeff Denham

Includes portions of San Joaquin County and all of Stanislaus. Cardoza’s hometown is Atwater in Merced County, which I moved to CA-20, but CA-18 holds lots of his old territory. This district was only 51% Obama and it would be a swing one which he would likely face incoming GOP Rep. Jeff Denham in, since Denham’s old district was dismantled. Cardoza may opt to run in the new CA-15, which would be has more of a Democratic tilt or he could run in CA-20, if Jim Costa doesn’t maintain his seat or if he does, run against him in the primary.
Photobucket

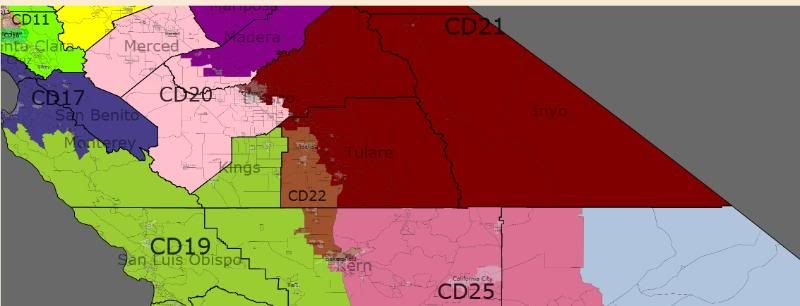
CA-19 (LIME GREEN): OPEN

Portions of Kern, Monterey and Santa Barbara Counties, with all of San Luis Obispo and Kings Counties. This district would about 51% McCain and 40% Hispanic, which would be a perfect fit for Abel Maldonado, who just lost the Lt. Gov’s race. North Santa Barbara County is hugely dysfunctional with South Santa Barbara County, so they’d be thrilled to have separate representation in Congress.

CA-20 (LIGHT PINK): Jim Costa or Andy Vidak

Portions of Fresno County and all of Merced County. Depending on how that race is decided, Costa would have a reasonbly safe district or Vidak would have one that wasn’t very favorable. I could have put Fresno in one district, but it would have been difficult to bring the sparsely populated places together in a compact way. About 58-60% Obama.

CA-21 (DARK RED): Devin Nunes

Portions of Fresno and Tulare Counties, plus Alpine, Mono and Inyo Counties. Not a drastic change, just sheds Visalia to CA-22 and picks up more of Fresno. Still about 56-57% McCain.

CA-22 (BROWN): Kevin McCarthy

Portions of Kern and Tulare Counties: Takes in most of Bakersfield and goes into Tulare and Visalia About 60% McCain.
Photobucket

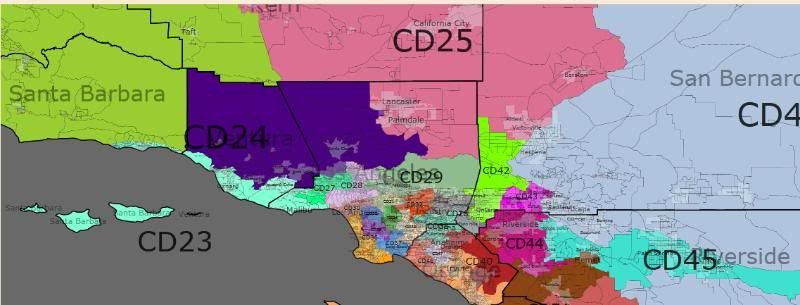
CA-23 (AQUA): Lois Capps

Portions of Los Angeles, Santa Barbara and Ventura Counties. I tried to make this district mainly coastal, while remaining compact and significantly smaller than the old one. The coastal cities have much of the same environmental and economic interests, while Thousand Oaks just ended up in there to balance out population. Probably about 60% Obama.

CA-24 (DARK PURPLE): Elton Gallegly

Portions of Los Angeles and Ventura Counties. I was worked very hard to make this one compact and put together places that made sense. Some parts of the San Fernando Valley are included. Probably about 50% or so McCain, maybe a little more or less.

CA-25 (MAGENTA): Buck McKeon

Portions of  Kern, Los Angeles and San Bernardino Counties. I wanted to create a High Desert district that consolidated the fast growing communities in these counties. I had bit of a hard time doing that, but I managed to pull it off. Probably around 54-55% McCain.
Photobucket

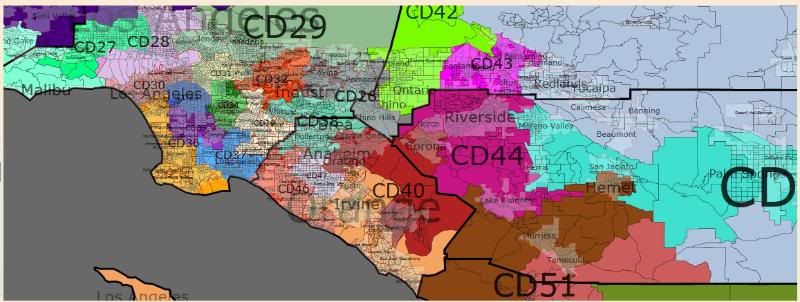
CA-26 (DARK GRAY): David Dreier

Portions of Los Angeles and San Bernardino Counties. This district is now quite different that it was before, including only a few areas from the old one and picking up Democratic voting Pomona. This part of Los Angeles County was very gerrymandered and this is how I best came up with how to undo it. 56% Obama.

CA-27: Brad Sherman

Portions of Los Angeles County. It pretty much stays the same, except for shedding some territory to CA-24 and not going into Burbank. 65%+ Obama.

CA-28: Howard Berman

Portions of Los Angeles County. Another one that is almost the same, it wasn’t difficult to make it compact without huge changes. 70%+ Obama.

CA-29: Adam Schiff

Portions of Los Angeles County. I included the entire city of Burbank in the district, as opposed to just half as in the previous map, along with some places from the old CA-26. Still probably 65%+ Obama.

CA-30: Henry Waxman

Portions of Los Angeles County. This one sheds parts of the San Fernando Valley and takes in more of Los Angeles. It looks much better and more compact than before. 70%+ Obama.

CA-31: Xavier Becerra

Portions of Los Angeles County. This district remains almost entirely within Los Angeles city limits and is still very Hispanic. Well over 70% Obama.

CA-32: Judy Chu

Portions of Los Angeles County. It shrinks some in size, but keeps much of the same territory. 60%+ Obama.

CA-33: Karen Bass

Portions of Los Angeles County. Now contained mostly within Los Angeles city limits, with most of the same territory. 80% Obama.

CA-34: Lucille Roybal-Allard

Portions of Los Angeles County. East Los Angeles and outlying communities, very Hispanic. Probably well over 75% Obama.

CA-35: Maxine Waters

Portions of Los Angeles County. Compton, Gardena, Hawthorne, Inglewood and some parts of Los Angeles. 80%+ Obama.

CA-36: Jane Harman

Portions of Los Angeles County. This district is about the same, except it consolidates the South Bay and Palos Verdes Peninsula. 60%+ Obama.

CA-37: Laura Richadson

Portions of Los Angeles County. This Long Beach dominated district doesn’t change much, except for removing Compton and adding some other communities in it’s place. Still 75%+ Obama.

CA-38: OPEN

Portions of Los Angeles and Orange Counties. This district was one of the most egregious gerrymanders. I broke up lots of territory and shifted other places. I formed the new CA-38 from Brea, Buena Park, Diamond Bar and Fullerton, along with some portions of Anaheim. Seeing as current 38th district holder, Grace Napolitano, is from Norwalk, which is in the 39th district now, and that this new 38th is an even PVI, she might attempt to primary Linda Sanchez or, shift to CA-26, which now includes the anchor of the old CA-38, Pomona. Republicans Ed Royce and Gary Miller’s hometowns are both in this district, so they could obviously run here, but might face stiff competition from a competent Democrat. They may opt to run in the new CA-40, which is heavily GOP. Overall, the district would be about 53% Obama.

CA-39: Linda Sanchez

Portions of Los Angeles County.  Another gerrymander that I opted to undo. This one is now a proper Gateway Cities district and looks more sensible. Probably still well over 60% Obama.

CA-40: OPEN

Portions of Orange and Riverside Counties. This was almost a leftover’s district, but I didn’t compact it well. It takes in strongly Republican Orange and Yorba Linda, along with Corona. I think all these areas would have a reasonably similar median income, so the pairings make sense. Ed Royce, Gary Miller and Ken Calvert would likely face off here in the primary. 56% McCain.
Photobucket

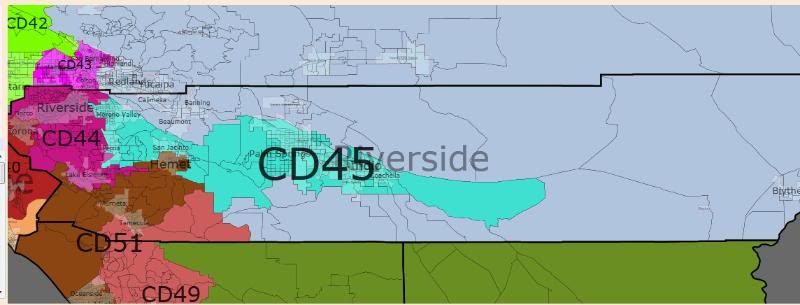
CA-41: Jerry Lewis

Portions of Riverside and San Bernardino Counties. It basically keeps it’s population centers, but wraps around and picks up more lightly populated parts of Riverside County. 56% McCain.

CA-42: OPEN

Portions of Los Angeles and San Bernardino Counties. I had couldn’t get the population just right with this one, but by my estimation, it would be right on the mark or close with these lines under the new census numbers as there has been lots of growth around these parts. This district is 49% Hispanic. It pairs Democratic voting Ontario with Republican Rancho Cucamonga and Chino. About 52-53% Obama.

CA-43: Joe Baca

Portions of San Bernardino County. More or less the same as it was before, but with big population growth, it would shift some of it’s territory to CA-42 and even out it’s population. Still would be 60%+ Obama.

CA-44: Ken Calvert

Portions of Riverside County. The City of Riverside, plus Norco and Lake Elsinore forms the new CA-44. Ken Calvert could try his luck here, but without Corona and the parts of Orange County from his old district, he’d likely lose to Bill Hedrick. It’d be easier for him to try his luck in the CA-40 primary, where he may have an edge with his hometown of Corona.

CA-45: Mary Bono Mack

Portions of Riverside County. This one shrinks down, confined strictly to a few communities. I combined Indio, Moreno Valley and Palm Springs for the population anchor, with smaller places like Perris and Coachella. Without Hemet and Murrieta, Bono Mack would be at a disadvantage. She could try her luck in CA-41 against ethically challenged Jerry Lewis. Steve Pougnet would be able to win this incarnation of CA-45, as it’s about 56% Obama.

CA-46: Dana Rohrabacher

Portions of Los Angeles and Orange Counties. Combines Huntington Beach and Newport Beach, along with other communities in that corner of Orange County. I estimate it’s about 55% McCain.

CA-47: Loretta Sanchez

Portions of Orange County. I made it slightly more compact, by adding more of Garden Grove. It’s about the same as before, although a bit less Obama than before, around 59% now.

CA-48: John Campbell

Portions of Orange County. Costa Mesa gets added to this district, as well San Clemente. About 50% Obama now. Might be promising for a Democrat in the future.

Photobucket

CA-49: OPEN

Portions of San Diego and Riverside Counties. Although Issa is from Vista, much of his old district is here. It’s very Republican (55% or more McCain) and he would have no problems, but he’d probably run in CA-51.

CA-50: Susan Davis

Portions of San Diego County. There was a lot of gerrymandering in these parts too, so I undid it and now Davis takes in about half of her old territory and a lot from CA-50. It’s a few points less Obama than her old district (probably about 63%), but she shouldn’t have any problems here.

CA-51: Brian Bilbray or Darrell Issa

Portions of Riverside and San Diego Counties. Bilbray and Issa may face off here, or one may opt for the new CA-49. Around 55-56% McCain, maybe more.

CA-52: Duncan Hunter Jr.

The whole of Imperial County and portions of San Diego County. My push for compactness made this one less Republican than it originally was, which wasn’t my intention. I wanted to make the lines that split San Diego looks more even and stick Imperial County in neatly, which resulted in a district that voted very narrowly for Obama. It would still have Republican lean, but be a lot more swingy.

CA-53: Bob Filner

Portions of San Diego County. Sheds Imperial County and picks up more of San Diego and Imperial Beach. Likely still around 60% or so Obama. Filner would be fine here.

The Last Word: DrPhillips Final US House Predictions

My methodology this year has been based on past election and how shifts in power have occurred. I’ve been inclined to believe that the sort of mega gains that happened in the earlier portion of the last century won’t happen ever again, just because political polarization has set in.

That said, looking at SSP’s rankings, this is what I have come up with this loss list.

AR-1 (OPEN)

AR-2 (OPEN)

AZ-1 (Kirkpatrick)

AZ-5 (Mitchell)

CO-3 (Salazar)

CO-4 (Markey)

FL-2 (Boyd)

FL-8 (Grayson)

FL-22 (Klein)

FL-24 (Kosmas)

GA-8 (Marshall)

IL-11 (Halvorson)

IL-14 (Foster)

IL-17 (Hare)

IN-8 (OPEN)

KS-3 (OPEN)

LA-3 (OPEN)

MD-1 (Kratovil)  

MI-1 (OPEN)

MS-1 (Childers)

ND-AL (Pomeroy)

NM-2 (Teague)

NV-3 (Titus)

NY-20 (Murphy)

NH-1 (Shea-Porter)

NH-2 (OPEN)

NY-29 (OPEN)

OH-1 (Driehaus)

OH-15 (Kilroy)

OH-16 (Boccieri)

PA-3 (Dahlkemper)

PA-7 (OPEN)

PA-8 (Murphy)

PA-11 (Kanjorski)

SC-5 (Spratt)

VA-2 (Nye)

VA-5 (Perriello)

TN-6 (OPEN)

TN-8 (OPEN)

TX-17 (Edwards)

WA-3 (OPEN)

WI-7 (OPEN)

WI-8 (Kagen)

Subtract the 4 seats that Democrats will likely gain and you get a net Republican gain of 39, close to the majority, but not quite.

My other method is to simply combine Lean, Likely and Safe R seats with an almost exact division of the D Tossups and that would bring the number to a net 45 gains and a majority of 223 for the Republicans. If there is a Republican majority, it won’t be a huge one. Democrats could have more gains in FL-25 or AZ-3 work out.

Some might say I’m being overly generous, but that wasn’t my intention. The Republicans could get well over 50 seats, they certainly could do that if more tossups break towards them. I do think 50-55 is the limit. In 1994, Republicans picked up 54 seats and in 2006 through 2008, Democrats picked up 51 seats. I think the pool of marginals is right around that area and that’s why my forecast looks like it does.

DrPhillips’ California State Legislature Forecast (revised)

I’m back again with my outlook for the California legislature, revised this time. I’ve changed a few things, as conditions look somewhat different in a few races. First off, I would like to take time to acknowledge State Senator Jenny Oropeza, D-Long Beach, who passed away at age 53 on Wednesday. SSP’ers might remember her name from the Democratic primary for the special election for CA-37 in 2007. May she rest in peace.

AD-5

As I explained in the last diary, this is a very narrowly divided district and is just outside Sacramento. The state party is spending money on the Democratic nominee, Richard Pan and he’s got 1.4 million in the bank and is a very formidable opponent against ultra right-wing, Prop. 8 author, Andy Pugno. It’s interesting to note that some of this district is within CA-3, which is seeing a very competitive race between Rep. Dan Lungren and Dr. Ami Bera.  This one is still a Toss-Up.

AD-10

Still rating this one Toss-Up/Tilt Democratic just because of environment and unpredictability, but I think Alyson Huber is in great shape in this Sacramento area seat. She’s picked up good endorsements and has been named “Legislator of the Year” by California Small Business Association.

AD-15

I think this seat is now the Republicans best pickup opportunity. With Jerry McNerney in a tight race, that might spill over into the Assembly race, as much of this district is in CA-11. It’s not often an incumbent is ousted in the Assembly, so I’m leaving this one as Toss-Up/Tilt Democratic.

AD-35

Before, I thought Das Williams might have a problem here, but he has improved his money situation and that should play well to his advantage. I’m switching this one to Likely Democratic.

AD-53

This South Bay seat has been reliably Democratic for quite awhile, the last really competitive race was in 1994 when then Assemblymember and current Secretary of State Debra Bowen held off a Republican challenge. Democratic nominee Betsy Butler is a decent candidate, but there are some rumblings that this one is on the Republicans radar. Their nominee, Nathan Mintz, is a Tea Party candidate, so that might not play well here, but this one is worth watching since surprises happen in years like this. Likely Democratic.

AD-54

Another South Bay seat. Bonnie Lowenthal won this seat in 2008 with 56% of the vote, even with Obama winning it with 61%. This will be her second race and it’s clear that she didn’t get huge coattails in a Presidential year, so this one should be on the watch list for this year. Her opponent, Republican Martha Flores-Gibson is running a decent campaign, but it may not be enough to dislodge Lowenthal. Likely Democratic.

AD-68

Phu Nguyen picked up some public safety unions this week, which is telling, since his opponent, Allan Mansoor is a former deputy. Nguyen seems to be running a highly energetic campaign and could pull off a win. Nguyen has outspent Mansoor in the past filing period and still has more COH, which is a very good thing. I’m rating this one Lean Republican, only because it has been traditionally Republican and hard for a Democrat to win.

AD-70

Republican Don Wagner has not been very visible on the campaign trail and is quite right-wing. On the Democratic side, you have Melissa Fox who is running a very competent and energetic campaign. Even though this has long been a Republican district, that grip is slipping as Democratic leaning Irvine has helped make Democrats viable here. I rated this one as Likely Republican before, but I’m moving it to Lean Republican, simply because Fox is a top tier candidate and Wagner is running a lackluster campaign, conditions that make an upset very possible.

State Senate

SD-12

Shifting this one to Toss-Up/Tilt Democratic. With a little less of an enthusiasm gap in California and the fact that Cabellero can run up good numbers in the Salinas portion of the district, I think she will pick this one up for the Democrats.

SD-34

Nothing much has changed here. Lou Correa picked up a Chamber of Commerce endorsement, which should boost his prospects and the district has picked up a lot more Democratic voters since his initial narrow victory here. Plus, he’s got big money. Likely Democratic.

Overall, the Democrats will retain majorities in both houses of the legislature and perhaps, even add a couple of seats. If Republicans don’t manage to grab any seats, expect Assembly Minority Leader Martin Garrick to be out, as his leadership has been criticized by Republicans, including fellow Assemblymember Connie Conway.

My rankings for the statewide races:

Governor: Likely Democratic

Lt. Governor: Likely Democratic

Atty. General: Toss-up

Secretary of State: Solid Democratic

Treasurer: Solid Democratic

Controller: Solid Democratic

Insurance Commissioner: Likely Democratic

U.S. Senate: Lean Democratic

At this point, it looks like Democrats in California will survive this cycle fairly well.

DrPhillips revised US House Predictions

Analyzing the midterm elections gets easier the closer it gets to the actual vote. What I'm going to do is take a look at the midterm elections of other Presidents.  

Lyndon Johnson's only midterm resulted in a huge loss for Democrats, 48 seats were lost, but Democrats still held a commanding majority of 247. Lyndon Johnson's landslide victory in 1964 initiated many gains for Democrats in the House, 36 seats, so much of the 1966 midterm was a fall from a previous over performance.  

Jimmy Carter's only midterm results in very moderate losses for Democrats, 15 to be exact. This is an example of a very routine midterm, there was not a lot of satisfaction with how things were going, but there wasn't big movement in voting.

 Ronald Reagan's first midterm resulted in 26 seats lost for Republicans, but at the same time Republicans held on to the Senate, which had a Republican majority due to Reagan's large victory in 1980.

 Fast forward to 1994 and Bill Clinton's midterm, which resulted in the disastrous loss of 54 seats to Republicans. The electorate was dissatisfied and you had an organized Republican opposition that people felt they could take a chance on.

The popular vote numbers for each of these elections  

1966: D-50%, R-49%  

1978: D-53%, R-44%  

1982: D-54%, R-43%

1994:R-47%, D-44%

 As you can see, the popular vote margins don't necessarily reflect how small or large party's losses will be, which is why generic polling isn't a great indicator about how things will go, but I am factoring it in just a bit to help me gauge the terrain. Another thing to factor in is that Democrats survived a few midterms because they had huge enough room to drop some seats and still be in the driver's seat. Right now, Democrats hold an overall majority that is slightly less than they had before the 1994 midterm. To the board now (purple means toss-ups). The second and third columns are in no real particular order of vulnerability.  


TN-6 AL-2 NJ-6
LA-3 ID-1 CT-4
AR-2 VA-11 NJ-12
NY-29 NM-1 WI-3
OH-1 NJ-3 UT-2
OH-15 WV-1 NC-2
IN-8 MO-4 MO-3
KS-3 PA-12 IL-8
VA-5 TX-23 CA-20
IN-9 NY-13 CA-47
TN-8 PA-4 KY-6
VA-2 MA-10 IN-2
FL-8 NY-23 MN-1
NH-2 VA-9 NY-20
MS-1 CT-5 NY-25
WA-3 OR-5 TN-4
NH-1 WV-3 RI-1
FL-24 OH-18 OH-6
PA-10 CA-11 GA-12
AR-1   NY-1
NM-2   OR-1
PA-7   PA-17
IL-11   IA-1
PA-3   KY-3
MI-1   CA-18
PA-11   MI-9
SC-5   CO-7
TX-17    
AZ-1    
AZ-5    
WI-8    
NY-24    
MD-1    
ND-AL    
SD-AL    
FL-2    
IL-14    
WI-7    
CO-4    
MI-7    
NV-3    
NY-19    
FL-22    
PA-8    
IA-3    
GA-8    
OH-16    
OH-13    
IL-17    
CO-3    
NC-8    


That’s 26 seats that are likely loses and 22 more on the cusp. If the Republicans do remarkably well and sweep every seat between postions 1 and 44 without losing any of their own, they have a majority of 222, but here is the catch. At least 3 GOP-held seats are about certain to flip Democratic, with another on the cusp and one or maybe two more edging toward that. If they only lose three of those seat (DE-AL, HI-1, LA-2) the Republicans will right at 219 and the Democrats at 216. If Dan Seals is successful in IL-10, then it’s 218-217, which is basically a hung Congress (like a hung Parliament), the GOP has a majority, but it’s not solid enough to do much. Of course, the GOP  probably won’t win all the toss-ups and could miss some seats on the solid flip list.

I predict they will get no less than 22 of the seats that look best for them and get half the toss-ups for an overall gain of 32. Minus the 4 seats leaning Democratic, it’s a gain of 28. The toss-up wins could be more and there may be more wild cards that pop up. Overall, the GOP would have to run the table on everything that is out there, plus grab some extras. 226-206 is my current prediction, give or take a number. If the election does somehow turn out to be 218-217 for either side, Capitol Hill will be one mess of gridlock.