Home Means Nevada: Redistricting Congress “Fairly”

(Also at Nevada Progressive)

In our previous glimpses into redistricting Nevada’s Congressional Districts, we discussed what would happen if The Legislature redraws the lines based on certain politicians’ future aspirations. But this time, I’m throwing a curveball at you. What happens if The Legislature can’t agree on a map?

Today, the fun really begins with a glimpse of a possible court drawn map.

Yes, you heard me right. Two law suits have already been filed, one by the Nevada Democratic Party and another by the Nevada GOP, and more legal action may follow if The Legislature drags on without a map ready for 2012. If the increasingly brutal state budget battle drags on to Summer Special Session with no agreement in sight, there’s a good chance the gridlock will also extend to redistricting. And as much as Nevada Supreme Court justices do NOT want to wade into redistricting, I’ve been hearing that both they and the major parties are seeing it as more of a real possibility.

So what happens? Let’s take a look at just that, as a few angry judges throw out the political memos and guide a nonpartisan team to draw “fair” lines.

Share photos on twitter with Twitpic

Share photos on twitter with Twitpic

NV-02 (The Dark Green District)

Population: 674,932

69.3% White (73.7% VAP)

The State of Play

As you can see above, this is still a Washoe County based district. The good news for Republicans is that Washoe’s flirtations with Democrats can be offset by heavily Republican rural areas like Elko, Douglas, and Lyon Counties. However, the bad news is that swingy Mineral County and Carson City are also included. All in all, The 2nd District becomes slightly more Democratic.

Who’s All In?

Now that Kirk Lippold and Sharron Angle are officially in, let the tea-nuttery begin! It will be to fun to see those two out-crazy each other, then watch as “poor” Mark Amodei and Brian Krolicki try to get some of those teabagger votes without going too far off the deep end.

On the Democratic side, State Treasurer Kate Marshall is sounding more and more like a real candidate.

The Wild Cards

However, Marshall may not be alone. 2006 and 2008 NV-02 Democratic nominee Jill Derby is also looking at the race, along with Assembly Member Debbie Smith (D-Sparks) and Reno City Council Member Jessica Sferrazza. Now that all out madness is ensuing on the GOP side, Washoe Dems are increasingly liking their chances here… But it still won’t be an easy ride. Why? See below.

Estimated 2008 Results: 49-50% Obama (D)

Early Race Rating: Leans Republican for now, Tossup if Angle or Lippold wins the GOP primary

Share photos on twitter with Twitpic

NV-04 (The Purple District)

Population: 675,314

61.9% White (65.2% VAP)

The State of Play

Now here’s where things start to get wild! Notice some changes? For one, it’s the new district that now gets drawn into the rurals. The new 4th District starts in rural Churchill County (Fallon gets placed in NV-02 because it can be argued it shares a community of interest with the other Reno exurbs), but otherwise the other rural counties are left whole as the district stretches from Ely down to Pahrump, then finally to Clark County. And once the district crosses into Clark, it takes in northern rural areas, from Indian Springs to Overton & Mesquite, then drops into the valley to take in the once rapidly expanding Northwest and Southwest Las Vegas suburbs, as well as all of Summerlin and some whiter West Side neighborhoods.

In essence, this is THE classic swing district with a unique mix of rural Republican strongholds, urban Democratic bases, and a whole lot of evenly divided suburban battlegrounds that can very well go either way next year… And that’s how the court will want it.

Who’s All In?

Notice something else? There’s no incumbent here! Even though there technically is one in Shelley Berkley, we all now know what she’s up to. So in her absence, there should be a wild ride on both sides in vying for this seat.

On the Republican side, State Senator Barbara Cegavske‘s (R-Summerlin) wish will finally be fulfilled as she now has an open seat to compete in. But then again, she may get an unwanted surprise if local teabagger groups rally behind the newly crowned, tea-tinged superstar in State Senator Elizabeth Halseth (R-Northwest Vegas). State Assembly Member Scott Hammond (R-Northwest Vegas) may also feel the temptation.

On the Democratic side, Assembly Member Marcus Conklin (D-Northwest Vegas) may be real opportunity here. And considering his gracious concession earlier this month and offer to endorse Chris Giunchigliani for Las Vegas Mayor after 15 votes separated them in the primary, Larry Brown is busy re-earning goodwill that may come in handy should he run for Congress next year. (By the way, in case you were wondering, he’s also apologized for the confusion over his support for SB 283 and domestic partnerships for LGBTQ families.) And unless the Nevada GOP can sideline Cegavske and Halseth in favor of a more mainstream nominee, Dems may very well like their chances here.

The Wild Cards

Hey, isn’t it wild enough already!

Estimated 2008 Results: 51-54% Obama (D)

Early Race Rating: Tossup

Share photos on twitter with Twitpic

NV-01 (The Blue District)

Population: 674,765

47.0% Latino (41.2% VAP), 29.1% White (34.5% VAP), 14.6% African American (14.8% VAP)

The State of Play

Even if Shelley Berkley wasn’t running for Senate, the court would not care where she lives or where she “wants” to represent. But now that she’s definitely out of the picture, all bets are off! The 1st District contracts to just (all of) North Las Vegas and the older, more Latino and African American heavy parts of The City of Las Vegas, as well as a few heavily Latino unincorporated Clark County areas and the northern half of The Strip.

Who’s All In?

State Senate Majority Leader Steven Horsford (D-North Las Vegas) hasn’t done a great job of hiding his desire to head to DC. And thankfully for him, a court drawn map doesn’t prevent that, as this is designed to be a VRA protected minority-majority coalition district.

However, the path isn’t too clear for him. After all, this is a strong Latino plurality district, and State Senator Ruben Kihuen (D-North Las Vegas) is a fierce fighter who’s gaining broader appeal as a strong, progressive voice in The Legislature. Since this district overlaps with nearly all of his current Senate district, Kihuen definitely can’t be counted out.

The Wild Cards

State Senator John Lee (D-North Las Vegas) isn’t stupid, so perhaps he can’t entirely be counted out yet. But as I’ve said before, he’s acting far too conservative this session to really gain traction in a Democratic primary here.

And sorry, Republicans, but there’s really no GOPer who can compete here.

Estimated 2008 Results: 67-68% Obama (D)

Early Race Rating: Safe Democratic

Share photos on twitter with Twitpic

NV-03 (The Red District)

Population: 675,520

56.2% White (60.3% VAP), 23.1% Latino (19.8% VAP), 9.6% Asian American (10.0% VAP)

The State of Play

Now here’s where things get really crazy! Remember, the court is overseeing the drawing of this map. The judges don’t care what Joe Heck wants or who he wants to represent. All they care about are population equity and fair boundaries. So unfortunately for him, he’s forced to accept a Henderson based district that keeps the entire city intact while stretching north into the strongly Democratic East Side (which can be argued shares a community of interest with most of Henderson), and west across The Strip to heavily Democratic Spring Valley (which can be argued shares a community of interest with The East Side, and is needed for population equity), and across Eastern Avenue to Democratic leaning Silverado Ranch.

However, Democrats shouldn’t get too giddy here. Remember, ALL of Henderson is kept in here, including Joe Heck’s own MacDonald Ranch/Roma Hills base as well as the opulent, affulent, & Republican dominant Anthem & Seven Hills communities. Also kept in are more GOP heavy Boulder City, along with the rural communities of Searchlight and Laughlin further south (as well as Primm, added in from NV-02).

Who’s All In?

Obviously, Joe Heck wants another term. However, he will really have to rethink his strategy if The Legislature deadlocks on the state budget and redistricting gets determined in court. Since he’s likely to be kept in what will at least be a Democratic tilting district, he will need far more crossover support than he got in 2010 to survive next year in a district President Obama will probably win by double digits again.

So obviously, Heck looks to be an inviting target for Assembly Speaker John Oceguera (D-Silverado Ranch). He’s survived tough battles before, and he’s in the fight of his life now over the state budget. He may feel ready to take on Heck…

But there’s someone else waiting in the wings, someone who will have waited a year for the rematch she’s been looking for. Dina Titus definitely shouldn’t be counted out, especially since she only barely lost last time… And this time, many of the areas where she performed worst have been removed. Meanwhile, her East Side base is left intact, along with the Green Valley (Henderson) neighborhoods where she beat Heck.

The Wild Cards

Byron Georgiou has quickly turned from welcomed Democratic fundraiser to unwelcome Democratic pariah. Both Shelley Berkley and Harry Reid want him out of the Senate race, and rumors have surfaced about him possibly running for House instead. So will it be here? Or in the new NV-04 seat? Or maybe even NV-01? Whatever the case, a whole lot of Democratic strategists nervously await where Georgiou will land.

And of course, depending on what Joe Heck does, particularly how he votes in The House, there’s a chance of him being called for “tea time” in the GOP primary.

Estimated 2008 Results: 55-57% Obama (D)

Early Race Rating: Tossup for now, Leans Democratic if Heck has primary woes & Dems get a top notch nominee

So there you have it. This is just one scenario of what might happen if redistricting Nevada’s Congressional Districts is tossed to the courts for judges to decide and nonpartisan players to draw. An incumbent is thrown into jeopardy, two open seats lead to total feeding frenzies, and an epic rematch may be coming to doorsteps near me soon.

TX-SBOE Maps

Today in the Texas House, the Committee Substitute to HB 600 was read a 3rd time and passed.

HB 600 redraws the State Board of Education seats.

There has been some talk about increasing the size of the SBOE. It currently has only 15 members which means the ideal population size for the new districts is 1.6 million.

Who cares about some SBOE seats? Considering that Texas is one of the biggest buyers of textbooks (when the state has the money to purchase them), and that these 15 people decide what goes in the textbooks, these 15 seats can have a national impact.

So what did the House finally agree to?

It should be noted that all 15 of these seats will be up in 2012. The year after redistricting all of the members of the State Senate and the State Board of Education run.  They then draw to see who runs in 2 years (i.e. 2014) or 4 years (i.e. 2016)

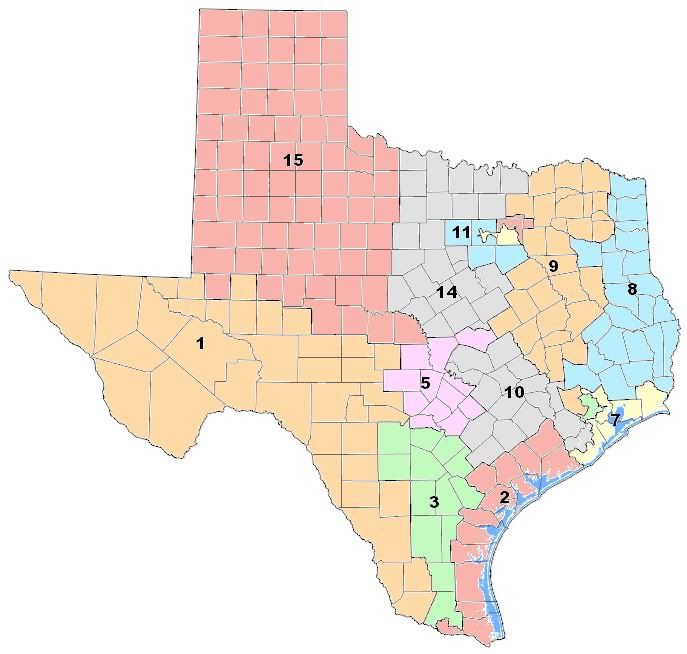
First, here’s a map of the current SBOE districts.

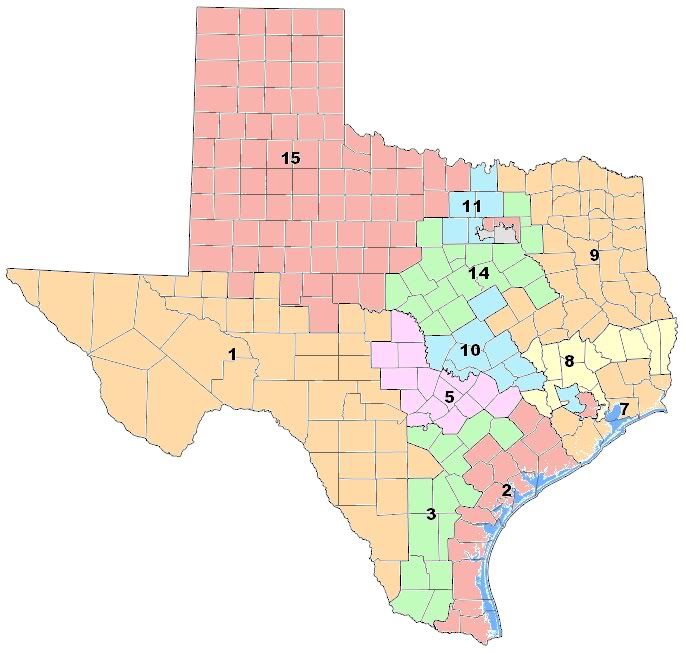
The new districts:

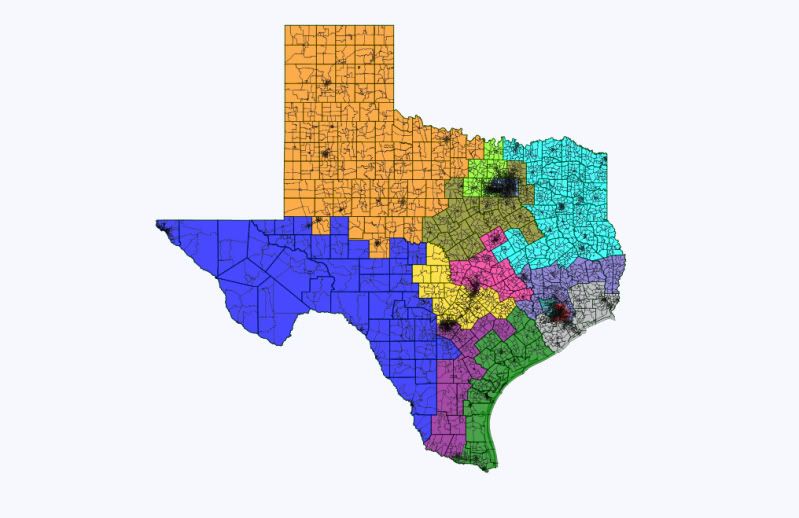
New districts in Dave’s App

These maps are from the state’s redistricting website, but they didn’t provide any partisan data. So I drew them using Dave’s App.

District 1

Lean-Likely D

55% Obama/45% McCain

73% Hispanic, 24% White, 3% Black, 1% Asian

This district is interesting because in 2010 it elected a Republican. The incumbent Democrat may have gotten a little complacent having been elected in 1988 and his only previously close election being in 1994 when he won 53% to 47%. Although with a district that contains both El Paso and Laredo, you have to think you’d be pretty safe as a Hispanic Democrat. Democrats have the chance to recapture this seat in 2012.

District 2

Lean D

52% Obama/47% McCain

69% Hispanic, 27% White, 3% Black, 1% Asian

This district features a longtime incumbent with Democrat Mary Helen Berlanga. She’s been on the board since 1982. That’s long enough to have been elected to the SBOE (in 1982), appointed to the SBOE (in 1984 when the Lege made it an appointed body), and elected again (in 1988 when it went back to an elected body).  In spite of the closeness of this district, Berlanga has managed to solidly win every time.

District 3

Safe D

60% Obama/39% McCain

68% Hispanic, 27% White, 7% Black, 2% Asian

This district pretty much stays safe for a Democrat.

District 4

Light Red (next to District 7)

Safe D

73% Obama/26% McCain

49% Hispanic, 30% Black, 16% White, 5% Asian

Stays a solid Democratic district.

District 5

Yellow

Lean-Likely R

44% Obama/54% McCain

60% White, 31% Hispanic, 6% Black, 4% Asian

This district still takes in heavily Republican areas in north Bexar County. In Bexar County it trades some Republican areas in NE Bexar County (Live Oak, Universal City, Converse, Schertz, and Randolph AFB) for some others (Alamo Heights, Olmos Park, and Terrell Hills). It keeps the Republican counties of Kendall, Comal, and Guadalupe. It only slightly increases its coverage of Travis County. It sheds Bell County which contains Killeen-Temple-Fort Hood.

District 6

Light Blue (below District 8, directly to the left of District 4)

Likely R

41% Obama/58% McCain

48% White, 30% Hispanic, 12% Black, 11% Asian

This district pretty much stays the same, only losing a small slice of Harris County.

District 7

Likely R

41% Obama/58% McCain

54% White, 18% Black, 19% Hispanic, 9% Asian

This district sheds east Harris County and adds 4 new counties. This could be a ripe district for Democrats to target because the new configuration includes Fort Bend County.  This county has been trending Democratic. In 2008, the county went 49% Obama/51% McCain. In 2010 it went 47% Bill White/52% Rick Perry.

District 8

Safe R

65% White, 20% Hispanic, 11% Black, 4% Asian

This district has some changes. Previously it ran up east Texas. It now moves south and becomes more compact.

District 9

Safe R

30% Obama/70% McCain

73% White, 15% Black, 11% Hispanic, 2% Asian

This district takes in a lot of the old 8th.

District 10

Toss Up

49% Obama/49% McCain

61% White, 21% Hispanic, 12% Black, 6% Asian

I never thought I’d be able to write tossup about either a State Senate seat or an SBOE seat. *The 2008 vote totals for this district were 298,091 for Obama and 298,430 for McCain. 339 votes. Democrats may finally be able to win a new seat on the SBOE.  If Judy Jennings wants another crack at this seat, 2012 is the year to do it with the presidential race and Travis County. This district now doesn’t go all the way from Austin to the Houston suburbs.

*Thanks to Greg at Greg’s Opinion for the updated numbers. And thanks to blank for the prodding that got the update.

District 11

Safe R

37% Obama/62% McCain

67% White, 17% Hispanic, 9% Black, 6% Asian

Takes in plenty of Republican areas to still make it safe for Republicans.

District 12

Red (covers northern portion of Dallas County and NE quadrant of Tarrant County)

Likely R

43% Obama/57% McCain

58% White, 21% Hispanic, 12% Black, 8% Asian

Here is another potential opportunity for Democrats. It sheds Rockwall County and a portion of Collin County, while adding a portion of Tarrant County. Thanks to the success of Dallas County Democrats, this district has the potential to be competitive.

District 13

Gray (weird looking district that covers Dallas and Tarrant counties)

Safe D

69% Obama/30% McCain

41% Hispanic, 26% White, 30% Black, 4% Asian

Takes in more of Tarrant County, but continues to be a safe Democratic seat.

District 14

Safe R

32% Obama/67% McCain

71% White, 14% Hispanic, 7% Black, 7% Asian

District 15

Safe R

25% Obama/74% McCain

65% White, 27% Hispanic, 6% Black, 3% Asian

Currently the board is split 4 D – 11 R. If Democrats play their cards right, they could conceivably wind up with a 6 D – 9 R split on the SBOE. Democrats should go for broke and make a serious play for Districts 5, 7, & 12, if only to try and get an idea of what the Democratic performance is like in the new districts.

Populations for districts are VAP from the state.

A Democratic Washington

Washington voted for Obama in the 2008 presidential election by a wide margin, 57.6%-40.5% (17.1%). Therefore I’ve created a map where all ten congressional districts have the same Obama percentage, that is the same margin he won statewide.

All ten districts are within 0.05% Obama pecentage and 500 population of the median.  

Maryland Redistricting Map

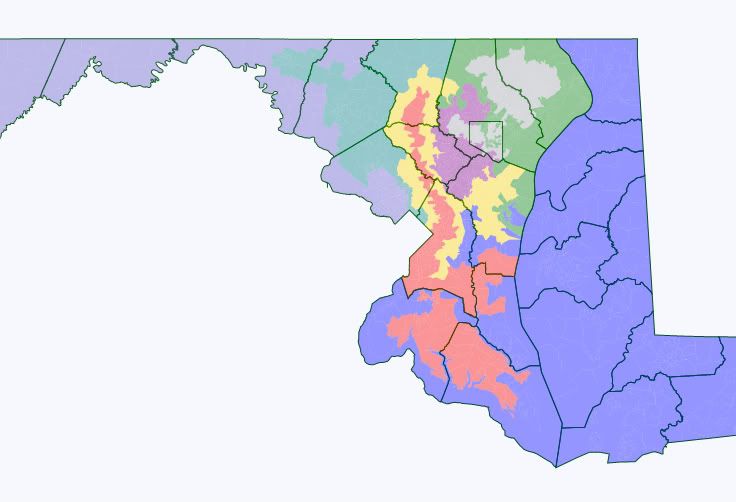
I’ve always hated Maryland’s extreme gerrymander, so I wanted to try and create a map that is more compact than the current one, but still provides a 7-1 Democratic advantage.  

Goals:

-Keep counties together as much as possible

-Keep two VRA districts

-Pack as many Republicans as possible into MD 6

-Maximize the Dem vote in the other 7 districts without having too many excess votes in the most Democratic ones

I did not however try to account for where the current Representatives live or where the majority of their current constituency resides, although I did keep the same general geographical location of each of the 8 districts.

1st District

The 1st District is really the target of this exercise, and becomes more Democratic by shedding territory in the northeast Baltimore suburbs and extending westward into heavily Dem eastern Prince George’s County.  If I wasn’t as concerned about geographic continuity it could actually extend further west to the DC border to pick up the excess Dem vote from MD-4 and shed more territory in the NE corner of the state to MD-6.  As it is, this becomes a district that would have gone 53% for Obama.  Certainly not a safe Democratic seat, but definitely an improvement over the current map and one where we would have a leg up.  

Racial Composition Change by CD

With the Census Bureau having released 2010 data for all 435 congressional districts, I started slicing ‘n’ dicing the data last week, looking at population change in the fastest growing and shrinking districts. Today, as promised, we’re moving on to how the racial composition of the congressional districts has changed.

You might remember that I did this same project a year and a half ago based on 2008 estimated data, and that was a good template for today’s work, as the lists haven’t changed that much. Where the lists have changed, it seems to be more likely because of strange sample issues in 2008 (like the rapid appearance and subsequent disappearance of a big Asian population in NY-06) than rapid changes in the trend over the last two years. As with last time, the most remarkable chart is the one showing biggest declines, percentage-wise in districts’ non-Hispanic white populations. (Because this is the key chart, I’m extending this list to 25 places.) As you’ll no doubt notice, many of these districts also had some of the biggest moves in the Democratic direction over the years from 2000 to 2008.

District Rep. 2000
white
2000
total
2000
%
2010
white
2010
total
2010
%
%
change
2000
election
2008
election
GA-07 Woodall (R) 476,346 630,511 75.5 486,673 903,191 53.9 – 21.7 31/69 39/60
GA-13 Scott (D) 295,107 629,403 46.9 202,053 784,445 25.8 – 21.1 57/43 71/28
TX-24 Marchant (R) 415,842 651,137 63.9 368,645 792,319 46.5 – 17.3 32/68 44/55
TX-22 Olson (R) 394,651 651,657 60.6 405,645 910,877 44.5 – 16.0 33/67 41/58
FL-19 Deutch (D) 494,890 638,503 77.5 456,060 736,419 61.9 – 15.5 73/27 65/34
CA-25 McKeon (R) 363,792 638,768 57.0 352,189 844,320 41.7 – 15.2 42/56 49/48
FL-20 Wasserman Schultz (D) 426,891 639,795 66.7 358,470 691,727 51.8 – 14.9 69/31 63/36
TX-07 Culberson (R) 439,217 651,682 67.4 411,276 780,611 52.7 – 14.7 31/69 41/58
NV-03 Heck (R) 459,756 665,345 69.1 568,343 1,043,855 54.4 – 14.7 49/48 55/43
TX-10 McCaul (R) 431,992 651,523 66.3 513,811 981,367 52.4 – 13.9 34/67 44/55
IL-03 Lipinski (D) 445,179 653,292 68.1 361,581 663,381 54.5 – 13.6 58/40 64/35
CA-11 McNerney (D) 408,785 639,625 63.9 400,825 796,753 50.3 – 13.6 45/53 54/44
VA-10 Wolf (R) 495,611 643,714 77.0 554,054 869,437 63.7 – 13.3 41/56 53/46
TX-02 Poe (R) 418,476, 651,605 64.2 399,454 782,375 51.1 – 13.2 37/63 40/60
FL-08 Webster (R) 447,266 639,026 70.0 459,529 805,608 57.0 – 13.0 46/54 53/47
CA-41 Lewis (R) 405,790 639,935 63.4 404,103 797,133 50.7 – 12.7 41/56 44/54
FL-12 Ross (R) 461,239 640,096 72.1 500,066 842,199 59.4 – 12.7 45/55 49/50
CA-10 Garamendi (D) 417,008, 638,238 65.3 377,698 714,750 52.8 – 12.5 55/41 65/33
CA-22 McCarthy (R) 426,192 638,514 66.7 432,482 797,084 54.3 – 12.5 33/64 38/60
MD-05 Hoyer (D) 400,668 662,203 60.5 368,667 767,369 48.0 – 12.4 57/41 65/33
NV-01 Berkley (D) 342,987 666,442 51.5 322,853 820,134 39.4 – 12.1 56/41 64/34
CA-13 Stark (D) 244,693 638,708 38.3 174,998 665,318 26.3 – 12.0 67/30 74/24
VA-11 Connelly (D) 430,091 643,582 66.8 434,526 792,095 54.9 – 12.0 45/52 57/42
CA-03 Lungren (R) 474,940 639,374 74.3 488,421 783,317 62.4 – 11.9 41/55 49/49
FL-15 Posey (R) 497,676 639,133 77.9 539,194 813,570 66.3 – 11.6 46/54 48/51

Districts appearing in the 2010 data’s top 25 that weren’t present in 2008 are VA-10, TX-02, FL-08, CA-41, and NV-01; while the other four are driven mostly by Latino growth, the growth in VA-10 (in Washington DC suburbs, more and more centered on once-exurban, now-suburban Loudoun County) is more Asian. These five replace TX-05, AZ-03, TX-06, TX-03, and NJ-07.

This presents a very different picture than the districts ordered according to the actual raw number of white residents lost. That list starts with GA-13 in first, which fell from 295,107 white residents in 2000 to 202,053 in 2010. This is the southern tier of Atlanta’s suburbs and exurbs, which is increasingly becoming a magnet for both Atlanta African-Americans moving outward and northern blacks moving south – in turn driving a lot of white flight, much of which seems to be rearranging itself north of Atlanta, especially in the 9th. The fast-growing 13th is unusual on this list, though; most of the remaining top 10 losers are districts where the overall population is stagnant or going down: MI-12, IL-03, PA-14, OH-10, IN-07, IL-02, CA-13, FL-20, and MO-01. As you’ll see in upcoming charts, blacks are replacing whites in MI-12, Hispanics are replacing whites in IL-03 and FL-20, Asians are replacing whites in CA-13, while in PA-14, OH-10, IN-07, IL-02, and MO-01, everyone is leaving, with whites are leaving the fastest.

Much, much more over the flip…

Here are the districts with the biggest gains among non-Hispanic whites:

District Rep. 2000
white
2000
total
2000
%
2010
white
2010
total
2010
%
%
change
2000
election
2008
election
IL-07 Davis (D) 178,144 653,521 27.3 204,780 638,105 32.1 4.8 83/16 88/12
NY-15 Rangel (D) 106,664 654,355 16.3 133,839 639,873 20.9 4.6 87/7 93/6
NY-11 Clarke (D) 140,595 654,134 21.5 161,819 632,408 25.6 4.1 83/9 91/9
NY-12 Velazquez (D) 150,673 653,346 23.1 180,232 672,358 26.8 3.7 77/15 86/13
GA-05 Lewis (D) 216,674 629,438 34.4 232,507 630,462 36.9 2.4 73/27 79/20
NY-10 Towns (D) 106,746 665,668 16.0 124,232 677,721 18.3 2.3 88/8 91/9
MI-14 Conyers (D) 213,120 662,468 32.2 187,516 550,465 34.1 1.9 81/18 86/14
CA-33 Bass (D) 126,488 638,655 19.8 137,720 637,122 21.6 1.8 83/14 87/12
CA-31 Becerra (D) 62,177 639,248 9.7 69,321 611,336 11.3 1.6 77/19 80/18
SC-06 Clyburn (D) 269,215 669,362 40.2 280,474 682,410 41.1 0.9 58/40 64/35

While you might expect the biggest white gains to be in the exurbs, that’s not the case at all (as suburbs and even exurbs are often becoming a first stopping-point for new immigrants). Instead, most of this list shows regentrification at work, especially in the parts of the outer boroughs of New York City currently under invasion by hipster armies (and also new additions CA-31 and CA-33, evidence of the very recent momentum in the revival of downtown Los Angeles). Similarly, Atlanta is becoming whiter even as its suburbs become much more African-American (which we got a preview of with last year’s mayoral race, where a white candidate nearly won). The odd district out is Detroit-based MI-14, where whites seem to be fleeing at a slower rate than everyone else. Only five additional districts had a percentage gain in white residents, for a total of 15 of all 435: LA-02, HI-02, CA-29, PA-02, and IL-04. (HI-02, NY-14, and CA-29 fall off the top 10 list from 2008, replaced by CA-33, CA-31, and SC-06.)

If you’re wondering which districts had the biggest numeric gains of white residents, rather than changes in the white percentage, here’s where the exurbs come in; the list looks a lot like the list of the biggest gainers altogether, or at least the whiter districts among the biggest gainers. AZ-06 in the Phoenix suburbs (with a large Mormon core in Mesa) had the biggest gain, from 490,359 to 673,881, followed by FL-05, AZ-02, ID-01, UT-03, GA-09, CO-06, SC-01, TX-26, and TX-31.

Now let’s turn to African-American populations:

District Rep. 2000
black
2000
total
2000
%
2010
black
2010
total
2010
%
%
change
2000
election
2008
election
GA-13 Scott (D) 255,455 629,403 40.6 439,119 784,445 56.0 15.4 57/43 71/28
GA-07 Woodall (R) 72,962 630,511 11.6 196,955 903,191 21.8 10.2 31/69 39/60
MI-12 Levin (D) 77,403 662,559 11.7 133,766 636,601 21.0 9.3 61/37 65/33
IL-02 Jackson (D) 403,522 654,078 61.7 414,414 602,758 68.8 7.1 83/17 90/10
MD-05 Hoyer (D) 198,420 662,203 30.0 281,862 767,639 36.7 6.8 57/41 65/33
FL-19 Deutch (D) 37,821 638,503 5.9 91,391 736,419 12.4 6.5 73/27 65/34
MD-02 Ruppersberger (D) 178,860 661,945 27.0 232,194 700,893 33.1 6.1 57/41 60/38
MO-01 Clay (D) 307,715 621,497 49.5 324,711 587,069 55.3 5.8 72/26 80/19
MI-11 McCotter (R) 23,456 662,505 3.5 64,239 695,888 9.2 5.7 47/51 54/45
GA-03 Westmoreland (R) 119,766 630,052 19.0 198,089 817,247 24.2 5.2 33/67 35/64

The list of the top 10 districts in terms of percentage gains among African-Americans is the same 10 as 2008, although with a few changes in the order. The story continues to be African-Americans moving from the cities to the suburbs, especially in the Atlanta area but also Detroit (with Detroiters moving north into the 12th), Chicago (with the metaphorical South Side now starting to extend south well below the city limits and even below I-80), and Washington DC (with Prince George’s County now largely black outside the Beltway, into the 5th, as well as inside in MD-04).

The top 10 gainers by raw numbers has many of the same districts, although also some of the suburban districts that gained a lot of everybody (like TX-22 and NC-09). It starts with GA-13 (from 439K to 629K), followed by GA-07, MD-05, GA-03, TX-22, NC-09, MI-12, FL-19, MD-02, and TX-24.

District Rep. 2000
black
2000
total
2000
%
2010
black
2010
total
2010
%
%
change
2000
election
2008
election
IL-07 Davis (D) 402,714 653,521 61.6 322,730 638,105 50.6 – 11.0 83/16 88/12
GA-05 Lewis (D) 350,940 629,438 55.8 313,302 630,462 49.7 – 6.1 73/27 79/20
LA-02 Richmond (D) 407,138 639,048 63.7 287,077 493,352 58.2 – 5.5 76/22 74/25
CA-09 Lee (D) 164,903 639,426 25.8 131,574 648,766 20.3 – 5.5 79/13 88/10
CA-35 Waters (D) 216,467 638,851 33.9 188,365 662,413 28.4 – 5.4 82/17 84/14
CA-33 Bass (D) 189,855 638,655 29.7 156,406 637,122 24.5 – 5.2 83/14 87/12
NY-11 Clarke (D) 379,017 654,134 57.9 335,828 632,408 53.1 – 4.8 83/9 91/9
PA-02 Fattah (D) 392,293 647,350 60.6 355,849 630,277 56.5 – 4.1 87/12 90/10
NY-15 Rangel (D) 198,915 654,355 30.4 169,460 639,873 26.5 – 3.9 87/7 93/6
TX-18 Jackson-Lee (D) 260,850 651,789 40.0 260,585 720,991 36.1 – 3.9 72/28 77/22

The list of districts with the biggest percentage losses among African-Americans mostly parallels the list of districts with the biggest white gains, where regentrification is changing the complexion (and that it includes the catastrophic regentrification of New Orleans). It also includes several traditionally black districts where the blacks are being replaced mostly by Hispanics: CA-09, CA-35, and TX-18. IL-01 and MD-04 have fallen off the list from 2008, replaced by PA-02 and TX-18.

The top 10 by raw numbers of losses among African-Americans is led (perhaps no surprise) by LA-02, which went from 407K to 287K, followed by MI-13, IL-07, MI-14, IL-01, NY-11, GA-05, PA-02, CA-33, CA-09. Interestingly, because New Orleans in general lost so many people, the 2nd still significantly trails IL-07 in terms of the percentage loss.

Now let’s look at Asian-American populations:

District Rep. 2000
Asian
2000
total
2000
%
2010
Asian
2010
total
2010
%
%
change
2000
election
2008
election
NY-05 Ackerman (D) 159,491 654,253 24.4 218,275 670,130 32.3 8.2 67/30 63/36
CA-13 Stark (D) 179,681 638,708 28.1 239,434 665,318 36.0 7.9 67/30 74/24
CA-15 Honda (D) 187,198 639,090 29.3 246,832 677,605 36.4 7.1 60/36 68/30
CA-48 Campbell (R) 80,095 638,848 12.5 137,094 727,833 18.8 6.3 40/58 49/49
NJ-12 Holt (D) 58,748 647,253 9.1 104,996 701,881 15.0 5.9 56/40 58/41
VA-10 Wolf (R) 41,846 643,714 6.5 107,583 869,437 12.4 5.9 41/56 53/46
WA-08 Reichert (R) 50,745 655,029 7.7 108,807 810,754 13.4 5.7 49/47 57/42
CA-11 McNerney (D) 55,895 639,625 8.7 114,217 796,753 14.3 5.6 45/53 54/44
CA-14 Eshoo (D) 102,430 639,953 16.0 140,789 653,935 21.5 5.5 62/34 73/25
CA-03 Lungren (R) 36,970 639,374 5.8 84,384 783,317 10.8 5.0 41/55 49/49

The Asian gains, percentagewise, are concentrated in the Bay Area, although the #1 gainer is NY-05, where the majority of the population is in NE Queens. Flushing is now thoroughly Asian, and that’s starting to spill over into Bayside (of Archie Bunker and Jerky Boys fame). That’s followed by the East Bay’s CA-13, the first non-Hawaiian district to have an Asian plurality. The rest of the list is mostly affluent suburban areas which are starting to become light-blue at the presidential level even as they keep Republicans in the House; will declining white populations in these districts be enough to push them over the edge?

NY-06, NJ-07, and TX-22 have fallen off the list from 2008, replaced by NJ-12, WA-08, and CA-03. If you’re curious about the top 10 by raw numbers gain, it mostly overlaps the above list, although with some of the all-purpose growth engines (like NV-03) on there too: NV-03, VA-10, TX-22, CA-13, CA-15, NY-05, CA-11, WA-08, CA-48, and VA-11.

Only twelve districts have experienced any drops in the Asian population by percentage, and most of the drops are small, so there’s not much need for a chart for them; HI-02 (28.0% to 24.9%) had the most significant change, partly because of an influx of white retirees but more so because the big rise in “Two or more” as a common choice in Hawaii. That’s followed mostly by districts with rapidly growing Latino populations:  HI-01, CA-20, CA-18, IL-02, TX-29, FL-17, CA-51, TX-30, CA-35, NY-16, and TX-16. Only six districts had drops in raw numbers of Asians: IL-02, MI-13, TX-29, FL-17, IL-05, and IL-01.

Finally, let’s look at Hispanics:

District Rep. 2000
Hispanic
2000
total
2000
%
2010
Hispanic
2010
total
2010
%
%
change
2000
election
2008
election
IL-03 Lipinski (D) 139,268 653,292 21.3 225,298 663,381 34.0 12.6 58/40 64/35
CA-25 McKeon (R) 174,193 638,768 27.3 330,711 844,320 39.2 11.9 42/56 49/48
CA-41 Lewis (R) 150,076 639,935 23.5 277,907 797,133 34.9 11.4 41/56 44/54
CA-43 Baca (D) 371,501 637,764 58.3 510,693 735,581 69.4 11.2 64/34 68/30
CA-22 McCarthy (R) 133,571 638,514 20.9 255,209 797,084 32.0 11.1 33/64 38/60
CA-18 Cardoza (D) 268,586 639,004 42.0 381,039 723,607 52.7 10.6 53/44 59/39
FL-20 Wasserman Schultz (D) 132,575 639,795 20.7 216,352 691,727 31.2 10.6 69/31 63/36
TX-10 McCaul (R) 122,894 651,523 18.9 282,641 981,367 28.8 9.9 34/67 44/55
TX-29 Green (D) 430,980 651,405 66.2 514,861 677,032 76.0 9.9 57/43 62/38
TX-02 Poe (R) 82,578 651,605 12.7 176,196 782,375 22.5 9.8 37/63 40/60

As in 2008, the biggest gainer is IL-03, covering Chicago’s Southwest Side. (I’m truly not sure if people are moving from the depopulating, closer-in IL-04 to the slightly more spacious 3rd, or if the 3rd is becoming the destination of choice for new émigrés; maybe Chicagoans in the comments might shed some insight into that.) And in second place continues to be CA-25, a Republican-held district linking LA suburbs like Santa Clarita with high desert outposts like Lancaster. Interestingly, the list is pretty evenly divided by Democratic-held districts that already were substantially Hispanic and just got much more so (like TX-29 and CA-43), and Republican-held suburban districts where voting patterns haven’t caught up with the Hispanic population (and given the number of kids and non-citizens among those numbers, where it’ll take many more years for that catching up to happen).

There’s been a lot of churn among districts since 2008, perhaps a result of the difficulty of estimating Hispanic populations: districts falling off the top 10 list since 2008 are TX-32, TX-05, AZ-04, and CA-52. These have been replaced by CA-43, CA-18, TX-10, and TX-02.

The top 10 in raw numbers gain doesn’t correlate directly with districts that had biggest white percentage drops or Hispanic percentage gains. Instead, the list pretty thoroughly overlaps with the list of the top population gainers overall; while the Hispanic percentage went upwards in all of those districts, many of these districts were ones with a large Hispanic share already: case in point, the biggest gainer, FL-25 in Miami’s westernmost suburbs (which went from 398,986 to 577,998). That’s followed by CA-45 (which I certainly would have expected to see in the top 10 Hispanic percentage changes, but where the share increased “only” by 7.2%), TX-28, TX-10, CA-25, AZ-07, TX-15, CA-44, TX-23, and CA-43.

One remarkable thing about Hispanic growth is that it’s present almost everywhere. Only six districts experienced any drops in the Hispanic percentage whatsoever, all in urban districts where regentrification is occurring: starting with NY-12 (48.7% to 44.6%), followed by CA-31, NY-15, CA-29, IL-04, and NY-14. Those same six districts were the only ones to report drops in raw numbers, either: IL-04 had the biggest loss (from 486,839 to 442,018), CA-31, NY-12, NY-15, CA-29, and NY-14.

Where Will We See New VRA Districts?

It’s a subject of much debate (and some confusion), and it’ll remain at least somewhat opaque until the Obama Department of Justice weighs in, but the question still is: Where will we see new majority-minority districts created in order to comply with the Voting Rights Act? I invite you to list any states – and especially regions of those states – where you think maj-min districts could get drawn, whether by state legislatures, by the DoJ, or in the end, by the courts. Bonus points for anyone who actually draws any proposed VRA districts.

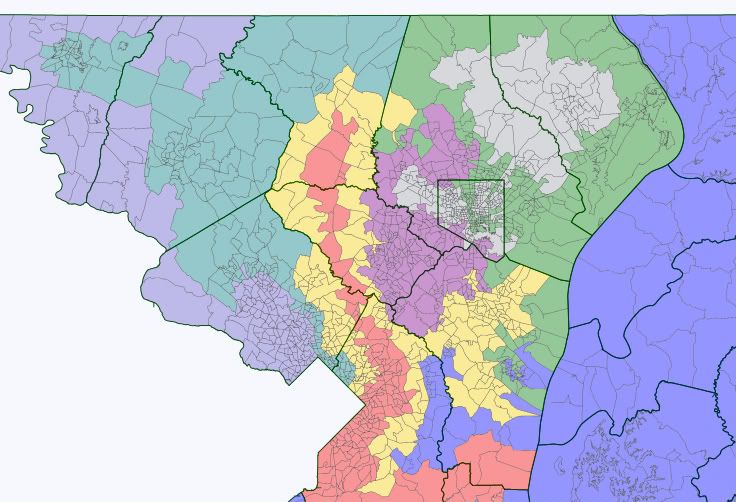
8-0 Maryland

This map is extremely ugly, but it gets the job done.  The main reason for its ugliness is the VRA retrogression rule.  So, in order to use white Democrats to our advantage, almost all the whites in the VRA-protected 4th and 7th districts are Republicans.  Likewise, in the other districts, almost all the Democrats are white.  If not for the VRA, we could have made a much more compact map with a nearly invincible 8-0 delegation.

The main goals here were:

1. Make an Obama district for Kratovil.

2. Knock out Bartlett and Harris.

3. Make almost all the other districts 60% Obama.

Here’s the map:

Photobucket

District 1 (blue): Frank Kratovil?

It keeps the Eastern Shore intact, but sheds the conservative areas in Northern Maryland.  It uses water contiguity to grab liberal areas of Annapolis, as well as parts of mid and southern Maryland.  The current PVI is R+13.  It’s now like R+4 or 5, which should be no problem for Kratovil, barring another 2010.  It also manages to move Harris into one of the other districts.

Obama: 50.5%, McCain: 48% (previously 58-40 McCain)

White: 68.9%, Black: 22.3%

VAP: White: 71.5%%, Black: 21.3%

Likely D for Kratovil, Lean R otherwise

District 2 (green): Dutch Ruppersberger/Andy Harris

The district is weakened considerably from its current D+7 to around D+2, but Harris has no chance here, considering he lost in an R+13 district in 2008.  In Congressional races between 2006-2008, the Democrat actually won an average of 59.7%.  Parts of Baltimore County are more Democratic than the Obama-McCain numbers show.  Some of the people actually vote for Democrats, but are notorious racists and McCain mopped up in this area.  For example, in Edgemere, all 3 precincts went solidly for McCain, but the congressional Democrat won in both 2006 and 2008.  So, Ruppersberger should be fine in this district, barring another 2010.   As a side note, John Sarbanes probably lives here as well, but would likely opt to run in the new 3rd.

Obama: 54.8%, McCain: 42.8% (previously 60-38 Obama)

White: 68.5%, Black: 19.0%

VAP: White: 71.8%, Black: 17.1%

Likely D vs. Harris, Lean D otherwise

District 8 (light purple): Chris Van Hollen

This stretches north and adds northwest Maryland, as part of the plan to knock out Bartlett.  It goes down from D+21 to about D+7, but Van Hollen is definitely safe.

Obama: 60.5%, McCain: 37.9 (previously 74-25 Obama)

White: 65.1%, Hispanic: 12.7%, Asian: 10.8%

VAP: White: 67.0%, Hispanic: 11.7%, Asian: 10.9%

Safe D

Central Maryland:

Photobucket

District 3 (purple): John Sarbanes

Not too much to say here.  Its PVI of D+6 probably stays about the same.

Obama: 59.8%, McCain: 38.2% (previously 59-39 Obama)

White: 57.9%, Black: 24.2%

VAP: White: 61.0%, Black: 23.0%

Safe D

District 4 (red): Donna Edwards

This black-majority district extends far north and south to take in as many Republicans as possible.  Might a lose a few points off its D+31 rating, but it’s not like that would make any difference.  It barely meets retrogression requirements by staying at 56.8% black.

Obama: 76.5%, McCain: 22.6% (previously 85-14 Obama)

Black: 56.8%, White: 30.7%

VAP: Black: 56.4%, White: 32.2%

Safe D

District 5 (yellow): Steny Hoyer

The used-condom district includes liberal areas in Montgomery, Prince George, and Anne Arundel Counties, as well as Republican areas from wrapping around the 4th district.  Hoyer doesn’t live here, but he basically lives in DC anyway, so he would just run here.  It may be weakened a bit from its current D+11, but he’s still safe.

Obama: 60.0%, McCain: 38.3% (previously 65-33 Obama)

White: 54.9%, Black: 24.6%, Hispanic: 11.4%

VAP: White: 57.1%, Black: 24.0%, Hispanic: 10.1%

Safe D

District 6 (teal): Roscoe Bartlett

Bartlett is technically the incumbent, but has pretty much no chance here.  His current district is R+13, but this is D+6 or 7.  We’ll still probably have to run a minor campaign the first time to ensure he doesn’t become a Republican Chet Edwards, but otherwise we’re safe.  Someone who knows more about Maryland politics could suggest a possible Dem candidate here.

Obama: 60.2%, McCain: 38.1% (previously 58-40 McCain)

White: 57.1%, Black: 17.2%, Hispanic: 15.8%

VAP: White: 59.6%, Black: 17.0%, Hispanic: 14.5%

Likely D vs. Bartlett in 2012, Safe D otherwise

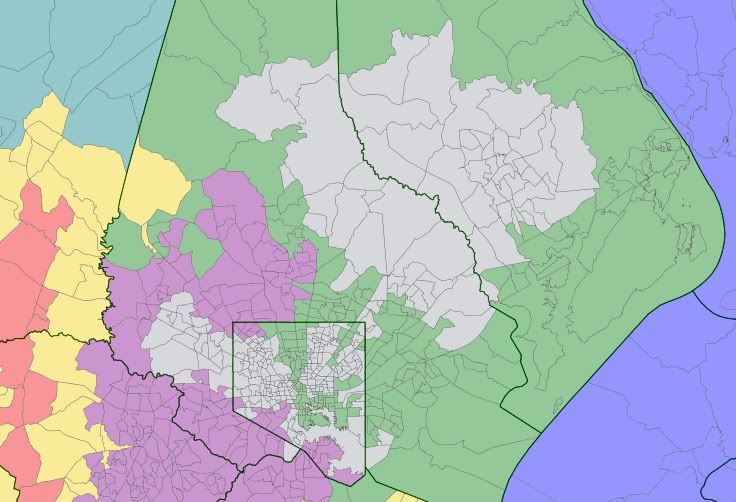
Baltimore Area Close-up:

Photobucket

District 7 (gray): Elijah Cummings

Perhaps the ugliest district on this map, this includes black areas in Baltimore City, as well as deep red parts of Baltimore and Harford Counties.  It probably stays at around D+25.

Obama: 71.5%, McCain: 27.1% (previously 79-20 Obama)

Black: 59.1%, White: 34.5%

VAP: Black: 57.9%, White: 36.3%

Safe D

CA :: Cook Uncooked, Part Deux

The latest release of the Political Data Inc.  redistricting package allows us to look at the 2010 election results by contest.  So, using the congressional results from last election cycle I was able to construct election results as if the Cook plan had been implemented.

An obvious caveat is that these elections never happened.  Incumbents who had an easy ride in the existing lines would be fighting a different battle.  But it’s also true that the challengers – many of which were unimpressive and unfunded – would be cut from a different mold in a newly competitive seat.

Cook Uncooked Part Deux

Land of Enchantment, Land of Redistricting

The daily digest from the other day about the Democrats' plans for New Mexico got me thinking about creating my own New Mexico map. My goals in this map were very simple, make NM-01 more Democratic while shoring up Steve Pearce in the south (making Pearce happy with the map makes it harder for Republicans to reject it, especially given that there is a real risk that a court-drawn map makes NM-02 more Democratic, and Pearce is going to have a hard time winning a district that votes for Obama). But having said that, these caveats apply:


1. This map is probably not what a court would draw

2. It's better for Democrats than Republicans (although as I mentioned before it strengthens Steve Pearce, and that probably would at least give Pearce

3. The partisan percentages are only rough estimations, as I had to use the election data from 2008 (with 2000 population) compared to using the actual 2010 census data, as such my partisan numbers might be off somewhat (though probably not enough to make a difference)

Even with these caveats in mind, I still think there is a good chance that Democrats at least try to pass this type of map and try to get Martinez to go along with it by making Steve Pearce happy the maps below the fold:

Format: New stats (old stats)


NM-01

Pop: 685,912 (-481 dev.)

Democraphics

White: 39.8%/44.6% VAP (41.8%/46.7% VAP)
Hispanic: 47.2%/43% VAP (48.2%/43.7% VAP)
Native American: 6.6%/6.3% VAP (3.6%/3.5% VAP)

Partisanship: Obama 60.8% (59.6%)/McCain 37.8% (39.1%)

Notes: The first district gets a bit of a make-over here, it sheds all of Torrance County and loses most of Valencia County (while retaining a reservation). Really, all I've done to NM-01 is to shift it to the west, it loses the very northeastern part of Bernalillo County to the second district, while in exchange taking the western parts of Bernalillo county and absorbing Cibola County and the reservations in McKinley County.


NM-02

Pop:  686,837 (dev. +444)

Demographics

White: 42.1%/47.4% VAP (40%/45.2% VAP)
Hispanic: 52.6%/47.4% VAP (51.9%/47% VAP)
Native American: 1.7%/1.6% VAP (4.5%/4.3% VAP)

Partisanship: Obama 47.5% (48.5%)/McCain 51.1% (50.1%)

Notes: So you'll notice that the second district has become a touch whiter and more Hispanic, that's because NM-01 has absored most of reservations that were here before. Another big thing that happens here is that it sheds the more heavily Democratic northwestern part of Bernalillo County and takes in the more Republican northeastern part, as well as taking the town of Edgewood, taking all of Torrance County, and nearly all of Valencia county. To make the population as close as possible, it was also necessary for the second district to take small parts of San Miguel county. The major difference happen by trading some populations between CD-01 and CD-02. This is a district that Steve Pearce would be quite happy with.


NM-03

Pop: 686,430 (dev. +37)

Demographics

White: 39.6%/43.9% VAP (39.6%/44% VAP)
Hispanic: 39.1%/36.4% VAP (39.0%/36.3%)
Native American: 17.3%/15.9% VAP (17.3%/16% VAP)

Partisanship: Obama 61% (60.9%)/McCain 37.8% (37.9%)

Notes: Very little changes about NM-03, it sheds a little population to NM-02 and NM-01 for population purposes, but otherwise its core completely.

My first stab at Congressional Redistricting in Florida (Part 2: Central Florida)

Tampa Bay Area

FL-5 (Rep. Richard Nugent, R-Spring Hill), Yellow

It now covers just 3 counties instead of all or parts of 8 counties in its current form (removed from Lake, Levy, Marion, Polk and Sumter counties), and is designed as an exurban Tampa seat.  It takes most of Citrus and Pasco counties (minus Port Richey and New Port Richey), plus all of Hernando County (Nugent’s political base, as he’s formerly the Sheriff there).  Safe Republican.  

FL-9 (Rep. Gus Bilirakis, R-Palm Harbor), Cyan

This district is minimally altered from its present form, except that it loses Clearwater and parts of western Pasco County.  It also exchanges some Tampa suburbs with FL-11 and FL-12.  Bilirakis’ home base of Palm Harbor and northern Pinellas County, however, is still here.  Safe Republican.

FL-10 (Rep. C.W. Bill Young, R-Indian Shores), Pink

It gains Clearwater from FL-9, and black parts of St. Peterspurg from FL-11; but loses Dunedin and parts of Palm Harbor to FL-9.  Still totally within Pinellas County, and is the most competitive district in the Tampa Bay area.  Lean Republican with Young, Toss-Up/Tilt Democratic in open seat scenario.


FL-11 (Rep. Kathy Castor, D-Tampa), Light Green

This is the most drastically altered district in the Tampa Bay area, as it is now confined within Hillsborough County.  It loses its arms into Manatee and Pinellas counties, and gains some more conservative suburbs to the east.  It has a lower black percentage but a higher Hispanic percentage than its previous form.  Still plurality white (and 52% white voting age population/VAP).  Castor should be fine if she survives her initial election in this district.  Leans Democratic.

Central Florida

FL-8 (Rep. Daniel Webster, R-Orlando), Lavender

This district is recast to become solely within metro Orlando (Removed from Lake and Marion counties), it also loses its Osceola County portion to FL-12.  However, it gained southeastern Seminole County (Altamonte Springs and Longwood etc.) and eastern Orange County from FL-24, plus bits of FL-3 and FL-7.   As it subsumes most of the conservative parts of Orange County with a slice of traditionally GOP Seminole County attached to it, Webster should be fine here, although the growth of Hispanic population could make the district more interesting towards the end of the decade.  Likely Republican.

FL-12 (Rep. Dennis Ross, R-Lakeland), Baby Blue

Polk County (formerly split with FL-5 and FL-15) is now entirely within this district.  It loses the Hillsborough County portion to FL-9 and FL-13.  It is less white and more Hispanic (about 22%) than its previous incarnation, thanks to the inclusion of parts of Kissimmee.  For now, Ross should be fine, but it seems likely that this district will undergo  demographic changes similar to FL-8 down the road.  Likely Republican.

FL-15 (Rep. Bill Posey, R-Rockledge), Orange

This district now contains all of Brevard County (previously split with FL-24) and most of rural, less Hispanic portions of Osceola County.  It is removed from staunchly GOP Indian River County and takes most of Okeechobee County that still has hints of local conservative Democratic heritage (but votes GOP in federal races).  Posey should be fine here.  Likely Republican.


FL-24 (Rep. Sandy Adams, R-Orlando), Deep Violet

This district now contains most of Seminole County (Oviedo and Sanford etc.) and virtually all of Volusia County, but removed from Brevard and Orange Counties.  Seminole’s GOP heritage should give it a GOP tilt, but a moderate Democrat from Volusia should be competitive here in neutral or Dem-friendly years.  Toss Up/Tilt-Republican.

FL-27 (NEW SEAT, Sky Blue)

The Democratic votes freed up from FL-3 and FL-8 are the basis of this plurality Hispanic (about 33% of VAP) district (plurality white in VAP at about 38%, with 22% black VAP).  It consists of downtown Orlando, black areas in western Orange County, Hispanic portions of east-central and southern Orange County, and the adjoining heavily Hispanic portions of Osceola county (Kissimmee and environs).  Should be a perfect district for State Reps. Darren Soto or Scott Randolph, both Orlando Democrats, if they want promotion to the Congress.  Orlando Mayor Buddy Dyer is another solid candidate for this seat.  Finally, polarizing but wealthy former Rep. Alan Grayson may also want to run here if he wants to return to Congress.  A Puerto Rican Republican, however, can make this race competitive.  Lean Democratic.

My partisan count for these seats are 5R, 2D, 2 swing.

Overall partisan count so far are 10R, 3D, 2 swing.

Southwest Florida, Heartland and Heartlands seats (FL-13, 14, 16 and 26) up next.

31, Male, Independent, MS-02 (Hometown FL-19)