Other evidence that Illinois is very swingy: caution needed before we overreach with a 14-4 map

I am as partisan a Democrat as most people on this website.  As an Illinoisan, I am dismayed that my state elected five freshmen Republicans last fall but very grateful (for a whole lot of other reasons besides redistricting) that Governor Quinn just managed to hold on.  Otherwise we would be looking at another “incumbent protection” map, which in a state that just elected five freshmen GOP congressmen last fall, would be tantamount to a GOP gerrymander.

Various would-be mappers such as Silverspring have proposed 14-4 maps that would make Delay and Phil Burton proud.  But many of these maps go by Obama 2008 data, which is a fundamentally flawed data set to be basing districts on in my very educated opinion.  On the surface maps provided by such places as usaelection.org, you can see counties like Kendall and Grundy and Stephenson and McHenry (just to name a few) that wound up in Obama’s column in 2008.  No seasoned Democratic politician in Illinois would ever call these counties that are Democratic by any means.  Perhaps as suburban/exurban areas of McHenry and Kendall start to fill up and become more swingy, those counties might change.

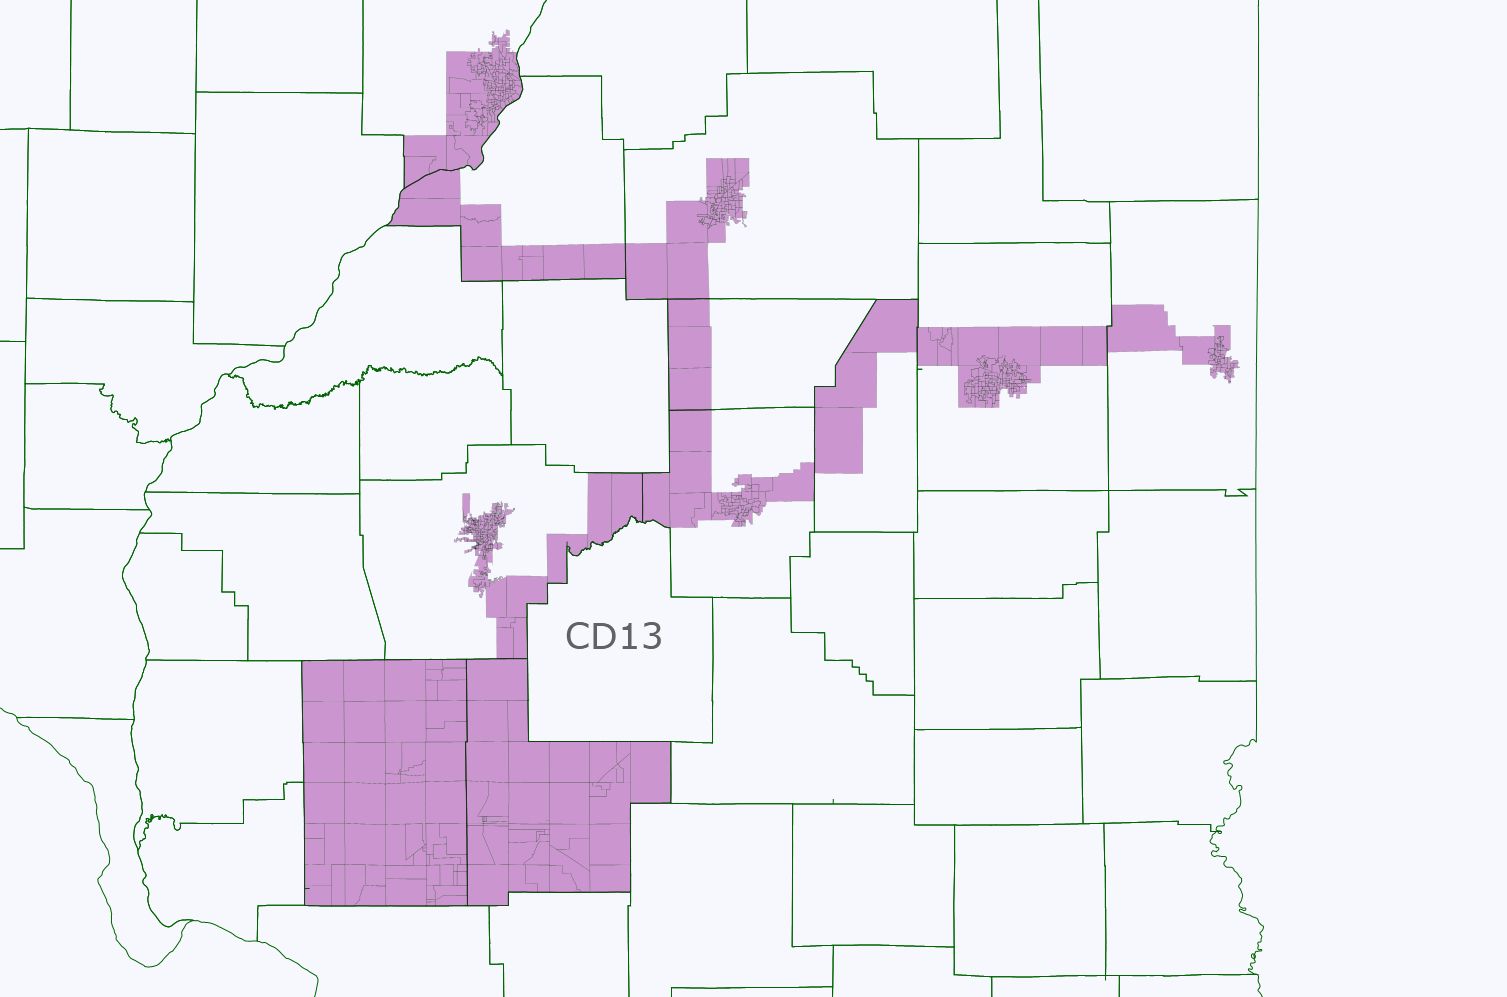
This diary, however, focuses on a slightly different problem with the Obama 2008 data when compared against Kerry 2004 downstate (where it models pretty accurately – I understand the concerns people have about Cook and Dupage which may be a bit bluer now in 2011 but that trend is not noticeable anywhere outside of Chicagoland).  The problem is this: several of the downstate cities that mappers such as myself and Silver Spring and others count on to create as many Democratic-leaning districts as we can, aren’t really all that blue to begin with.  In other cases, such as Decatur and Urbana-Champaign, they are quite blue, but turnout is a problem.  Follow me across the jump where I demonstrate this using a new district I have been creating in most of my maps – a new 13th which disappears in Chicagoland and reappears as a vacant downstate cities seat.

Photobucket

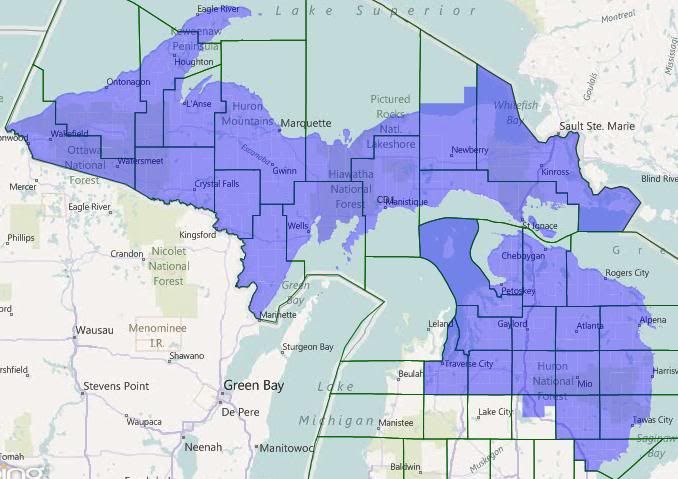
On first glance this district ought to be safely Democratic, even in 2004.  It isn’t entirely so.  Believe it or not, but Bush got 49% of the vote in this district (and the narrow tendrils connecting the various cities together only amount to about 30k residents so that isn’t the problem so much).  The district is good enough for my standards, though, because Obama did get 59%.  By Cook PVI it is a D+4, perhaps not completely safe from a meltdown of 2010 proportions but most Republicans cannot win in districts any more Democratic than this, and other than Tim Johnson, there is no sitting Republican congressman from this area of the state who could have cross-over appeal.  Even then, Tim Johnson is not a Mark Kirk, and it would take a Mark Kirk for the GOP to win this seat.  So I think it is reasonably safe Team Blue, probably as safe as can be drawn in fact.

In most other parts of the country, a 51% Kerry, 59% Obama seat would be considered safely Democratic.  But again, pay attention to that swing.  At 8% it is a bit larger than nationwide if not as extreme as the 10-12% swings found everywhere in Chicagoland.  When one looks at the cities, you see what I am discussing (with the order of the numbers being Dem-Rep):

Peoria: 28,542-18,536 in 2008; 24,795-22,398 in 2004

Danville: about 8,000 – about 4,500 in 2008; about 7,500-about 5,000 in 2004 (Does anybody know where I can find Danville or Vermillion precinct numbers; their elections website is among the most unhelpful I have ever experienced?)  I calculated this by assuming, for the sake of argument, that the out-city areas of Vermillion were equally as red as the out-city areas of Champaign County next door but I could be slightly off in either direction.

Champaign-Urbana: 32,618-13,408 in 2008; 28,814-17,222 in 2004

Bloomington: 17,578-15,167 in 2008; 13,628-17,154 in 2004

Normal: 12,257-9,197 in 2008; 9,555-10,570 in 2004

Springfield: 32,463-24,019 in 2008; 24,650-28,971 in 2004

I am progressing slower than normal with my maps because it has occurred to me that there are really three scenarios that have to be taken into consideration.  Scenario A: a tactically conservative but aggressive in every other sense map that would lock down 13 Kerry districts (Rockford going together with Rock Island; the 14th going into downtown Joliet, etc.).  Scenario B: a more risky 12-4-2 map that would put Joliet in a swing seat as well as Melissa Bean in another one in the north part of Chicagoland.  Scenario C finally would aim for a 12-5-1 which would shore up Melissa Bean while pushing a Kane seat into Rockford, which would then make the downstate cities seat very swingish (voted for Bush 53-47 then flipped to Obama 55-45).

Personally I would opt for Scenario A if I were drawing the map and not try to do a 14-4.  Unfortunately with Citizens United, the money game is even more unstacked in our disfavor.  Our ticket should get a bump with Obama on the top of the ticket, but then what about the remaining four elections in the decade-long period that any map would be operative?  Finally, another reason to be aggressive when possible but tactically conservative, drawing maps more according to Kerry or 2010 congressional data rather than Obama: Illinois is notorious for split-ticket voters.  In the weeds work I have been doing up in Chicago suburbia, I cannot tell you how often a precinct that voted 60-40 for Obama voted also in the same election for Biggert or Roskam.  And that was in 2008!  Chicago suburbia is full of independents and moderates.  

That being said, it is possible to draw 13 Kerry seats to only 5 Bush seats, and if 13-5 were achieved in 2012, that would still mean -6 GOP, +5 Dem.  That is nothing to snuff at.

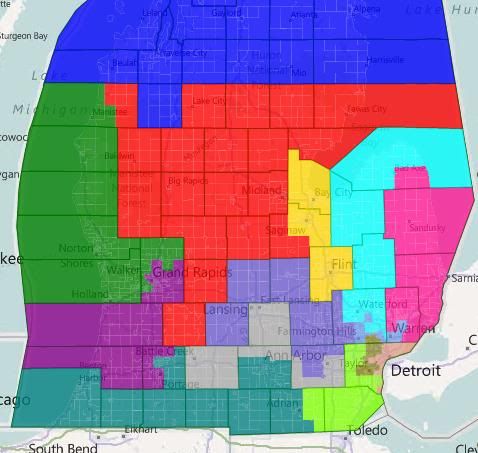
The Knollenberg Project: Michigan Congressional Redistricting

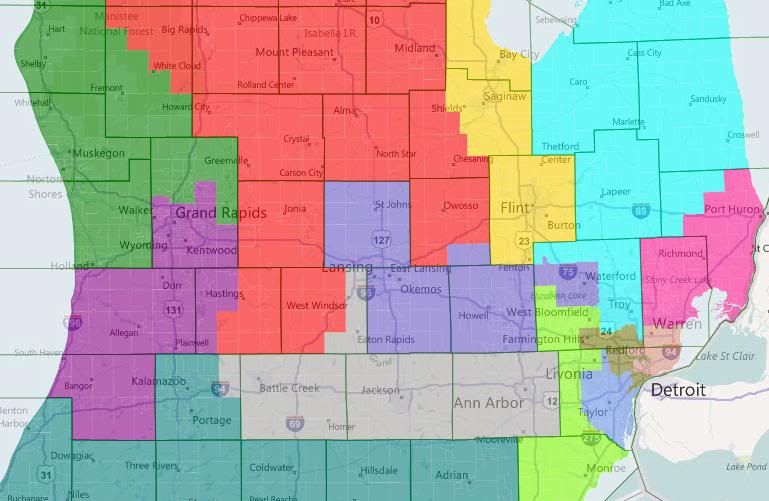
Conventional wisdom regarding Michigan’s congressional redistricting process to this point has looked towards the state Republicans dealing with Michigan’s lost seat by consolidating Sander Levin and Gary Peters into a single district. Two relatively new sources of information are challenging that wisdom.

First, the actual census numbers came out. And the beating that Detroit took over the last ten years was a lot worse than generally thought. As best as I can tell, it’s no longer possible to draw two majority-black congressional districts in Wayne County. Instead, whichever district is centered on western Detroit is going to have to crossover into southern Oakland County to pick up, at the very least, the city of Southfield. Which suggests the option of having that district scoop up as many white Oakland County Democrats as it can, since it’s in the neighborhood anyway. Which in turn suggests that the relevant pairing is going to be Levin-Conyers, not Levin-Peters.

Second, per a recent digest, state representative Marty Knollenbeg, a member of the redistricting committee and son of Peter’s predecessor, has moved from talking about challenging Peters in 2012 to actually starting the machinery of his campaign, in the form of an exploratory committee. That suggest that Knollenberg thinks Peters (or at least the bulk of Peters’ district) is going to be in such a form that it would be amenable to electing a Republican. Which again cuts against the Levin-Peters pairing.

So: If there’s a district for Knollenberg, some other district is still geting cut. Maintaining two VRA black districts requires one of the Detroit districts to cut into Levin’s Twelfth. Putting that together, perhaps the Twelfth is the district to go? What would that look like?

I explore three possible solutions after the jump.

Common Threads

All three of my solutions have six districts that are identical: MI-01, MI-05, MI-09, MI-10, MI-13, and MI-14. The new MI-12, which is now the designation for Dingell’s district, stays more or less in place for all three maps also. Here’s the process by which those six districts were built.

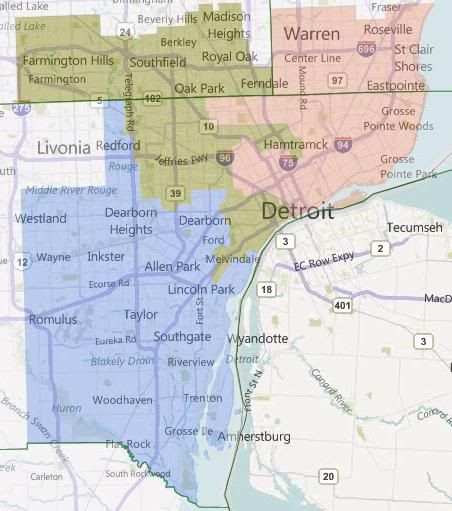
First, the inner Metro Detroit districts. Basically, all three of these maps are looking at scenarios where MI-14, based in western Detroit, takes in the western (Oakland County) portion of the dismantled MI-12, while MI-13, based in eastern Detroit, takes in the eastern (Macomb County) portion of the dismantled MI-12.

The particular version stretches MI-13 to its breaking point — it’s almost literally 50%+1 black by VAP. (It’s 50%+218.) It takes in heavily Democratic Warren, Eastpointe, and Roseville, along with not quite so Democratic St. Clair Shores. (I’m realizing now that I should look at scenarios where St. Clair Shores is in MI-10.) It’s forced into taking the Grosse Points and Harper Woods, and after that it can’t take any more non-black population. That’s why MI-14 has the odd arms to take in white Hamtramck and hispanic southern Detroit.

Besides those arms, MI-14 takes in the rest of Detroit, and then moves north in Oakland County, taking in Southfield for its black population, and the spreading east and west to take in the most Democratic parts of southeastern Oakland. It can’t quite do this cleanly, the little city of Clawson ends up split between it and the undrawn MI-09.

MI-12, having been dismantled, is then reborn as the designation for Dingell’s district. It takes in the most Democratic of the Wayne County suburbs, leaving the western tier of townships for McCotter (or at least he hopes so). Note that dismantling and relocating MI-12 in this way prevents Dingell from hanging on to Ann Arbor, which is going to be problematic for the Republicans later.

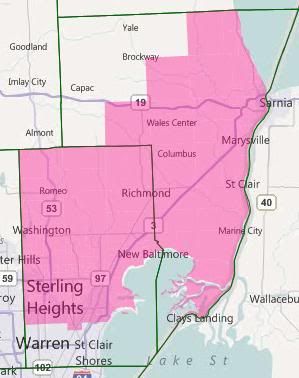
Then MI-10. It takes up the rest of Macomb, and then fills its balance by taking in as much of St. Clair County as it can. There’s been significant population growth in St. Clair and northern Macomb. This, combined with the fact that MI-13 isn’t taking in all of the old MI-12’s portion of Macomb County, causes Candice Miller to lose most of her Thumb Counties.

Obama won Macomb County by about a 36k margin. Warren by itself accounts for about 13k of that margin. The rest of MI-13’s part of Macomb County is about another 15k. That means that the rest of the county went for Obama by about an 8k margin, out of about 285k total votes (for the rest of the county.) Obama won the part of St. Clair County that’s in this district by about 3k out of 72k. That adds up to Obama winning this district by 11k out of 285k total votes. That’s not going to be as comfortable as for Candice Miller as her current R+5 district, but it should be manageable.

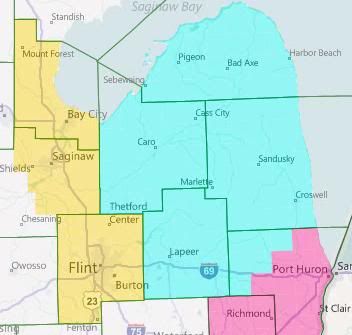
And now the Thumb. The Thumb Counties proper are fairly Republican, so I’m assigning them to our rebuilt MI-09 (which will also be taking in a good part of Oakland, as you’ll see later). That implies the assigned shape for MI-05: Gennessee and Bay Counties plus the most Democratic parts of Saginaw County that will fit.

Which in turn implies this shape for MI-01. Having been kicked out of Bay County by MI-05, it needs to pick up population somewhere, and adding Republican Grand Traverse County to it will help anchor it for Benishek. One goal going forward is to keep that move from harming Dave Camp too much.

Okay, so with those 5-6 district set in place, what sort of options do we have for the others?

Interlude

The current Republican map of Michigan has some very finely wrought pieces. In particular, they went out of their way to make sure that most of Michigan’s Democratic-leaning cities in the outstate ended up in separate districts where they could be drowned out by rural and exurban voters. The cases in point: Muskegon in MI-02, Grand Rapids in MI-03, Kalamazoo in MI-06, Lansing in MI-08. MI-07 was such a case when it was created, keeping Battle Creek safely away from more Democrats (Jackson, so far as I can tell, is swing-tilt-Republican); but Lansing’s western suburbs in Eaton County have blued significantly over the last decade. They then decided that Flint-Saginaw-Bay City was too dangerous to crack, and also packed in Ann Arbor with the southern Detroit suburbs.

This analysis is important because, while we’ve maintained the packed district for Flint, we weren’t able to maintain the Ann Arbor to Dearborn packing. And none of the outstate districts can afford to take on Ann Arbor in addition to the existing Democratic city that they’re warding. The upshot of this is that if Knollenberg is successful at getting a seat made for himself, and if I’m right that Levin’s is then the disappeared seat, then Knollenberg is going to be creating a seat for himself at some other Republican’s expense.

Said another way, the current breakdown of the delegation is nine Republicans and six Democrats. One seat needs to go away; the Republicans obviously want it to be a Democratic one. In addition, Knollenberg is trying to flip a Democratic seat into a Republican one. That would make the delegation 10-4. I submit that it’s impossible to make a map of Michigan with only four districts that are Democratic. 9-5 is the GOP max. Since there are 9 Republicans already, adding another one to the delegation necessarily involves booting an incumbent.

In all three of my sample maps below, that person is Tim Walberg. This is because he is (1) a freshman who is (2) out of step with his swing district which can (3) be made into another MI-05-esque medium-sized-city Dem vote sink. The three options are named for the cities that the new MI-07 covers.

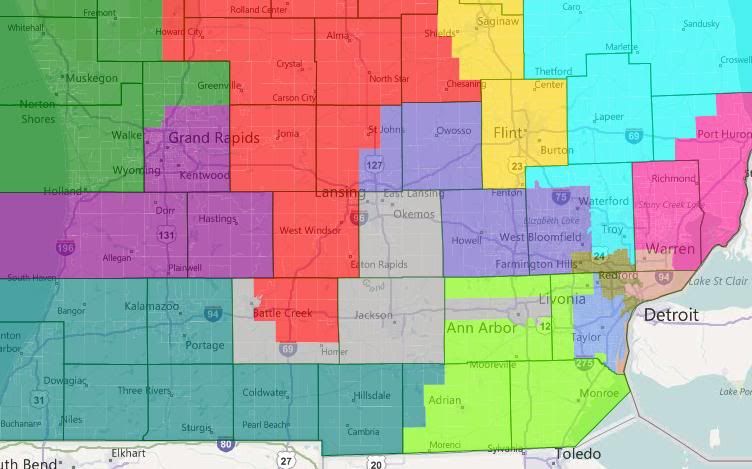
Option 1 — Ann Arbor, Battle Creek, Delta Township

Option 1 has MI-07 cover central Michigan from Ann Arbor to Battle Creek, with an arm reaching out to take in the western suburbs of Lansing.

In the west, MI-02 subsumes deep blue Muskegon and the swingy coastal counties with deep red Ottawa and north Kent. (Although not picture, MI-02 takes in all of the coastal counties up to Leelanau. MI-04 has the interior counties that aren’t in MI-01.) MI-03 takes a third of a turn clockwise, dropping Ionia and most of Barry to grab Allegan and Van Buren. Camp’s MI-04 replaces its loss of Republican Grand Traverse with very Republican Ionia and Barry.

Upton’s MI-06 now stretches across southern Michigan, where he picks up an unwelcome constituent in Tim Walberg. Rogers in MI-08 is left to hold down more-or-less the same district that he has now.

Finally, there are the two metro Detroit districts. Knollenberg here adds the northwestern third or so of Oakland County to the Thumb Counties to make the new MI-09, resulting in a reasonably Republican district, even if he’s still holding onto Pontiac. McCotter actually gets shored up here, I think. He picks up Democratic West Bloomfield but loses the most Democratic parts of his current district, which I think balances out in his favor. He also gains Monroe County, which I’m under the impression is swing or lean-Republican these days.

Overall, I think this is the best of the three options for the Republicans. One problem is that having two Oakland-Wayne districts probably violates Michigan’s redistricting standards. That’s more of a political problem than a legal one, though.

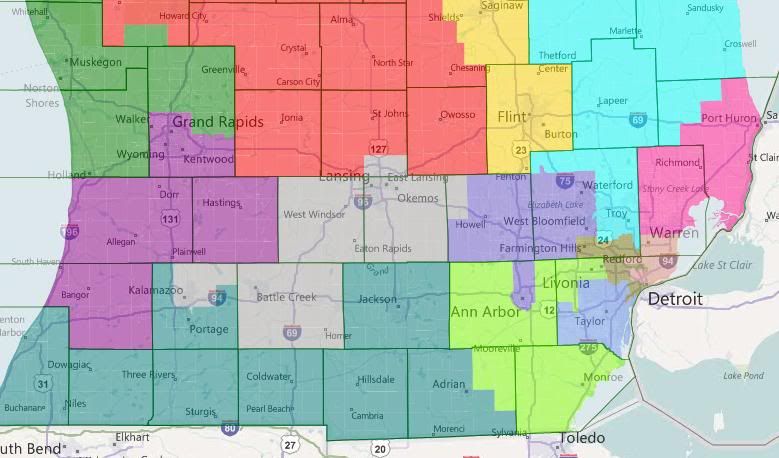
Option 2 – Ann Arbor, Battle Creek, Lansing

Option 2 has MI-07 cover central Michigan from Lansing to Jackson, with obviously-gerrymandered-yet-Michigan-standards-compliant arms to pick up Battle Creek and Ann Arbor-Ypsilanti.

Off-screen, MI-02 has picked up Wexford, Lake, and most of Newaygo Counties from MI-04, which is has in turn picked up the rest of Eaton and a big chunk of Calhoun. This is bad for Dave Camp. In other news worth mentioning, Walberg is now McCotter’s problem — although the massive amounts of Washtenaw he also picks up are an even larger problem. If I recall some math I did the other day, if you exclude Ann Arbor, the rest of Washtenaw voted 2-1 for Obama. Excluding Ypsilanti also helps, but not that much.

Overall, this map is better for Upton, Amash, and Rogers; and worse for Camp and McCotter.

Option 3 – Battle Creek, Kalamazoo, Lansing

Option 3 has MI-07 cover central Michigan from Lansing to Kalamazoo without dealing with the Ann Arbor problem.

Offscreen, we’re back to the arrangment of the first map — coastal = MI-02, interior = MI-04. Walberg is back to being Upton’s problem — but he’s also lost Kalamazoo, so that’s a legitimately Republican district now. Amash and Camp should both be happy. (Amash’s district in this arrangment, incidentally, is at zero-deviation from ideal.) Rogers should be okay — taking in Ann Arbor for Lansing-East Lansing should balance out. But McCotter’s still in trouble — again, even without Ann Arbor, Washtenaw is a 2-1 Obama jurisdiction.

Bonus Option

As I was writing the diary, I had the inspiration for a pro-Knollenberg, anti-Walberg map that cut out Dingell instead of Levin. MI-13 is 52.2% black VAP, MI-14 is 53.4% black VAP. Here it is without further commentary, because I need to get myself to bed.

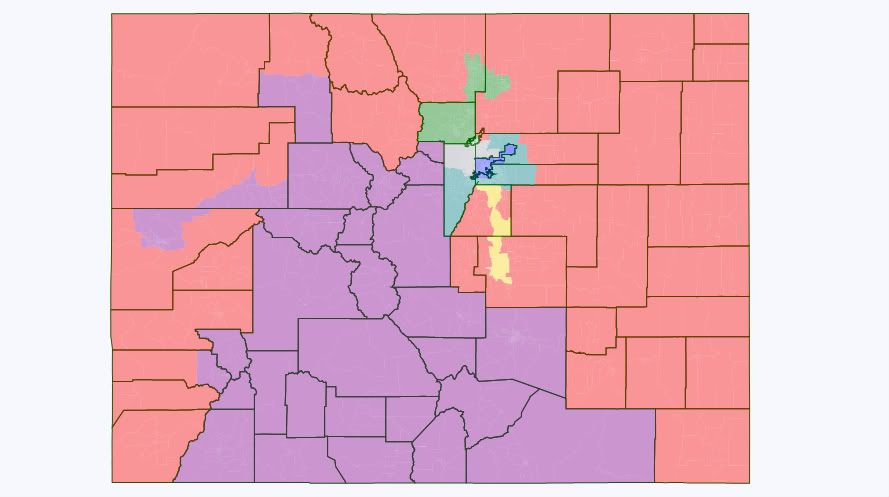
Democratic Gerrymander of Colorado

I had several goals here:

1. Knock out either Gardner or Tipton

2. Keep a district that Perlmutter can continue to hold relatively easily.

3. Make Coffman have to actually campaign, at the very least.

4. Create a district that Salazar or another moderate Dem can win and continue to hold.

Photobucket

District 3 (Purple): This is currently represented by Scott Tipton, but he lives in the new 4th, and would probably much rather try to primary Gardner than hold this marginal seat. The seat is now Pueblo-based and adds all the liberal ski towns from the 2nd district.  It does add conservative Park and Fremont counties from the 5th, but its loss of all the heavily GOP counties on the Western Slope more than offsets that.  It has a little arm reaching back to nab Grand Junction in order to meet population equality.  My best guess is this goes from its current R+5 rating to around R+1 or R+2. Salazar probably would have won re-election if he had this in 2010 and could easily win in any other year.  Other possible candidates include State House Minority Leader Sal Pace of Pueblo.

Likely D if Salazar runs; tossup otherwise

District 4 (Red): This GOP vote sink manages to combine both Cory Gardner, who lives in Yuma in northeast Colorado, and Scott Tipton, who lives in Cortez in southwest Colorado.  It contains all of the heavily GOP counties on both the Eastern Plains and Western Slope.  In addition, it loses both Fort Collins and Greeley, resulting in perhaps the most Republican district in the state.  It could be anywhere from R+15 to R+20.

Safe R

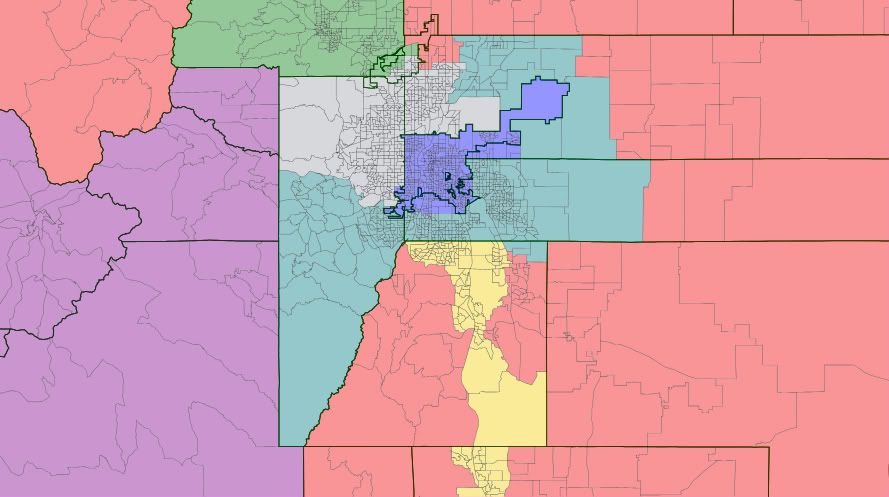
Metro Denver:

Photobucket

District 1 (blue): This is Diana DeGette’s Denver-based district.  Other than adding a few Arapahoe County precincts for population equality, not much of a change here. It’s currently D+21

Safe D

District 6 (teal): This is Mike Coffman’s suburban district, currently R+8.  However, it sheds extremely wealthy and conservative Douglas Country, as well as rural Elbert County, and the rural eastern part of Arapahoe County.  It adds a bunch of suburban areas in slightly D-leaning Jefferson and Adams Counties.  Although Coffman could probably still be able hold it, this would become a toss-up if he vacates the seat.  This is probably between R+3 and even PVI.

Lean R for Coffman, Tossup if open

District 7 (gray): This is the other suburban Denver district, currently held by Ed Perlmutter.  It basically just trades parts of Adams County for Jefferson County, which is pretty much a wash, and is probably still around the current D+4, but after dismantling Fraiser by 11% in 2010, he’s definitely safe.

Likely D for Perlmutter, Lean D if open

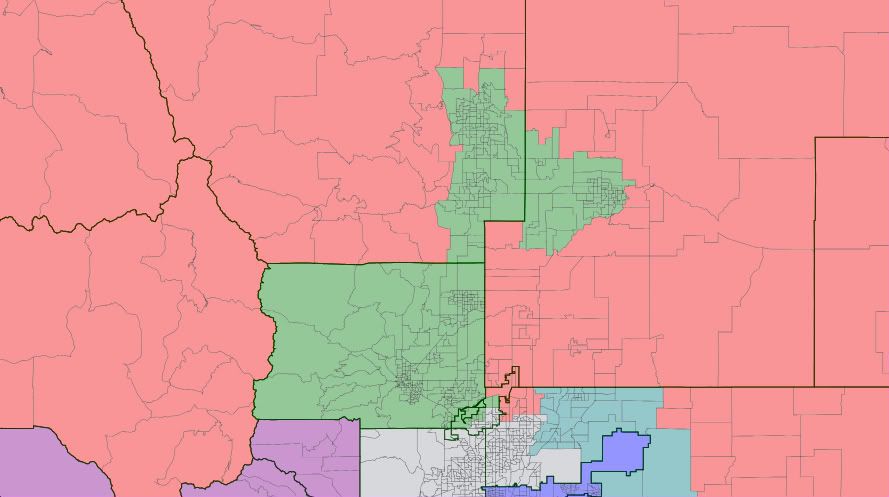
Northern Colorado:

Photobucket

District 2 (green): Jared Polis’ Boulder-based district sheds the ski towns, but adds liberal Fort Collins and Greeley to remain safe.  Probably unchanged much from the current D+11.

Safe D

Colorado Springs:

Photobucket

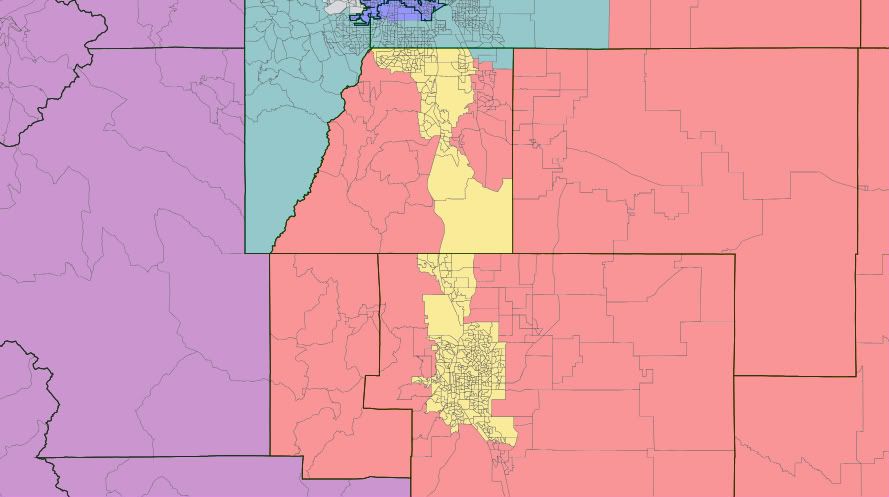
District 5 (yellow): This incredible GOP vote sink, held by Doug Lamborn, takes in Colorado Springs and a bunch of extremely wealthy parts of Douglas County: Castle Pines, Castle Rock, Lone Tree, etc.  It sheds liberal Lake County and swingy Chaffee County to the 3rd, as well as conservative, prison-filled Park and Fremont Counties.  It is probably even more Republican than its current R+14, and could be approaching R+20.

Safe R

So, here’s a recap:

District 1: Diana DeGette, Safe D

District 2: Jared Polis, Safe D

District 3: likely D for John Salazar, tossup otherwise

District 4: Cory Gardner/Scott Tipton, Safe R

District 5: Doug Lamborn, Safe R

District 6: Mike Coffman, Lean R for Coffman, tossup otherwise

District 7: Ed Perlmutter, Likely D for Perlmutter, lean D otherwise

Florida with cold turkey districts

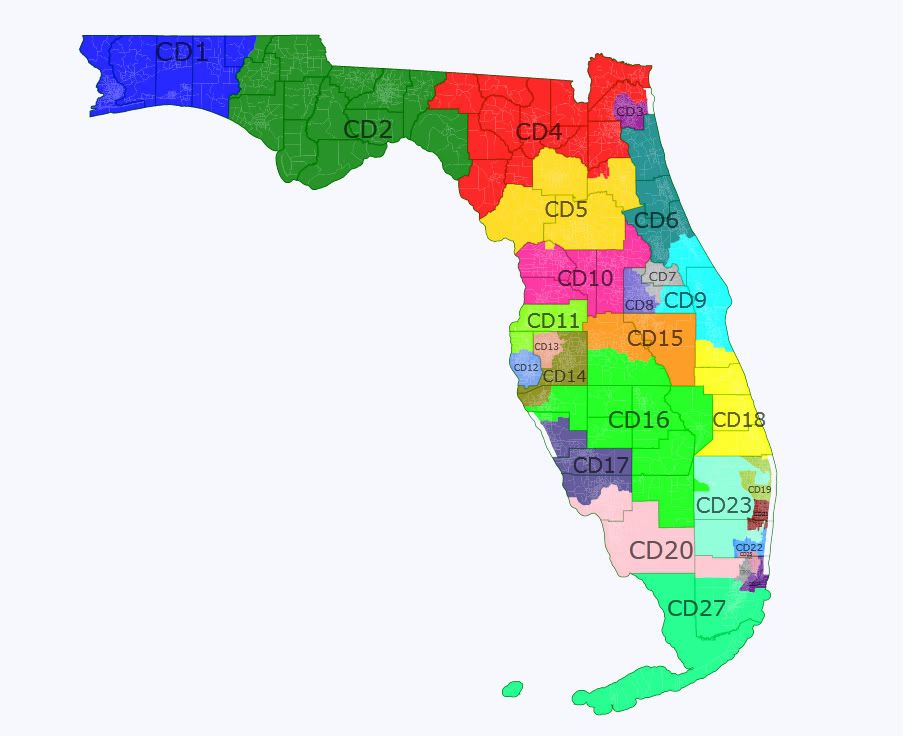
This is an attempt to draw new Florida districts based on the initiative they just passed prohibiting gerrymandering. There are three majority-Hispanic, one majority-black, and one plurality-black district all in the state’s south end, but beyond that the lines are just geography. I tried to keep counties and metropolitan areas together, and to a lesser extent cities. This map is what I think a neutral Iowa-type commission might come up with, but in practice I think the new map is likely to end up more like Michigan in that the districts will be fairly clean but more subtly drawn to favor Republicans.  

Anyway, for the districts w = Anglo, b = black, h = Hispanic, a = Asian. O = Obama, M = McCain. Numbers are voting age pop.

State map:

florida

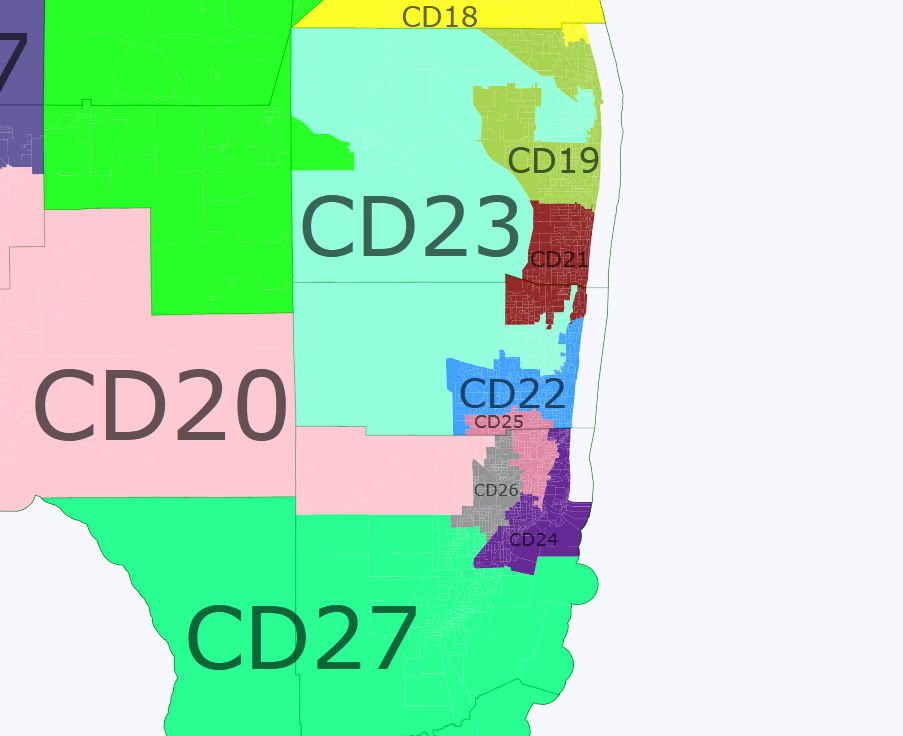
Miami closeup:

miami

FL1 (blue): 77.5w-12.5b-4.6h-2.7a. Deep red. Jeff Miller (current FL1) lives here.

FL2 (green): 68.6w-23.0b-4.8h-2.8a. Should still be likely R. Steve Southerland (current FL2) lives here.

FL3 (purple): 59.2w-27.6b-7.0h-4.2a. This is nothing like the current FL3, which is plurality-black but not remotely compact. This proposed FL3 is about 1 point more black than Duval county as a whole, which is about R+4. This new version is maybe R+2 or R+3 (lean R). Corrine Brown (current FL3) probably lives here but would be too liberal to win this version.

FL4 (red): 75.9w-14.9b-5.4h-2.1a. Also deep red, not too far off the current FL4. Ander Crenshaw (current FL4) probably doesn’t live here but could run here.

FL5 (yellow): 73.8w-13.4b-8.5h-2.8a. This would be a competitive district as it includes the college town of Gainesville. It’s basically Levy (M12-O7), Alachua (O73-M47), Marion (M90-O71), and Putnam (M19-O13). Collectively that’s roughly M168-O164 or about R+4. Cliff Stearns (current FL6) lives here but could potentially lose this to a blue dog.

FL6 (teal): 79.3w-8.9b-8.7h-1.8a. Has St Johns (M69-O36), Flagler (O25-M24), and most of Volusia (O127-M113). Resembles the current FL7 whose rep John Mica does not live here. Probably likely R.

FL7 (gray): 65.2w-8.5b-20.9h-3.7a. Orlando area district with Seminole (M105-O99) and generally whiter parts of Orange (O272-M186). Lean R? Mica and Dan Webster (current FL8) both live here, and Sandy Adams (current FL24) probably does too.

FL8 (blue-gray): 43.7w-25.0b-23.3h-5.4a. Western Orange. The whole county is D+6 and this end has more minorities so it’s probably likely D to safe D. Even Alan Grayson could hold this.

FL9 (toothpaste blue): 77.1w-7.5b-10.7h-3.0a. Southern Volusia, eastern Orange, and most of Brevard (M157-O127). Should be lean R to likely R. Adams could probably run here as it overlaps with most of her current district. Bill Posey (current FL15) also lives here.

FL10 (pink): 83.4w-6.2b-7.8h-1.3a. Four very red counties containing much of the current FL5. There isn’t going to be any free for all here, because Richard Nugent has a stranglehold on this district. Safe R.

FL11 (pea soup green): 84.9w-3.3b-8.5h-2.1a. Pasco (M110-O102) and north Pinellas (O244-M207). Lean R?  Gus Bilirakis (current FL9) lives here.

FL12 (light blue): 77.6w-10.6b-7.1h-3.1a. South Pinellas, mostly St Pete. Lean D? The county is D+0 to D+1 and this is probably the more liberal end of it. I think Bill Young (current FL10) lives here.

FL13 (pink-gray): 52.3w-16.8b-25.4h-3.6a. Mostly Tampa, lots of overlap with current deep-blue FL11 whose rep Kathy Castor probably lives here. Lean D to Likely D?

FL14 (olive): 67.3w-10.7b-17.8h-2.7a. East Pinellas, north Manatee. No incumbent. Lean R to likely R?

FL15 (orange): 59.1w-12.0b-25.3h-2.0a. Maybe 2/3 of Polk (M129-O114) and Osceola (O59-M39). Toss up? Dennis Ross (current FL12) lives here.

FL16 (garden hose green): 72.5w-8.2b-16.6h-1.5a. This spacious hinterland district had to take a chunk of the coast because there weren’t quite enough people in the interior counties. No incumbent. McCain won all of these counties. Likely R to safe R.

FL17 (indigo): 85.1w-3.7b-8.9h-1.2a. Most of Sarasota, Charlotte, north Lee. Likely R? Connie Mack (current FL14) appears to live just outside.

FL18 (yellow): 74.8w-10.8b-11.7h-1.4a. South Brevard, Indian River (M40-O30), St Lucie (O67-M52), Martin (M44-O33), a little bit of northeast Palm Beach. Lean R to likely R? I think Tom Rooney (current FL16) lives in the little bit.

FL19 (money green): 64.1w-11.2b-20.9h-2.4a. Mostly the less-black parts of north Palm Beach, and  takes a contorted shape in order to make FL23 plurality-black. Probably lean D to likely D. The whole county is D+8, although the bluest parts are in FL23. Apparently no incumbent. Lois Frankel, who plans to run against West, probably lives here.

FL20 (pale pink): 70.5w-6.6b-20.7h-1.3a. Collier, much of Lee, a bit of Miami-Dade. Safe R. Mack lives here.

FL21 (red-brown): 72.2w-9.7b-13.6h-2.8a. South Palm Beach, north Broward. Ted Deutch (current FL19) lives here. Likely D to safe D?

FL22 (sky blue): 58.8w-9.1b-27.2h-3.2a. Much of southern and eastern Broward, which is D+14 overall. Probably safe D. Debbie Wasserman Schultz (current FL20) lives here, and probably Allen West (current FL22) also does. That would be entertaining, although it wouldn’t be close.

FL23 (light blue-green): 32.0w-46.0b-17.6h-2.3a. This plurality-black district would probably produce a black rep so I would guess it would be VRA compliant. It looks compact, but it’s really a big cluster in the middle of Palm Beach, another big cluster in the middle of Broward, and the smaller Pahokee and Belle Glade areas on lake Okeechobee connected together by lots and lots of empty space. No incumbent either, unless West lives here. Safe D.

FL24 (purple): 28.8w-4.9b-63.6h-1.8a. After you carve out a majority-black district, what’s left of Dade will necessarily be majority-Hispanic. This overlaps with much of Ileana Ros-Lehtinen’s current FL18. Lean R?

FL25 (raw hamburger): 12.1w-52.6b-31.0h-2.4a. You can carve out a nice majority-black district that looks sort of like a mini-Florida from interior north Dade and the south end of Broward. Frederica Wilson (current FL17) and Alcee Hastings (current FL23) both live here. Safe D.

FL26 (gray): 6.1w-2.1b-90.6h-1.0a. Ninety percent! Seems to overlap with much of Mario Diaz-Balart’s current FL21. Lean R?

FL27 (sea foam green): 22.7w-11.1b-63.1h-1.9a. This overlaps with much of David Rivera’s current FL25 which is R+5, but loses a piece of Collier county that is 9% black and 43% Hispanic (the rest of the county is just 3% black and 11% Hispanic) so it probably isn’t anywhere near the county’s overall PVI of R+15. Probably still lean R to likely R if its new areas in Dade county aren’t much different from its old ones.

If my estimates of these districts are correct, this map is 18-8-1 considering only the partisan lean of the districts, but about half of the “red” districts would be competitive whereas the only really competitive “blue” district is probably FL12 in St. Pete. In practice I think this map would be in the range of 17R-10D to 15R-12D in most years. The current map has just 5 districts with a PVI of +4 or less one way or the other. I think this map would have considerably more, which should make for the more competitive elections the voters said they wanted this past November.

Thoughts? I don’t know this state well at all and would appreciate any pointers about these proposed districts.  

By what margin will Bob Shamansky win?

View Results

Loading ... Loading ...

A Democratic Mississippi

This map creates two Democratic districts with a PVI of at least D+10 and two Republican districts with a PVI of at least R+30, which would be the two most Republican in the country.

The districts are contiguous, even when they don’t really look like it, including a narrow strip along the gulf shoreline for the fourth district.

As always I crunched the actual precinct data to produce these maps. However in this case, to my horror, I could have saved a week of transcribing scanned county records and just maximised the minority districts since they produce almost exactly the same map. Nevertheless at least this way we have precise voting totals for each district.

1st(Blue): 63.2% Obama 37.8W 57.3B

2nd(Green): 66.2% Obama 36.1W 59.1B

3rd(Dark Magenta): 22.4% Obama 79.6W 16.0B

4th(Red): 22.3% Obama 78.8W 15.1B

Redistricting Washington: Can you think like a commission?

It’s hard to tell how a nonpartisan commission will draw maps. As we’ve seen with Iowa’s first round of maps, they can make some unusual choices. For this map, I tried to hew as closely to the existing districts as possible, within reason; there are some odd territorial splits (such as WA-09 jumping across Puget Sound) that might make more sense to a local than to a East Coast resident like myself.

I tried to limit city and county splits where possible, but sometimes it was unavoidable. The biggest split is Tacoma, half of which I had to put in WA-06 and half in WA-09. I also tried to either ignore partisan data or encourage competitive districts. Thanks to the way the map is set up currently, the latter was pretty easy to accomplish; there are five districts that I would consider competitive (WA-02, 06, 08, 09, and 10).

State

Seattle area

WA-01 (blue) – Instead of jumping across Puget Sound, it stretches across northern King County and farther up into Smohomish. Old district: 56.2% Murray, new district: 56.5% Murray.

WA-02 (green) – Expands very slightly, picking up a little bit of Snohomish and dropping the one random descent into eastern King County. Old district: 50.5% Murray, new district: exactly 50.0% for each (the margin is 118 votes in favor of Rossi).

WA-03 (purple) – This one probably changes the most. Northern end of the district is chopped off, and it moves east to Yakima. Old district: 52.5% Rossi, new district: 55.5% Rossi.

WA-04 (red) – Moves east, losing Yakima and gaining Walla Walla. Old district: 64.4% Rossi, new district: 63.9% Rossi.

WA-05 (yellow) – Loses Walla Walla, gains bits of Franklin County. Old district: 58.6% Rossi, new district: 58.4% Rossi.

WA-06 (teal) – Drops part of Tacoma, picks up islandy parts on the west side of Puget Sound. Old district: 53.1% Murray, new district: 53.0% Murray.

WA-07 (grey) – Seattle and a bit of the suburbs south of it. Old district: 81.0% Murray, new district: 81.5% Murray.

WA-08 (light purple) – Loses Pierce County. Adds a bit of the inner Seattle-area suburbs. Old district: 50.8% Rossi, new district: 53.0% Murray.

WA-09 (sky blue) – Loses the southwestern swath of territory, picks up a bit on the northern and eastern borders. Old district: 52.8% Murray, new district: 54.1% Murray.

WA-10 (magenta) – The new seat. Most of Pierce County, all of Thurston County, and some parts south and southwest of Thurston. 50.9% Rossi.

I don’t know if anyone got drawn out of their districts, but the only incumbent that would probably be seriously miffed is Reichert. Losing Pierce County would be a blow to his re-election chances. He could always move to the new WA-10, though.

Daves Redistricting – Final States & WA Election Data

Hi,

Dave’s Redistricting now has 49 states with 2010 data (all but Alaska). New ones (with block groups) are OR, KY, MT, RI.

Also, I added data from the 2010 Senate election in WA state. Someone sent me the raw spreadsheet and it was a bit of work, but I matched it up.

DRA made it into the news again in an article about VA redistricting.

It doesn’t sound like citizens were top priority here. [Note: I’ve had trouble publishing this text; I keep getting errors from SSP.]

Barker downloaded Dave’s Redistricting software from the Internet and got to work. The latest population numbers didn’t come out until February, but he began getting familiar with the state using 2008 estimates.

Cross posted on DailyKos.com

Redistricting Oregon: O So Svelte

Dave Bradlee finally managed to sort the obnoxious problems with Oregon’s 2010 Census data, which means it’s time for me to give my home state a whirl.

Nothing too much has changed, as you can see. It just has pretty lines and definitely preserves communities of interest. Only three counties (Columbia, Josephine, and Lincoln) are split between congressional districts, and none of those three are split between more than two districts.

OR-01 (blue)

Democratic Rep. David Wu, who lives in Multnomah County, is out. Unfortunately, some depopulation along the Oregon Coast means this district is stretching a bit further south to find constituents, which is maybe the only part of this map I’m not thrilled about (for aesthetic reasons). As for the politics, as this is a horse-race elections site: Despite Yamhill County’s Republican lean, the great majority of this district’s population is in true blue northwestern Oregon. If Wu can be kept out by this redistricting job, state senators Suzanne Bonamici and Mark Hass are probably in line, provided Labor Commissioner Brad Avakian doesn’t want the job. The inside scoop is that if Wu’s job opens up, he’s got first right of refusal. Likely Democratic.

OR-02 (green)

Walden lives in Hood River. Hood River has been moved elsewhere. Even if Walden doesn’t move back – and I think the diehard conservatives in eastern Oregon, which is (surprisingly enough) one of the most conservative parts of the entire country, may prefer to send Oregon Senate Minority Leader Ted Ferrioli or Bend-area state senator and ambitious “rising star” Chris Telfer to Congress instead of Walden, a close ally of (the possibly doomed) Speaker Boehner who has taken flak for being a leading member of the quasi-moderate Main Street Partnership – this district is red enough to elect an Oregonian version of Christine O’Donnell without a fuss. Anyway, I felt Hood River County belongs with eastern Multnomah County in terms of communities of interest more than it belongs with the high desert cow counties. Safe Republican.

OR-03 (purple)

Democratic Rep. Earl Blumenauer’s district has consolidated all of Multnomah County, taken over Hood River County, and poked up into Columbia County just a tad bit, simultaneously withdrawing from Clackamas County. As for politics: Che Guevara could get elected here by double-digit margins. Walden could run here, but he would get clobbered. Wu could also run here, but he would also get clobbered. Mostly, I just think this district looks nice. Safe Democratic.

OR-04 (red)

One of the enduring mysteries of Congress is the charmed existence of Democratic Rep. Peter DeFazio, a blunt, unabashed, aggressively off-the-reservation left-winger sitting in a light-blue seat. Last year, when conditions seemed perfect for a Republican to potentially upset DeFazio, Republicans in the district nominated certifiable crazy person Art Robinson. DeFazio’s final margin was closer than expected, perhaps on account of his taking victory against Robinson pretty much for granted, but it was still fairly convincing. This district hasn’t changed much. DeFazio still has the red ball-and-chain that is Linn County tethered to him, but it’s easily offset by flaming liberal Benton and Lane counties, both of which are anchored by legendarily left-wing college towns. In terms of actually drawing the map, since I wasn’t consulting political data, it was basically just leftover western Oregon and as much of southern Oregon as fit with population limits stretching east from the coast (which turned out to be not much). Likely Democratic.

OR-05 (yellow)

What is there to do about Democratic Rep. Kurt Schrader? Well, one thing to do that would make Clackamas County residents happy would be to give the piece of OR-03 reaching down a little bit into Schrader’s home county back to this fairly swingy district. Another thing might be to embark on a registration drive in increasingly Hispanic Salem and its suburbs, but that’s not really redistricting’s job. Redistricting’s job is to preserve communities of interest, and that was my chief consideration here. As a progressive who generally supports Democrats, I’m not honestly worried about Schrader, and this is why: Republicans target OR-05 every cycle, and every time, they do worse than they were expecting. Last year, Schrader was supposed to lose to Scott Bruuuuuuuuuuuuuun (who, yes, still lives in this district). He won by over five points instead. Republicans were supposed to take over the district in 2008 when then-Rep. Darlene Hooley retired. Schrader crushed Hooley’s 2006 opponent (who was supposed to beat her then, too) by 16 points. Fun fact: in this D+1 district, Republicans haven’t even come as close as five points away since 1994 – the cycle before then-Rep. Jim Bunn lost to Hooley (in 1996) by a margin nearly identical to the margin by which Schrader prevailed last year. For whatever reason, this district is fools’ gold for the Oregon Republican Party. But my favorite part of this redrawn district? It consists simply of all of Polk, Marion, and Clackamas counties, and it’s just 515 heads over the target population. Sexy. Lean Democratic.

Preview about the redistricting of the 50 states

The Democrats begin this process with a clear disadvantage from previous redistricting. Following the Cook Partisan Voting Index there are:

194 D+ seats

9 EVEN seats

232 R+ seats

We can not forget it.

This diary seeks to give a preview about what the Republicans can do in the redistricting process and about the best ways for the Democrats in certain states (IL, MD, AR, WV, OR, CO, NY…) to have some success after the current redistricting process.

The diary is focused to see the most direct potential or likely effects of the redistricting process.

STATES WITH FULL CONTROL FOR THE REPUBLICANS

I’m not optimistic about this group of states because the Republicans never lose a chance for take advantage. The Republicans will have full control of the redistricting process in many states, and I will go state by state.

Utah

One new district for the Republicans.

UT-02 J Matheson (D) surely will run in a R+20+ the next time and without part of the current basis that send him to the house now.

Wyoming

No effect.

Oklahoma

OK-02 D Boren (D) surely will run in a R+20+ district. The same as J Matheson.

Alabama

No chance for B Bright to return.

Alaska

The Alaska Redistricting Board (Commission) is in Republican hands.

No changes.

Nebraska

NE-02 will be surely safer for the Republicans. There is no chance Obama wins again this electoral vote.

Kansas

KS-03 safer for the Republicans.

Louisiana

Thanks to some party switches, the Republicans have control of both state chambers and because of this they will have control of the redistricting process. But Louisiana will lose one seat and that cannot be LA-02 thanks to the Voting Rights Act. That means the Republicans will lose one district here.

No chance for C Melancon to return.

LA-03 seems the district that would disappear.

North Dakota

No effect.

Texas

Here I do not expect gains for the Democrats. As a maximum, one if we recover TX-23 and TX-27, but I think it is very difficult. If there are not a law requiring the creation of new VRA districts, the Republicans will create none. Finally, there are 36 districts for Texas, I would expect 7 D+, 3 R+low approximately and 26R+10 or higher, but things still can be worse. The three “swing” districts can likely be the successors of TX-28, TX-27 and TX-23. These would be again the districts to fight.

Four new districts for the Republicans.

TX-25 L Doggett (D) can likely run in a R+10+ district or against one of the neighboring democratic incumbents.

TX-28 H Cuellar (D) can likely run in a R+low district.

South Dakota

No effect.

Tennessee

No chance for L Davis to return.

TN-05 J Cooper (D) can likely run in a R+10+ district. The same as L Doggett.

South Carolina

One new district for the Republicans.

No chance for J Spratt to return.

Georgia

If I’m not wrong the Republicans can decrease the percentage of African-Americans in GA-02 and GA-12 because there are districts with a white majority (over 50% white) and would have less VRA protection. That means these will be new R+ districts.

One new district for the Republicans.

No chance for J Marshall to return.

GA-02 S Bishop (D) can likely run in a R+10+ district.

GA-12 J Barrow (D) can likely run in a R+10+ district.

Indiana

If the Republicans wish they can draw all the districts with R+6 rating. If they keep one Democratic seat (likely IN-01), they can draw all the other districts with R+8 rating. If they keep two Democratic seats (likely IN-01 and IN-07), they can draw all the other districts with R+10 rating. Looking at the recent history of IN-08 and IN-09 districts, I think they will want the safest seats, so I think they will keep IN-01 and IN-07 as Democratic seats.

IN-02 J Donnelly (D) will need to run for a R+10+ district or will need to run a primary against P Visclosky.

North Carolina

The Republicans have full control of the redistricting process here. They will take advantage of this, but North Carolina is a swing state with a strong tradition of moderate to conservative Democrats. The most competitive district that the Republicans won in 2008 was R+11. First they need to protect NC-02. And later I think they will bid to make NC-08, NC-07 and NC-11 enough Republican to try to defeat the Democratic incumbents. It is more likely they will go after these seats because the Democrats here can be more dangerous for them for statewide races. NC-01, NC-12, NC-13 and NC-04 would keep D+ rating. NC-01 in the North East, NC-12 in Charlotte, NC-13 in Raleigh-Durham, and NC-04 in the area of Fayetteville toward Chapel Hil toward Greensboro. D Price may get out his NC-04.

NC-08 L Kissell (D) can likely run in a R+10+ district.

NC-07 M McIntyre (D) can likely run in a R+10+ district.

NC-11 H Shuler (D) can likely run in a R+10+ district.

Florida

The current redistricting of Florida is very pro-Republican and the new procedure for redistricting will not change it. All the current swing districts are in Republican hands and the legislature (Republican majority) will not approve a map that does not protect their incumbents in 2012. FL-22 surely will become a R+low district. Florida will have some R+low districts that the Democrats can fight for.

Two new R+ seats for the Republicans.

Ohio

Despite having full control of the redistricting process, including the trifecta and the commissions that draw the legislative maps, the Republicans do not have a chance of improving in Ohio. The Republicans have enough work to keep the incumbents, including their gains of 2010 (5 seats) and surely it will not be possible they win more. They will lose at least one district, and they will have a lot of swing districts with R+low rating, including OH-01, OH-12 and OH-15.

OH-13 B Sutton (D) surely will get out of the game.

One Republican seat will disappear too. Maybe OH-06.

New Hampshire

No changes.

Pennsylvania

The Republicans control the Pennsylvania Legislative Reapportionment Commission that draws the state legislative districts and the state legislature that draws the congressional map. But redistricting Pennsylvania is more difficult than Ohio for the Republicans. They have enough work protecting incumbents, and they will have a lot of swing districts with R+low rating. I expect 5 D+ safe districts (PA-01, PA-02, PA-13, PA-14 and PA-17). T Holden does not seem vulnerable and surely the Republicans will give to his district a D+ rating. PA-11, PA-06, PA-07, PA-08 and PA-15 can be R+ low in 2012. And here there are two Democratic incumbents in R+ districts that can have trouble.

PA-12 M Critz (D) surely will be without his own district and surely will need to run against a Republican incumbent, but the district will likely have R+low rating.

PA-04 J Altmire (D) will likely run in a R+10+ district.

Wisconsin

After winning full control of the redistricting process, I think the Republicans will work to keep their incumbents in 2012. Surely WI-07 will be a R+low district. Because of it, all the Republican incumbents will be in swing districts. The recall can affect the process giving, some chance to the Democrats.

Michigan

Again the same. The Republicans have more than enough work keeping their incumbents, and surely MI-06 and MI-11 will end as R+low districts. Michigan must lose one district and will likely be MI-09.

MI-09 G Peeters (D) can likely get out the game. Surely G Peeters will need to run against other incumbent, maybe against S Levin (D).

RECOUNT

+22 new R+ districts

-18 new D+ or EVEN districts

We have the next range for the Republican gains after redistricting:

+1 – +2 Utah (1 new and maybe UT-02)

=0 – =0 Wyoming

=0 – +1 Oklahoma (maybe OK-02)

=0 – =0 Alabama

=0 – =0 Alaska

=0 – =0 Nebraska

=0 – =0 Kansas

– 1 – – 1 Louisiana (1 seat less LA-03)

=0 – =0 North Dakota

+4 – +6 Texas * (4 new and maybe TX-25 and TX-28)

=0 – =0 South Dakota

=0 – +1 Tennessee (maybe TN-05)

+1 – +1 South Carolina (1 new)

+1 – +3 Georgia (1 new and maybe GA-02 and GA-12)

=0 – +1 Indiana (maybe IN-02)

=0 – +3 North Carolina (maybe NC-08 and NC-11)

+2 – +2 Florida * (2 new seats)

– 1 – – 1 Ohio * (1 seat less OH-06)

=0 – =0 New Hampshire *

=0 – +1 Pennsylvania * (maybe PA-04)

=0 – =0 Wisconsin *

=0 – =0 Michigan *

———–

+7 – +19 Total Republican gains for these states *

And the range for the Democratic gains after redistricting:

– 1 – =0 Utah (maybe UT-02)

=0 – =0 Wyoming

– 1 – =0 Oklahoma (maybe OK-02)

=0 – =0 Alabama

=0 – =0 Alaska

=0 – =0 Nebraska

=0 – =0 Kansas

=0 – =0 Louisiana

=0 – =0 North Dakota

– 2 – =0 Texas * (maybe lose TX-25 and TX-28)

=0 – =0 South Dakota

– 1 – =0 Tennessee (maybe TN-05)

=0 – =0 South Carolina

– 2 – =0 Georgia (maybe GA-02 and GA-12)

– 1 – =0 Indiana (maybe IN-02)

– 3 – =0 North Carolina (maybe NC-08 and NC-11)

=0 – =0 Florida *

– 1 – – 1 Ohio * (1 seat less OH-13)

=0 – =0 New Hampshire *

– 2 – – 1 Pennsylvania * (1 seat less PA-12 and maybe PA-04)

=0 – =0 Wisconsin *

– 1 – – 1 Michigan * (1 seat less MI-09)

———–

– 15 – – 3 Total Democratic gains for these states *

* = This diary looks at the most likely direct effects of the redistricting. I have not counted the swing districts that are not strongly affected by the redistricting process and that the democrats can win in Texas, Florida, Ohio, New Hampshire, Pennsylvania, Wisconsin and Michigan in 2012, despite the Republican full control of the redistricting process in these states. The effect of this would be fewer gains to the Republicans and would be fewer losses for the Democrats (maybe some net gain).

STATES WITH BIPARTISAN OR INDEPENDENT COMMISSIONS AND STATES WITH CONTROL OF BOTH PARTIES

COMMISSION

Idaho (R majority ID Supreme Court)

No effect. Maybe ID-01 be a little more Republican.

Montana (D majority MT Supreme Court)

No effect.

Arizona (R majority AZ Supreme Court)

Arizona will win one house seat that can go to the Republicans and in exchange the Democrats will seek to protect AZ-08 until they have a D+5+ district.

New district for the Republicans.

Iowa (R majority IA Supreme Court)

Iowa will lose one seat. Yesterday was published the first draft of the Commission for redistricting. I think the first map will be rejected. Two of the current incumbents must run at least in the same district. Likely one Democrat and one Republican but the rest would keep their own district. Surely the most likely option is L Boswell (D) and T Latham running in something like a merger of the current IA-03 and IA-04 that can be very close to EVEN rating. I would not accept anything worse. Surely a merger of the current IA-01 and IA-04 would be more favorable for the Democrats but the Republicans would reject this.

New Jersey (D majority NJ Supreme Court)

The commission in this state is keeping one of the most pro-Republican maps in all the bluest states. This year the prospect is favorable because the Democrats are a little favored in the control of the process for drawing new maps, but still the final map can keep pro-Republican details. The state will lose one US House seat and the first candidate can be NJ-03 if they are not open seats. It seems none of the Republican representatives would challenge R Menendez before losing his US House seat in the redistricting process. Later surely the damaged Republican will challenge him. I think NJ-02 can become also R+.

Maine (D majority ME Supreme Court)

Maybe ME-02 becomes a little safer.

Washington (D majority WA Supreme Court)

There will be a new district likely in the north of King County that can go Democratic, while WA-03 can be R+low district, but WA-08 would countinue as D+low. I hope WA-02 also becomes a little safer district, while other Democratic seats do not get weaker.

California (R majority CA Supreme Court)

I’m so skeptical about the result of the new system for redistricting California. I think we have lost an opportunity of drawing a good map having the trifecta (the governor and the majority in both state chambers). At least, CA-11 should become a D+ district, but the redistricting in California is the most unpredictable process (with Texas), and we can have surprises here.

New York (R majority NY Court of Appeals but D CJ)

The first goal for the Democrats must be up to D+5+ level NY-02, NY-27, NY-01 and NY-23. NY-25 surely will be the first district that gets out the game. The Democratic votes of Syracuse can help making safer the NY-23. Still I think the Democrats must find more here. I think the Democratic members of the legislature must want the Republicans to lose a second seat. I would select NY-13, but if there is some trouble about Staten Island, the next option would be NY-03. This still would leave 6 R+low swing districts in New York. This is little improvement. I think the little advantage of the Republicans in the state senate should not be enough to stop these improvements and maybe more.

Vermont (D majority VT Supreme Court but R CJ)

No effect.

Hawaii (D majority HI Supreme Court but R CJ)

No effect.

RECOUNT

– 2 new R+ districts

=0 new D+ or EVEN districts

We have the next range for the Republican gains after redistricting:

=0 – =0 Idaho

=0 – =0 Montana

+1 – +1 Arizona * (1 new seat)

– 1 – =0 Iowa (maybe lose the current IA-04)

– 1 – – 1 New Jersey * (1 seat less)

=0 – =0 Maine

=0 – =0 Washington *

=0 – =0 California *

– 2 – – 2 New York * (2 seats less)

=0 – =0 Vermont

=0 – =0 Hawaii

———-

– 3 – – 2 Total Republican gains for these states *

And the range for the Democratic gains after redistricting:

=0 – =0 Idaho

=0 – =0 Montana

=0 – =0 Arizona *

– 1 – =0 Iowa (maybe lose the current IA-03)

=0 – =0 New Jersey *

=0 – =0 Maine

+1 – +1 Washington * (1 new seat)

=0 – =0 California *

=0 – =0 New York *

=0 – =0 Vermont

=0 – =0 Hawaii

———–

=0 – +1 Total Democratic gains for these states *

* = This diary looks at the most likely direct effects of the redistictring. I have not counted the swing districts that are not strongly affected by the redistricting process and that the democrats can win in Arizona, New Jersey, Washington, California, and New York in 2012, despite the Republican full control of the redistricting process in these states. The effect of this would be fewer gains to the Republicans and would be fewer losses for the Democrats (maybe some net gain).

Some people think the “independent” commissions are the right procedure for redistricting, but the Republicans have an advantage here because these commissions keep some pro-Republican maps and contribute to the advantage that the Republicans have in other states where they work with full control.

In the R+ states working with commissions, the Democrats only have 2 Hispanic representatives in Hispanic majority districts, and 1 (G Giffords) in a R+ district. While, in the EVEN or D+ states working with commissions, the Republicans have 39 representatives.

CONTROL OF BOTH PARTIES

Kentucky (R majority KY Supreme Court)

No important changes. The Republicans will block every improvement for the Democratic representatives.

Mississippi (R majority MS Supreme Court)

No changes.

No chance for T Childers or G Taylor to return.

Missouri (D majority MO Supreme Court but R CJ)

Missouri will lose one seat and that will give trouble to both parties. There are very few options for keeping the current MO-01 as an African-American majority district, so little discussion about the borders of this distric. For the rest, I think the most likely scenario can be a merger of MO-03 (D+7 R Carnahan) and MO-02 (R+9 T Akin) in a district that surely can not be EVEN, but can be R+1 approximately. Another option would be a merger of MO-05 (D+10 E Cleaver) and MO-06 (R+7 S Graves), but I think the Democrats will dislike losing the balance between St Louis and Kansas City and the Republicans will dislike leaving some Democratic votes to MO-04, endangering a second seat, or giving to the new seat from the merger a D+ rate.

MO-02/03 R Carnahan (D) can need to run in a R+1 seat against T Akin (R) if the Republican does not run for senate.

Virginia (R majority VA Supreme Court)

The Democrats will seek to protect VA-11 and the Republicans some of their districts. Still this state will have some swing district with R+low rating.

Colorado (D majority CO Supreme Court)

Here the Republicans have a very weak majority in the state house (32D-33R) but the redistricting is made by a commission where the Democrats can have the control thanks to the three members appointed by the governor, who has veto power. At a minimum I think the Democrats can be successful with a 3D-3R-1S map that gives EVEN or little better rating to the current CO-03. Nothing to lose here.

Nevada (D majority NV Supreme Court)

Nevada will have a new district. Surely NV-03 will be a R+low district while the new district will be a D+low.

Minnesota (R majority MN Supreme Court)

I think the Republicans can find MN-03 and MN-08 become R+ while the Democrats can find MN-01 and MN-07 become D+.

New Mexico (D majority NM Supreme Court)

Here I do not expect big changes. I think the Democrats can have some advantage making NM-02 a little less Republican.

Oregon (D majority OR Supreme Court)

I think the Democrats can be able to make safer OR-04 and OR-05. I would like to see a 5-0 map here and I think it would be possible. Despite the tie in the state house, the Republicans have a very weak prospect because if the state legislature fails drawing the maps, the Secretary of State (Democrat) would draw the maps of the state house and the state senate seats.

Connecticut (R majority CT Supreme Court)

The current map only needs a little mix of the current CT-05 and CT-01. A bipartisan commission will draw the paps that need the approval of 2/3 of both chambers. The Republicans are now just over 1/3 in both chambers.

RECOUNT

=0 new R+ districts

=0 new D+ or EVEN districts

We have the next range for the Republican gains after redistricting:

=0 – =0 Kentucky

=0 – =0 Mississippi

– 1 – =0 Missouri

=0 – =0 Virginia *

– 1 – =0 Colorado * (maybe lose CO-03)

=0 – =0 Nevada *

=0 – =0 Minnesota *

=0 – =0 New Mexico *

=0 – =0 Oregon

=0 – =0 Connecticut

———-

– 2 – =0 Total Republican gains for these states *

And the range for the Democratic gains after redistricting:

=0 – =0 Kentucky

=0 – =0 Mississippi

– 1 – =0 Missouri

=0 – =0 Virginia *

=0 – +1 Colorado * (maybe win CO-03)

+1 – +1 Nevada * (1 new seat)

=0 – =0 Minnesota *

=0 – =0 New Mexico *

=0 – =0 Oregon

=0 – =0 Connecticut

———–

=0 – +2 Total Democratic gains for these states *

* = This diary looks at the most likely direct effects of the redistictring. I have not counted the swing districts that are not strongly affected by the redistricting process and that the Democrats can win in Virginia, Colorado, Nevada, Minnesota and New Mexico in 2012, despite the Republican full control of the redistricting process in these states. Again, the effect of this would be fewer gains to the Republicans and would be fewer losses for the Democrats (maybe some net gain).

This would be the recount until now:

+20 new R+ house seats

– 18 new D+ or EVEN house seats

(+2,+17) range for Republican gains *

(- 15,=0) range for Democratic gains *

* = This diary looks at the most likely direct effects of the redistricting. I have not counted the swing districts that are not strongly affected by the redistricting process and that the Democrats can win in many states (emphasized with *). But the large majority of these districts would be R+low districts. That means the Republicans have some advantage here.

NH-01, NH-02, WA-08 and CO-03 are the only Republican districts in all these 43 states that surely would be EVEN or D+ after the redistricting process. The Republicans have a low chance of making or keeping these districts as R+, so these districts should be obvious targets for the Democrats in 2012 from now on.

STATES WITH FULL CONTROL FOR THE DEMOCRATS

From this group of states must come the improvements that balance the gains of the Republicans. I think the Democrats must find here the necessary gains to balance the Republican gains in other states. And just I will find it for this group (less to preview or predict and more to propose where is possible).

Arkansas

The Democrats have the control of the Board of Apportionment (Commission) that draws the state legislature districts and also control the state legislature that draws the congressional districts. The best way to keep the Democratic congressional delegation from Arkansas in the long-term would be to have a black district protected by the Voting Rights Act. Surely this is the last chance to make a black district in Arkansas protected by the VRA. If the Democrats from this state do not do this, the Republicans will have a 0D 4R map the first chance they have. It is possible to create a district with more African-American population than white, but for me the goal would be a D+ (D+5?) district that keeps the white population under 50%, to draw a R+5 district district for M Ross (including parts of Washington County, and to leave two R+20+ for the Republicans, approximately.

West Virginia

I think the Democrats will want to protect N Rahall (WV-03) and endanger WV-01. My goal would be both districts become R+5-. If it is necessary breaking the county borders.

Delaware

No effect.

Illinois

Illinois will lose a house seat too. The Democrats from Illinois surely can put every Republican incumbent running in a D+5+ district for 2012. I hope they do it. It is necessary. The redistricting in Illinois is key in this cycle for the Democratic Party for balancing the Republican gains in other states.

IL-06 seems the most likely district to disappear.

Maryland

I think the Democrats from Maryland will make MD-01 and MD-06 D+5+ districts, winning two seats for the Democratic side. The Democrats of the rest of the country need it to balance the Republican gains in other states.

Rhode Island

No effect.

Massachusetts

MA-10 W Keating (D) This state will lose one district after the redistricting process. I think we will not have open seats for 2012 here, and because of this MA-10 would be the most likely seat to disappear.

RECOUNT

– 3 to – 11 new R+ districts

+1 to +9 new D+ or EVEN districts

We have the next range for the Republican gains after redistricting:

– 1 – =0 Arkansas (maybe AR-02)

– 1 – =0 West Virginia

=0 – =0 Delaware

– 11 – – 1 Illinois

– 2 – =0 Maryland

=0 – =0 Rhode Island

=0 – =0 Massachusetts

———-

– 15 – – 1 Total Republican gains for these states *

And the range for the Democratic gains after redistricting:

=0 – +1 Arkansas (maybe AR-02)

=0 – +1 West Virginia

=0 – =0 Delaware

=0 – +10 Illinois

=0 – +2 Maryland

=0 – =0 Rhode Island

– 1 – – 1 Massachusetts

———–

– 1 – +13 Total Democratic gains for these states *

* = This diary looks at the most likely direct effects of the redistictring. I have not counted the swing districts that are not strongly affected by the redistricting process and that the Democrats can win in 2012. They are not in this group of states.

This would be the total recount without including the effect of a gerrymandered redistricting of Illinois:

+17 new R+ house seats

– 17 new D+ or EVEN house seats

183 D+ seats

3 EVEN seats (maybe IA-03/04, CO-03 and NH-01)

249 R+ seats

(- 3,+16) range for Republican gains *

(- 16,+3) range for Democratic gains *

This would be the total recount including the effect of a gerrymandered redistricting of Illinois:

+9 new R+ house seats

– 9 new D+ or EVEN house seats

191 D+ seats

3 EVEN seat (maybe IA-03/04, CO-03 and NH-01)

241 R+ seats

(- 13,+16) range for Republican gains *

(- 16,+13) range for Democratic gains *

* = This does not include many swing districts in Republican hands in many states (emphasized with *). But except NH-02, WA-08 and NH-01, all the other seats would be R+(low) districts. That means the Republicans have some advantage here.

California and Texas are the most difficult states to predict and can give the biggest surprises. California can give likely some good surprise, but Texas can give a likely worse result.

Gerrymandering Illinois can be the alone way to keep the current number of D+ seats in the US House and to balance the likely Republican gains that the redistricting process in other states will give to them.

——————————————————————————————-

——————————————————————————————-

RESUME

1 THE NEW DISTRICTS AND THE DISTRICTS TO DISAPPEAR

Republican safe gains = 10

UT-04 (new)

TX-33 (new)

TX-34 (new)

TX-35 (new)

TX-36 (new)

SC-07 (new)

GA-14 (new)

AZ-09 (new)

FL-26 (new)

FL-27 (new)

Democratic safe gains = 2

NV-04 (new)

WA-10 (new)

Republican safe losses that can not be Democratic gains = 6

LA-03 (disappear)

OH-06 (disappear)

IL-06 (disappear)

NJ-03 (disappear)

NY-25 (disappear)

NY-13 (disappear)

Democratic safe losses that can not be Republican gains = 4

OH-13 B Sutton (D) (disappear)

PA-12 M Critz (D) (disappear)

MI-09 G Peeters (D) (disappear)

MA-10 W Keating (D) (disappear)

In the middle = 2

MO-02/03

IA-03/04

From this group the Republicans will gain 2 to 4 seats (only 2 if L Boswell and R Carnahan can keep the districts).

2 THE DISTRICTS STRONGLY AFFECTED BY THE REDISTRICTING PROCESS

Democratic seats that can be Republican gains as a consequence of important changes in the redistricting process = 12

TX-25 L Doggett (D) as R+10+

IN-02 J Donnelly (D) as R+10+

GA-02 S Bishop (D) as R+10+

TN-05 J Cooper (D) as R+10+

NC-08 L Kissell (D) as R+10+

UT-02 J Matheson (D) as R+20+

GA-12 J Barrow (D) as R+10+

PA-04 J Altmire (D) as R+10+

NC-07 M McIntyre (D) as R+10+

NC-11 H Shuler (D) as R+10+

OK-02 D Boren (D) as R+20+

TX-28 H Cuellar (D) as R+low

Republican seats that can be Democratic gains as a consequence of important changes in the redistricting process = 15

MD-01 as D+5+

IL-08 as D+5+

MD-06 as D+5+

IL-14 as D+5+

CO-03 as EVEN

WV-01 as R+5-

AR-02 as D+5+

IL-17 as D+5+

IL-10 as D+6+

IL-11 as D+5+

IL-15 as D+5+

IL-19 as D+5+

IL-13 as D+5+

IL-16 as D+5+

IL-18 as D+5+

The order goes from the most vulnerable to the less vulnerable to the change for every party.

After the two groups the range for both parties (if Illinois is gerrymandered) would be:

(- 13,+16) range for Republican gains

(- 16,+13) range for Democratic gains

3 THE REST

Other Democratic endangered seats = 0

Only KY-06, WV-03 and AR-04 would have R+ rating.

Other Republican endangered seats = ?

Only NH-02, WA-08 and NH-01 would have D+ or EVEN rating.

A good number of swing R+low districts.

If the Democrats work well in group 2, other possible gains would help to reduce the Republican majority in the US House. If the Democrats do not work enough in group 2, some possible gains would help to balance the Republican advantage after the redistricting but not to gain new seats. It is very important to do a good work in the redistricting process.

By what margin will Bob Shamansky win?

View Results

Loading ... Loading ...

Arizona Redistricting: 5-4 Republican

Cross posted on my blog http://frogandturtle.blogspot…. which you should visit for more redistricting maps and election analysis.

Some states such as California have districts that almost never switch parties. In 2006-2010 though, Arizona’s House seats kept switching parties with 6 party switches throughout those years. Before 2006, Arizona had a 6-2 Republican map and after the 2008 elections, it was 5-3 Democratic. After 2010 though, the Republican tide hit here and the delegation shifted to 5-3 Republican. Arizona’s 7th and 8th Congressional District in 2010 also were close to switching parties although Raul Griljava (D) and Gabrielle Giffords (D) held their respective seats. Why was Arizona filled with competitive districts? They had an independent commission that drew the maps. Although Republicans hold the trifecta by holding the State Legislature and the Governorship, they have no power over redistricting because the commission draws the lines. I drew this map predicting what the commission will draw. Although a few of the districts such as the 5th and the 1st are competitive, I assume that this map will be a 5-4 Republican map. This is fair for Arizona because 5-4 Republican is similar to the partisan makeup of Arizona which leans Republican in most elections. I also strengthened many of the incumbents in this map such as Raul Griljava (D) and Gabrielle Giffords (D). My map has 1 Safe Democratic, 2 Likely Democratic, 1 Lean Democratic, 2 Lean Republican, and 3 Safe Republican seats. Anyway, here are the maps:

Here is a link to Arizona’s current map: http://www.nationalatlas.gov/p…

Also, click the maps if you want the full image

Photobucket

North Arizona

Photobucket

South Arizona

Arizona’s 1st Congressional District Paul Gosar (R) Blue

Partisan Data: McCain (estimated) 55%

Demographics: 19.2% Native American, 17.1% Hispanic, 59.5% White

Demographics 18+: 16.7% Native American, 14.6% Hispanic, 64.7% White

Old Demographics: 22.4% Native American, 16.4% Hispanic, 58.4% White

Communities: Flagstaff, Prescott, Sierra Vista

Status: Lean Republican

The 1st district does not undergo major changes as it loses Florence and Coolridge in Pinal County. The 1st district picks up all of Cochise County from the 8th district. Cochise County voted 59% for McCain and has large numbers of military members. It also helps make the district more Republican. The 1st district also loses part of Republican Gila County.  Although these changes probably make Gosar’s district a point more Republican, he can still face a tough race. Ann Kirkpatrick (D), the former representative of the 1st district may run. She was one of the few Democrats in a district McCain won to vote against both the Stupak Amendment and the Affordable Care Act. She lost by 6 points which is not a nail biter but narrower than expected. A possibility though is that a Native American candidate may challenge her in the primary.  A possible candidate is openly gay Navajo State Senator Jack Jackson (D) who almost ran for the 1st congressional district in 2006. On the other hand, Kirkpatrick has support with the Navajo Community because she received endorsements in 2010 from many Navajo leaders including Dr. Peterson Zeh, the Navajo Nation President in 2010. This may encourage Navajos, the largest Native American tribe in the 1st district to support Kirkpatrick instead of supporting a Navajo politician for the seat.

Arizona’s 2nd Congressional District Trent Franks (R) Green

Partisan Data: McCain (estimated) 62%

Demographics: 17.6% Hispanic, 72.6% White

Demographics 18+: 14.1% Hispanic, 77.3% White

Old Demographics: 14.2% Hispanic, 78.4% White

Communities: Lake Havasu City, Surprise, Peoria

Status: Safe Republican

The 2nd district undergoes a few changes. It gains conservative La Paz County from the 7th district and keeps the string to the Hopi Reservation intact. The lines there may look convoluted but the Hopi do not want to be represented in the same district as the Navajo so the 2nd district represents them. The 2nd district also retains western Maricopa County which is one of the fastest growing areas in the state. Surprise had 39,000 people in 2000 but has 117,000 today. Most of these newcomers are Republicans and the 2nd becomes more Republican as it loses some Hispanic precincts in Glendale. Franks should have no problems winning reelection in this conservative district.

Photobucket

Phoenix Area

Arizona’s 3rd Congressional District Ben Quayle (R) Purple

Partisan Data: McCain (estimated) 55%

Demographics: 19.2% Hispanic, 70.4% White

Demographics 18+: 15.8% Hispanic, 74.6% White

Old Demographics: 14.1% Hispanic, 78.5% White

Communities: Phoenix, Glendale, Paradise

Status: Lean Republican

The 3rd district becomes a point more Democratic as it loses Republican areas in northern Maricopa County such as Cave Creek and Carefree. The 3rd district gains a few Hispanic precincts in Glendale but retains its center in northern Phoenix. Although Quayle won by 11 points in 2010, it was a Republican year and his district is growing more Democratic. Also, Quayle is very conservative and ran an ad saying “Obama was the worst president ever” so his far right views could hurt him against a moderate Democrat in a Democratic year. Jon Hulburd (D) who challenged Quayle last year could run again in 2012 when Obama will probably contest Arizona.

Arizona’s 4th Congressional District Ed Pastor (D) Red

Partisan Data: Obama (estimated) 65%

Demographics: 8.1% African American, 59.8% Hispanic, 26.0% White

Demographics 18+: 8.3% African American, 53.2% Hispanic, 32.2% White

Old Demographics: 7.5% African American, 58.0% Hispanic, 29.3% White

Communities: Phoenix

Status: Safe Democratic

The 4th district’s lines stay extremely similar to the current ones but there are a couple of changes. The 4th district picks up a few Hispanic precincts from the 3rd district near the intersection of Northern Ave. and Route 17. The 4th also gives a few heavily Hispanic precincts on the eastern Phoenix border to the 5th district in order to make the 5th district more winnable for a Democrat. Besides these minor changes, the 4th district’s lines stay extremely similar to their current form. The district remains heavily Hispanic and Democratic.

Arizona’s 5th Congressional District Dave Schweikert (R) Yellow

Partisan Data: Obama (estimated) 52%

Demographics: 5.1% African American, 4.5% Asian, 30.2% Hispanic, 55.2% White

Demographics 18+: 4.9% African American, 4.7% Asian, 25.2% Hispanic, 61.2% White

Old Demographics: 2.7% African American, 3.3% Asian, 13.3% Hispanic, 76.8% White

Communities : Scottsdale, Tempe, Mesa

Status: Lean Democratic

This district undergoes major changes and becomes more Democratic as it loses conservative northern Scottsdale. To compensate for losing northern Scottsdale, the 5th district gains Hispanic neighborhoods in Mesa, Chandler and Phoenix. The less Hispanic parts of Mesa and Chandler are in the conservative 6th district. These changes bring the district’s Hispanic population up to 29% and the 18+ population to 24%. With the addition of the Hispanic areas, the district becomes more Democratic so Democrats have a stronger shot at winning here. Harry Mitchell (D), the district’s representative in 2010 will be 72 at the time of the 2012 election but he may run. If he does not, possible candidates include his son Mark Mitchell (D), the Vice Mayor of Tempe. Arizona Senate Minority Leader Dave Schapira (D) also from Tempe could run here too.

Arizona’s 6th Congressional District Jeff Flake (R) Teal

Partisan Data: McCain (estimated) 64%

Demographics: 14.7% Hispanic, 75.1% White

Demographics 18+: 12.1% Hispanic, 78.8% White

Old Demographics: 17.2% Hispanic, 76.6% White

Communities: Apache Junction, Gilbert, Mesa

Status: Safe Republican

The area around Mesa and Apache Junction is one of the fastest growing areas in the nation so the 6th district had to shed population. It grew more Republican as well because it lost western Chandler and western Mesa, both swing areas with a growing Hispanic population. The 6th district also gained the Gila River Indian Reservation which is Democratic but should not alter the political leanings of the 6th district much. Although this district is too conservative to elect a Democrat, the Republicans could face a bruising primary if Jeff Flake (R) retires to run for Senate. The Republican bench is large here and potential candidates include State Senator Thayer Veschoor (R), State Senator Chuck Grey (R), Mesa Mayor Scott Smith (R) or Superintendent of Public Instruction John Huppenthal (R). If Huppenthal ran, he would probably win the primary due to his power as the former Senate Majority Leader but he may want to remain the Superintendent of Public Instruction. Anyway, unless a powerful candidate such as Huppenthal ran who can clear the field, the 6th district will face a large primary.

Photobucket

Tucson Area

Arizona’s 7th Congressional District Raul Griljava (D) Gray

Obama (estimated) 59%

Demographics: 58.0% Hispanic, 4.0% African American, 31.7% White

Demographics 18+: 52.6% Hispanic, 4.0% African American, 37.5% White

Old Demographics: 2.8% African American, 50.6% Hispanic, 38.6% White

Communities: Phoenix, Yuma, Tucson

Status: Likely Democratic

Griljava won by 6 points in a closer than expected race against teabagger Ruth McClung (R) despite his district’s high Hispanic population. I made some changes to his district in order to strengthen him. Also, his district’s current Hispanic 18+ population is below 50% so making Griljava’s district more Hispanic helps boost the Hispanic 18+ population above 50%. It is important to keep the Hispanic 18+ population above 50% because the VRA requires that some districts be not only minority majority but have an 18+ population above 50% too.

Arizona’s 8th Congressional District Gabrielle Giffords (D) slate blue

Partisan Data: Obama (estimated) 50%

Demographics: 29.2% Hispanic, 60.8% White

Demographics 18+: 24.7% Hispanic, 65.9% White

Old Demographics: 18.2% Hispanic, 73.9% White

Communities: Tucson, Oro Valley, Catalina

Status: Likely Democratic if Giffords runs, lean Democratic if not

First, I wish Giffords a full recovery from the Tucson shooting last January. If she recovers fully but decides not to return to politics, it is possible her husband Mark Kelly (D), one of the astronauts on the Endeavor will run in her place. Spouses of representatives often replace the representative when the representative is unable to run. Lois Capps (D) in Santa Barbara, Ca replaced Walter Capps (D), Mary Bono (R) replaced Sonny Bono (R) in Riverside County, Ca. Spouses are not always successful though as Stephanie Moore (D) learned when she unsuccessfully ran for her husband’s seat in Kansas. Anyway, if Giffords wants to return to politics, she can run for her House seat or Jon Kyls’ (R) open U.S Senate seat. Even if she does not run for the 8th district, the Democrat here will have a more favorable district. Giffords won last year by 4,000 votes and I removed all of Cochise County which she lost by 4,000 votes. I also removed all her district’s territory in Pinal County which she lost by 1,200 votes. If the election were held under her district’s current lines excluding Cochise and Pinal Counties, Giffords would win by 9,200 votes. Her district becomes even safer and more Tucson centered as it gains part of heavily Hispanic South Tucson from the 7th district and loses conservative areas near Picture Rocks. Although this is not a safely Democratic district, Tucson’s increased clout here will make it easier for Giffords or her replacement to win.

Arizona’s 9th Congressional District Vacant Cyan

Partisan Data: McCain (estimated) 58%

Demographics: 21.0% Hispanic, 69.1% White

Demographics 18+: 17.9% Hispanic, 72.9% White

Old Demographics: N/A

Communities: Scottsdale, Casa Grande, Marana

Status: Safe Republican

The lines on this map remove Republican areas from the 1st, 5th, 6th, 7th and 8th district and I combined those areas in the new 9th district. Those areas include northern Scottsdale in Maricopa County, all of Pinal County except for the Gila River reservation and Apache Junction, part of Gila County and Marana in Pima County. This district is too conservative for a Democrat to win but there could be a competitive Republican primary. Possible candidates could be State Senator Steve Smith (R) from Pinal County or State Senator Michelle Reagan (R) from Scottsdale.  

By what margin will Bob Shamansky win?

View Results

Loading ... Loading ...