Redistricting Washington: Can you think like a commission?

It’s hard to tell how a nonpartisan commission will draw maps. As we’ve seen with Iowa’s first round of maps, they can make some unusual choices. For this map, I tried to hew as closely to the existing districts as possible, within reason; there are some odd territorial splits (such as WA-09 jumping across Puget Sound) that might make more sense to a local than to a East Coast resident like myself.

I tried to limit city and county splits where possible, but sometimes it was unavoidable. The biggest split is Tacoma, half of which I had to put in WA-06 and half in WA-09. I also tried to either ignore partisan data or encourage competitive districts. Thanks to the way the map is set up currently, the latter was pretty easy to accomplish; there are five districts that I would consider competitive (WA-02, 06, 08, 09, and 10).

State

Seattle area

WA-01 (blue) – Instead of jumping across Puget Sound, it stretches across northern King County and farther up into Smohomish. Old district: 56.2% Murray, new district: 56.5% Murray.

WA-02 (green) – Expands very slightly, picking up a little bit of Snohomish and dropping the one random descent into eastern King County. Old district: 50.5% Murray, new district: exactly 50.0% for each (the margin is 118 votes in favor of Rossi).

WA-03 (purple) – This one probably changes the most. Northern end of the district is chopped off, and it moves east to Yakima. Old district: 52.5% Rossi, new district: 55.5% Rossi.

WA-04 (red) – Moves east, losing Yakima and gaining Walla Walla. Old district: 64.4% Rossi, new district: 63.9% Rossi.

WA-05 (yellow) – Loses Walla Walla, gains bits of Franklin County. Old district: 58.6% Rossi, new district: 58.4% Rossi.

WA-06 (teal) – Drops part of Tacoma, picks up islandy parts on the west side of Puget Sound. Old district: 53.1% Murray, new district: 53.0% Murray.

WA-07 (grey) – Seattle and a bit of the suburbs south of it. Old district: 81.0% Murray, new district: 81.5% Murray.

WA-08 (light purple) – Loses Pierce County. Adds a bit of the inner Seattle-area suburbs. Old district: 50.8% Rossi, new district: 53.0% Murray.

WA-09 (sky blue) – Loses the southwestern swath of territory, picks up a bit on the northern and eastern borders. Old district: 52.8% Murray, new district: 54.1% Murray.

WA-10 (magenta) – The new seat. Most of Pierce County, all of Thurston County, and some parts south and southwest of Thurston. 50.9% Rossi.

I don’t know if anyone got drawn out of their districts, but the only incumbent that would probably be seriously miffed is Reichert. Losing Pierce County would be a blow to his re-election chances. He could always move to the new WA-10, though.

Redistricting Arkansas: One map! Two maps! Three Glorious Maps!

Everyone was aghast at the proposed map that came out of one of the houses of the Arkansas legislature recently. The consensus seemed to be that it was a dummymander, as likely to end up with a 4-0 Republican delegation as it was a 3-1 Democratic delegation. I would argue that  2-2 split would be the safest, and sanest, way to draw the map. So I’ve come up with a few maps that would likely give that split.

Map 1: A Bipartisan Compromise

AR-01 (blue) – 65 McCain, 32 Obama

AR-02 (green) – 51 McCain, 48 Obama.

AR-03 (purple) – 64 McCain, 34 Obama.

AR-04 (red) – 56 McCain, 41 Obama.

In this map, AR-01 is ceded to the Republicans, AR-02 is made more of a swing district, AR-03 remains pretty much the same, and AR-04 is made slightly more Democratic.

The problem with this one is that AR-04 remains vulnerable. With Ross exiting the seat in 2014 to run for Governor, it would be a tough seat to hold. On the other hand, AR-02 becomes easier to pick up.

Map 2: Let’s Make the White Democrats Unhappy

This map includes the Fayetteville tentacle from the proposed map. AR-02 is redrawn into a black-heavy Mississippi+Little Rock district. I don’t have numbers on this one handy, unfortunately, but AR-02 easily becomes an Obama district, probably around 55-44 Obama. AR-04 moves slightly to the Democrats, I’d guess it’s about 57-41 McCain.

This would please the black Democrats in the legislature; they’ve been pushing for a district that gives them a shot of electing one of their own to Congress. Of course, the white Democrats would not be happy with this arrangement, as many of them would be shut out of the chance to go to Congress.

Map 3: Let’s Make the Black Democrats Unhappy

AR-01 (blue) – 53 McCain, 45 Obama

AR-02 (green) – 66 McCain, 32 Obama

AR-03 (purple) – 64 McCain, 34 Obama

AR-04 (red) – 53 McCain, 45 Obama

Third and finally is a map designed to elect two Blue Dog type Democrats. In this map, Little Rock is added to Mike Ross’s district (putting Griffin in with him, but Griffin could just move to the safe Republican AR-02), while AR-01 is reconfigured by shedding some of the Crawford-friendly counties to the north and adding some Dem-friendly counties to the south. Ross would probably not be happy with Little Rock in his district, but he’s only got one more primary to get through until he can go run for Governor and be out of our hair. The advantage here is an open AR-04 would not be an almost-automatic flip to the Republicans; the Democrats would have a good shot at retaining the seat.

Now, as the white Democrats got the shaft in the last map, this map gives it to the black Democrats. AR-01’s VAP is only 28% black, and AR-04’s is 23% black, which would make it tough for one of the black legislators to win a primary in either district.

So there you go, three ideas, all of which are, in my opinion, better than the one proposed by the actual legislators.

GQR/Democracy Corps poll: GOP House majority in jeopardy already

Buyer’s remorse is setting in quickly, according to Democratic pollster Greenberg Quinlan Rosner.

GQR polled 50 House districts currently held by Republicans which are expected to be major Democratic targets in 2012. The results indicate that the Republican House majority is already endangered, less than three months into Speaker John Boehner’s regime.

From GQR’s polling memo:

The Republican incumbents in these districts, 35 of them freshmen, remain largely unknown and appear very vulnerable in 2012 (depending on redistricting). In fact, these incumbents are in a weaker position than Democratic incumbents were even in late 2009, or Republican incumbents were in 2007 in comparable surveys conducted by Democracy Corps.

These incumbents, identified by name, have an average approval rating of 35 percent across the 50 districts, with 25 percent disapproving. Another 38 percent were not able to give the candidates a rating, suggesting lack of visibility. This is about 10 points lower than the approval rating Democratic incumbents held in July of 2009 (with comparable disapproval rating).

More importantly at this early point, just 40 percent of voters in these districts say that they will vote to reelect their incumbent (asked by name in each district), while 45 percent say that they “can’t vote to reelect” the incumbent.

This leads to a congressional race that is dead-even in the battleground. After winning these seats by a collective 14 points in 2010, these Republicans now lead generic Democratic challengers by just 2 points, 44 to 46 percent, and stand well below the critical 50 percent mark. The race is dead even in the top tier of the 25 most competitive seats‚ 46 percent for the Democrats versus 45 percent for the Republicans. In the next 25 seats, the Republicans have a slight 42 to 47 percent advantage.

You can find a list of the 50 districts polled here. House junkies will recognize most of the usual suspects there – IL-13 and IL-16 are probably the biggest surprises.

In the summer of 2009, the 40 vulnerable Democrats tested in this poll actually had a six-point lead; 36 of them wound up losing. And at this time in 2007, the 35 most vulnerable Republicans had the same six-point lead; 19 of them lost reelection.

Compared to that, a 2-point lead for GQR’s 50 most vulnerable Republicans doesn’t look very strong. And if even half these seats are lost, there goes the Republican majority.

Now, the Republican incumbents have a couple things on their side. One is time; a lot can happen in the next year and a half. Another is redistricting; while Republicans don’t control the redistricting process for all these incumbents, they can make some of them safer, and they can also endanger a few of the remaining Democrats to balance out losses.

Still, these are bad early indicators for the new Congress. Voters don’t know their new representatives very well, and they don’t like them especially well, and they seem quite prepared to vote Democratic in 2012.

GQR/Democracy Corps poll: GOP House majority in jeopardy already

Buyer’s remorse is setting in quickly, according to Democratic pollster Greenberg Quinlan Rosner.

GQR polled 50 House districts currently held by Republicans which are expected to be major Democratic targets in 2012. The results indicate that the Republican House majority is already endangered, less than three months into Speaker John Boehner’s regime.

From GQR’s polling memo:

The Republican incumbents in these districts, 35 of them freshmen, remain largely unknown and appear very vulnerable in 2012 (depending on redistricting). In fact, these incumbents are in a weaker position than Democratic incumbents were even in late 2009, or Republican incumbents were in 2007 in comparable surveys conducted by Democracy Corps.

These incumbents, identified by name, have an average approval rating of 35 percent across the 50 districts, with 25 percent disapproving. Another 38 percent were not able to give the candidates a rating, suggesting lack of visibility. This is about 10 points lower than the approval rating Democratic incumbents held in July of 2009 (with comparable disapproval rating).

More importantly at this early point, just 40 percent of voters in these districts say that they will vote to reelect their incumbent (asked by name in each district), while 45 percent say that they “can’t vote to reelect” the incumbent.

This leads to a congressional race that is dead-even in the battleground. After winning these seats by a collective 14 points in 2010, these Republicans now lead generic Democratic challengers by just 2 points, 44 to 46 percent, and stand well below the critical 50 percent mark. The race is dead even in the top tier of the 25 most competitive seats-46 percent for the Democrats versus 45 percent for the Republicans. In the next 25 seats, the Republicans have a slight 42 to 47 percent advantage.

You can find a list of the 50 districts polled here. House junkies will recognize most of the usual suspects there – IL-13 and IL-16 are probably the biggest surprises.

In the summer of 2009, the 40 vulnerable Democrats tested in this poll actually had a six-point lead; 36 of them wound up losing. And at this time in 2007, the 35 most vulnerable Republicans had the same six-point lead; 19 of them lost reelection.

Compared to that, a 2-point lead for GQR’s 50 most vulnerable Republicans doesn’t look very strong. And if even half these seats are lost, there goes the Republican majority.

Now, the Republican incumbents have a couple things on their side. One is time; a lot can happen in the next year and a half. Another is redistricting; while Republicans don’t control the redistricting process for all these incumbents, they can make some of them safer, and they can also endanger a few of the remaining Democrats to balance out losses.

Still, these are bad early indicators for the new Congress. Voters don’t know their new representatives very well, and they don’t like them especially well, and they seem quite prepared to vote Democratic in 2012.  

Another 8-0 Maryland

Here is my take on an 8-0 Maryland. I must thank abgin for this incredible inspiration of using stripe-style gerrymandering (the famous map he did of NY). I employed this technique in reverse – I asked myself, how can I link all of these heavy Dem areas to Republican areas to dilute their votes? I thought of where their votes are concentrated, and the biggest source is Northern Maryland and the Baltimore Suburbs.

So, I set out to link Dem heavy areas to Republican areas in Northern Maryland, and it worked well. The map is not too bad looking, although Ruppersberger and Sarbanes would have trouble fitting into this map, but they can move. Hoyer and Van Hollen would have decent district and maintain a lot of their territory. Barlett and Harris are completely drawn out, and I managed to make two VRA districts that are 51% black, while they take in as many heavy R precincts as possible in Northern Maryland the Baltimore Suburbs so they can leave liberal white areas and other AA areas to shore up other districts.

I wanted the Obama-McCain lean to be roughly 60%-40%, and I did well in that regard, I think only one is 57% Obama and the rest are over 58% Obama, so all districts are around D+5 to D+8, with the VRA districts being more Dem heavy. The only district I think that would be in trouble would be the Eastern Shore based one, but if Kratovil runs, it is his. So, here you go!

Below is the state as a whole. The CDs aren’t numbered well on my map, since I ended up editing a lot, so I’ll just leave the CD numbers off the map and make different numbers.

CD1 in Perriwinkle: Panhandle. Hagerstown, Frederick, Potomac – This district is similar to the ones others have posted to make this district less friendly to Barlett (currently the 6th.) There is no way he would win this district. This has much of Van Hollen’s 8th district, so I would assume he would run here. If he doesn’t live here, the move isn’t far. (Pictures are below)

Obama:59% McCain:40%

White:70% Black:10% Asian:9% Hispanic:8%

CD2 in Grey: Silver Spring and DC burbs extending to Northern Border – The worst thing about this district is that there seems to be no clear incumbent here. Cummings would move to a VRA district, Van Hollen would want the 1st (he could take this if he wants too I guess, his choice) so I suppose this would be a new Democratic Representative. Bartlett could try running here, but I doubt he’d come close. Fairly neat looking district.

Obama:60% McCain:38%

White:61% Black:13% Asian:8% Hispanic:16%

CD3 in Dark Green: College Park, Columbia and the Northern Border – Takes in heavily Dem areas in the DC burbs, through Columbia and then sucks up heavily R areas up north on the border. This district also presents a huge problem for current reps. I guess Ruppersberger may be willing to make the move… Cummings again wouldn’t be here, and there really is no one else who I can see running here.

Obama:59% McCain:39%

White:55% Black:24% Asian:8% Hispanic:11%

CD4 in Green: Eastern DC suburbs stretching to Baltimore Suburbs – The challenge I had with this map in general was diluting suburban Baltimore while keeping two majority black districts. This was one part in solving that problem. I was able to keep this 51% AA while stretching it from heavily AA precincts outside of DC to heavily Republican areas South and East of Baltimore City.  This district does take a lot of the AA territory from Donna Edwards current district, MD-4, so she should run here and be safe.

Obama:72% McCain:27%

White:41% Black:51% Asian:2% Hispanic:5%

CD5 in Purple: Southern Maryland to Annapolis– This district pretty much drew itself after the two black majority districts were drawn. I could take remaining AA precincts outside of DC, pull them in with rural more R leaning areas in Southern Maryland, then bring them to Annapolis naturally. Steny Hoyer would have a lot familiar territory, but now he gets Annapolis and AA areas outside of DC instead of areas NE of DC. Still should be a fairly easy hold for him.

Obama:60% McCain:39%

White:62% Black:30% Asian:3% Hispanic:4%

CD6 in Yellow: Northern Baltimore, Baltimore Suburbs, down to liberal areas northeast of DC– One of the nastier districts, this links two areas of Dem strength leftover from other districts – liberal areas between DC and Baltimore, and northern parts of Baltimore itself. I was able to perfectly combine these, while incorporating Baltimore burbs to dilute Republican votes while keeping this district solidly Dem leaning. Maybe Sarbanes would move to this district? Or Ruppersberger? Those two really are the odd men out in general. since their current districts are disgusting. If they want their jobs with this map, they need to move.

Obama:58% McCain:40%

White:63% Black:26% Asian:6% Hispanic:4%

CD7 in Blue: Western Baltimore City, Baltimore Burbs and Rural areas in Northern Maryland. – I had a hard time trying to keep this at 51% black while at the same time sucking up as much anti-Obama votes as possible. To do this I had to find the anti-Obama votes (much like abgin did in NY, where he drew all districts to NYC to find Dem votes.) Once I adopted that strategy, I was able to do the wrap-around kind of districts near Baltimore for CD6 and CD7 in my map. This naturally gave way to making all districts have a north-south orientation in order to dilute Republican strength in Rural North Maryland. Cummings keeps a lot of his old territory in Baltimore, so this district would fit him nicely.

Obama:71% McCain:27%

White:42% Black:51% Asian:3% Hispanic:3%

CD8 in Red: Eastern Shore stretching to Baltimore City– I’m sorry I divided you into 4 pieces, Baltimore. But Kratovil would love this district. It is fairly Democratic, even someone more liberal than Kratovil can win here. But this would be a perfect fit for him. Harris would never win. I did use a tiny, TINY bit of water contiguity near Perryville where the shore meets to mainland in a U-shape (you can kinda see it, its not too bad.) I did this to keep the district from having to take in a couple R-heavy precincts, and the district honestly doesn’t look any worse than any MD district currently.


Obama:57% McCain:42%

White:66% Black:27% Asian:2% Hispanic:3%

The Link Between Senate and Presidential Voting

After seeing a lot of people predict that Ben Nelson and Scott Brown will lose because of their states’ respective presidential voting patterns, I was reminded of a section of one of my political science textbooks from last semester. In Chapter 6 of The Politics of Congressional Elections, the author, Gary Jacobson, details the events leading up to each set of congressional elections from 1980 to 2006 as well as the overall results. One thing I found particularly interesting at the time was that the percentage of Senate seats won by the party of the presidential candidate that also won that state has been on the rise over the past decade. Here are the relevant passages from page 218-219 of the book:

The same trend toward greater consistency in voting for president and U.S. representative in 2004 (Figure 6-3) appeared in Senate elections as well, resulting in a four-seat addition to the Republicans’ Senate majority. . . The Democrat’s main problem was again structural. They had to compete with the more-efficient distribution of Republican voters. Although Gore had won the national vote in 2000, Bush carried thirty of the fifty states, including twenty-two of the thirty-four states with Senate contests in 2004. Democrats had to defend ten seats in states Bush had won, including five left open by retirements, all in the South, where support for Democrats has been eroding for several decades. Meanwhile, Republicans were defending only three seats in states won by Gore. . . Seven of the eight Senate seats that changed party hands in 2004 went to the party that won the state in the 2000 and 2004 presidential elections; Salazar’s victory was the lone exception. . . More generally, twenty-seven of the thirty-four Senate contests were won by the party whose presidential candidate won the state’s electoral votes, tying 1964 for the highest level of congruence in president-Senate election results in the past half century. When the 2004 winners were added to the continuing Senate membership, fully 75 percent of Senators represented states where their party’s candidate won the most recent presidential election, the highest proportion in at least fifty years.

So what does this mean for the parties going into 2012. More below the fold.

In 2012, Democrats have 23 Senate seats up for election. These are listed below and the states in bold were won by McCain in 2008.

Democratic-Held Senate Seats

California

Connecticut

Delaware

Florida

Hawaii

Maryland

Michigan

Minnesota

Missouri

Montana

Nebraska

New Jersey

New Mexico

New York

North Dakota

Ohio

Pennsylvania

Rhode Island

Vermont

Virginia

Washington

West Virginia

Wisconsin

In contrast, Republicans only have 10 seats up in 2012. These are listed below and the states in bold were won by Obama in 2008.

Republican-Held Senate Seats

Arizona

Indiana

Maine

Massachusetts

Mississippi

Nevada

Tennessee

Texas

Utah

Wyoming

So right away you can see that each party holds Senate seats that would tend to go to the opposite party given normal conditions. Republicans should win Missouri, Montana, Nebraska, North Dakota, and West Virginia while Democrats should pick-up Indiana, Maine, Massachusetts, and Nevada. That works out to +1 R even after removing West Virginia and Indiana which are not likely to flip unless something dramatic happens such as Lugar losing to a Tea Party challenger in the primary. Maine is harder to judge, though I predict Snowe would win if she survives a primary challenge, bumping Republicans to +2.

One problem with this analysis is that it is based on the results of the 2008 elections because I can’t see the future and tell you who will win each state in 2012. Some speculation is possible though based on the results from 2008 and recent polls. The only Republican-held seat won by McCain that Obama has a realistic chance of winning is Arizona which he lost by 8.5%. Arguments can be made for Texas or maybe Tennessee but that’s unlikely barring a Regan vs. Mondale type wave. Obama also has a chance at winning Missouri (lost by 0.13%), Montana (lost by 2.38%), and North Dakota (lost by 8.65%) which would increase the chances of holding these Democratic Senate seats.

The Republican presidential candidate could win states with Democratic-held seats in Virginia (lost by 6.3%), Florida (lost by 2.81%) and Ohio (lost by 4.58%). Other states that seem less likely to flip right now but could depending on the environment include Pennsylvania (lost by 10.31%) and Michigan (lost by 16.44%). States that McCain lost last time but may be won by the Republican presidential candidate in 2012 include Indiana (lost by 1.03%) and possibly Nevada (lost by 12.49%). Winning back these states would increase the chance that Republican incumbents could hold their seats.

So where does all of this leave us? Here are three scenarios.

1. Obama wins all of his 2008 states and most Senate seats go with the presidential winner that state – R+1 or 2

Democrats pickup Massachusetts and Nevada, possibly Maine, and fail to pickup Indiana.

Republicans pickup Missouri, Montana, Nebraska, and North Dakota and fail to pickup West Virginia.

2. Obama improves on his 2008 map and most Senate seats go with the presidential winner in that state – D+2 or 3

Democrats pickup 4 or 5 of Arizona, Indiana, Maine, Massachusetts, and Nevada.

Republicans pickup Nebraska and North Dakota and fail to pickup West Virginia.

3. Obama does worse than his 2008 map and most Senate seats go wi the presidential winner in that state – R+2 to 8

Democrats pickup 0 to 2 of Massachusetts and Nevada and fail to pick up Maine.

Republicans pickup 4 to 8 of Florida, Michigan, Missouri, Montana, Nebraska, North Dakota, Ohio, Pennsylvania, Virginia, and West Virginia.

Senate Democrats’ best chance at keeping their majority involves Obama expanding the playing field and it appears this is the plan after Charlotte was chosen to be the site of the DNC. With the continued polarization of electorate, it may not be possible for vulnerable senators like Tester, McCaskill, Webb, and Brown to localize the election in hopes of drawing crossover support. This could certainly help their chances but the trends over the last decade indicate that their electoral survival depends heavily on the President.

By what margin will Bob Shamansky win?

View Results

Loading ... Loading ...

Republican House Targets for 2012

The key difficulty in drawing up target lists of potentially vulnerable House Republicans is, of course, redistricting. It’s simply hard for us to know what most districts will look like come 2012. But some seats simply can’t or won’t change too much, whether by virtue of geography, politics, law or custom. I’m thinking, for instance, that the 2012 edition of Charlie Bass’s NH-02 is unlikely to look very different from the 2010 version – and that Bass will be his usual weaksauce self, all but inviting a top-tier challenge. And Bass’s next-door neighbor, the corrupt Frank Guinta, will probably wind up in the same boat.

These can’t be the only two guys to make our early lists, though. Who else do you think will have a pretty stable district, and ought to face some trouble?

South Carolina 2-VRA Seats “This is Immoral”

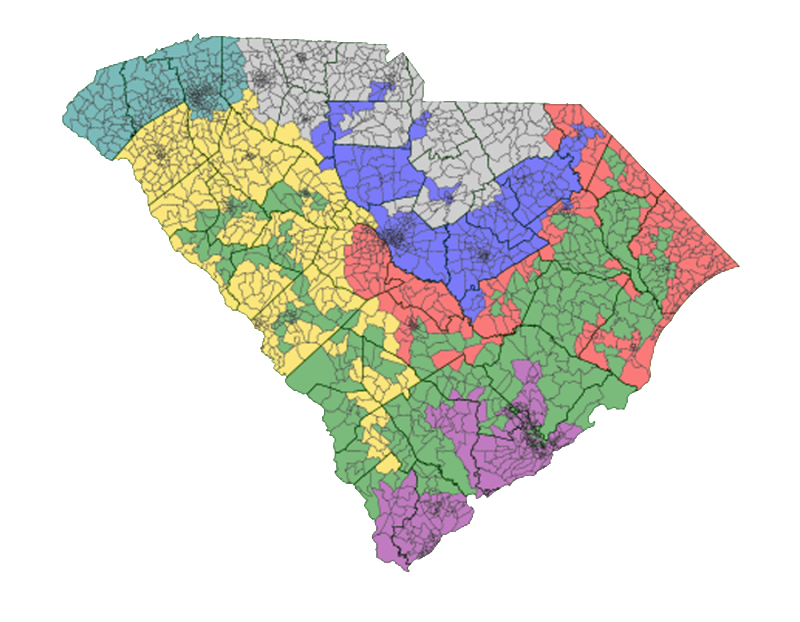
This is a quick attempt at South Carolina with 7 seats and 2 Minority Majority districts.

SSPers speculated that there should be a second VRA seat in South Carolina, as there is a substantial black population. Personally I do not think South Carolina should have gotten another seat, the data on Daves App shows South Carolina at 4.5 Million or so, and 2010 Census showed it at 4.6 M or 663,710 per district. I however feel that as long as the US House stays with 435 seats and the size of each constituency rises with each census apportionment, the utility of VRA seats are going to collapse onto themselves.

We see instances like Mel Watt (NC), Corrine Brown (FL), and Sanford Bishop (GA) that getting 50% of their districts Black is a hard order when trying to make a district that has at best moderate gerrymandering.

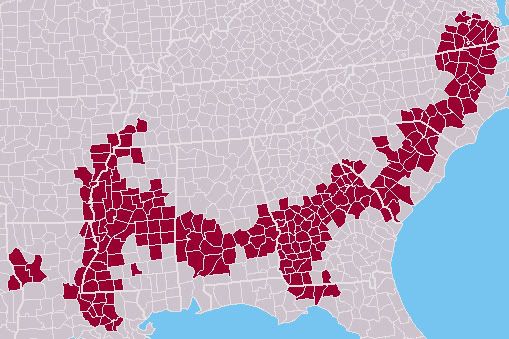
South Carolina has a large African American population 30% in the 2000 Census; however the population is way too spread out to make a coherent congressional district within a state. As seen here

Photobucket

And my map seen here

Photobucket

It just is too agressive to get a 50% district and a 49% district. Also notice that the 4th district (yellow) is just barely contiguous. This gerrymander will only see Clyburn, Scott and Dowdy  keep their seats I believe. It does really put Joe Wilson into a very strange district.

Potential GOP House targets in 2012

The GOP right now is in a very similar situation to the Dems after the 06/08 cycles. Having come off a very successful wave election where they picked up most of their potential targets, there simply aren’t as many Dem seats that the GOP can capture in 2012 as there were in 2010. Still, there’s actually a fairly decent list of seats that the GOP could target, not enough to give them gains like they had this year, but enough that they could pull off a 10-20 seat gain if 2012 turns out to be a good year for them. These are what I consider to be there best targets. I’m grouping these into three tiers. Tier 1 consists of seats that the GOP have a good chance of picking up. Tier 2 consists of seats that are probably uphill battles for the GOP, but certainly not out of their reach. Tier 3 consists of seats that are truly longshots, or are conditional on certain things happening that are far from certain right now.

Tier 1

*PA-04/12 (Critz/Altmire) Word is that these two will be packed into a seat together, and that seat will probably be pretty unfavorable to dems. If Critz and Altmire are forced to spend resources on a bloody primary battle that could hurt them in the general as well.

*KY-06 (Chandler) Anyone who wins by such a narrow margin as Chandler did is probably vulnerable in the next election.

*NY-23 (Owens) The margin between Owens and his GOP challenger was less than the vote won by Conservative Party candidate Doug Hoffman (Hoffman had dropped out but his name was still on the ballot). This seems to suggest that if the GOP could unite behind one good candidate here than they could win this district. Redistricting may determine how competitive this seat is, and that’s kind of a wild card right now.

*GA-12 (Barrow) Could be killed by GOP controlled redistricting.

*MI-09 (Peters) Peters won by a very narrow margin, and he will have to go into the next election with a GOP-drawn district.

*NC-08 (Kissell) The Gov has no say in redistricting under NC law, so this will be left up to the GOP legislature. It’s pretty easy to draw a terrible district for Kissell without really endangering anybody else.

*MO-03 (Carnahan) Pretty easy to see him losing in 2012. Whether or not he goes may depend on how much of STL is in the new district.

*CA-11/18/20 (McNerney/Cardoza/Costa) The CA redistricting commission is a wild card right now, but it seems likely to me that one of these guys will get a tough seat to run in. Some have speculated that McNerney’s seat will get axed to give a seat to the Inland Empire, and while it seems more likely to me that someone like Stark gets cut it’s still not impossible. Still, it seems like one of these seats will be competitive come 2012.

TOTAL: 9

That’s all the low-hanging fruit I can see right now for the GOP. Now on to the ones that will be a little harder for the GOP to pick up.

Tier 2

NC-07 (McIntyre) McIntyre is in a fairly similar situation to Kissell. If the NC GOP wants to be ambitious, they could try to take out both, which is certainly possible without fully going into dummymander territory. But it would be a little more ambitious. You could probably switch out NC-07 or NC-08 and it wouldn’t make much of a difference. They could kill either with redistricting, and possibly both.

IA-01/02/03 (Braley/Loebsack/Boswell)