Apportioning the US Senate: A Weekend Fantasia

This diary explores the following alternate reality: What if the US Senate was apportioned like the US House? One hundred members, single-member districts, distributed just like House seats (ie, every state gets one seat and then the rest are apportioned using the rule of equal proportions.)

Using 2010 data, the map would look like this:
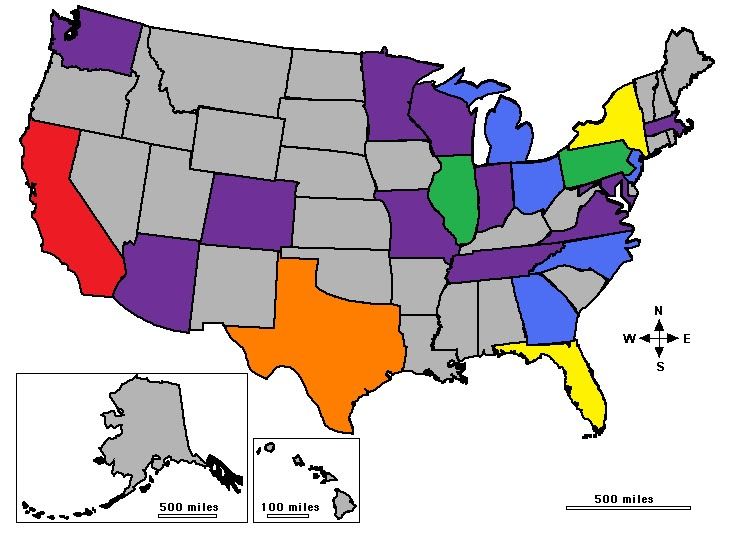
California, in red, would have 10 seats. Texas, in orange, would have 7. New York and Florida, in yellow, would have 5. Illinois and Pennsylvania, in green, would have 4. Georgia, North Carolina, Ohio, New Jersey, and Michigan – all in blue – would have 3. Eleven other states, in purple, would have their current 2. And the remaining twenty-eight states, in grey, would be down to 1.

Two seats would have moved as a result of the 2010 Senate reapportionment, with Texas and Colorado gaining at the expense of Ohio and New York.

(Figures are from the Census Bureau. Since we’re doing this just like the House, all you have to do is look at the House priority lists and cut it off at 100 instead of 435. See here for the 2010 data and here for the 2000 data.)

After the jump, I have maps for the 22 states that would have more than one senator in this alternate universe. Please feel free to post your own.

I’d also be very interested to hear who you all think would be in the senate in this alternate universe. I’m having a hard time figuring out how the one-third-at-time-up-for-election rule would work in a reapportioned body, so perhaps in the alternate universe, senators have four year terms and are elected at presidential midterm? That’s not a fixed rule for this hypothetical, just a guess.

Notes: The presentation of maps for states with more than one senator is sorted according to number of senators, then alphabetically. There’s a brief round up of the one-senator states at then end.

I’ve used the default colors throughout, so blue = CD-1, green = CD-2 purple = CD-3, red = CD-4, yellow = CD-5, teal = CD-6, grey = CD-7, slate blue = CD-8, cyan = CD-9 and pink = CD-10.

I’ve assumed that a compactionist ethic would be at play, and that minority opportunity districts would be favored, even if they’re not 50%+. Obviously, that’s another part of the alternate universe.

States with 3 or more senators

AKA those disadvantaged by the current system

California
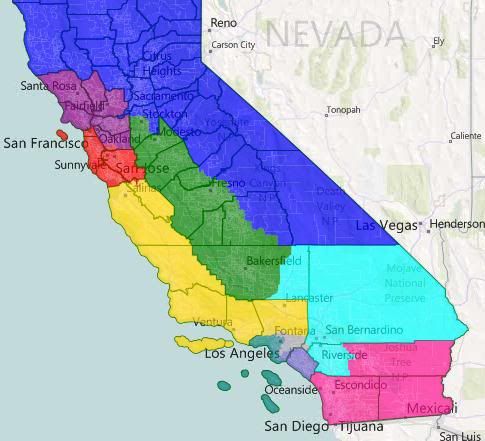


Overview
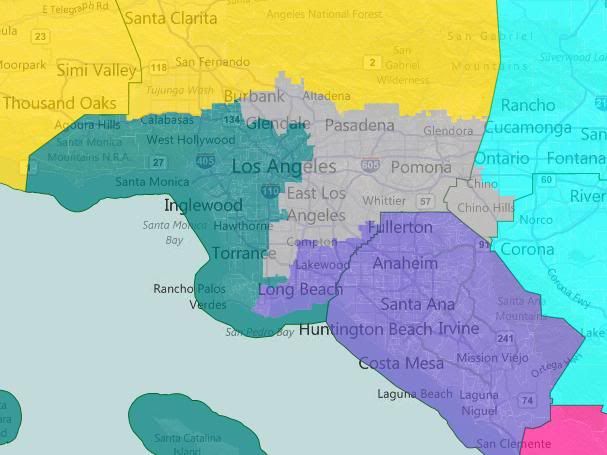


LA Detail

California has ten districts: (CD-1) North CA/Sacramento/Sierra Nevada, (CD-2) Central Valley, (CD-3) North Bay, (CD-4) South Bay, (CD-5) Central Coast, (CD-6) East LA County, (CD-7) West LA County, (CD-8) Orange County/Long Beach,

(CD-9) Inland Empire, and (CD-10) San Diego/Salton Sea.

CD-1 is the only one that’s majority-white by total population. CD-2, CD-5, CD-6, and CD-9 are plurality Hispanic. CD-07 is majority Hispanic.

My guess is that CD-3, CD-4, CD-6, and CD-7 would be safe Democratic, with the rest being some form of competitive (ie, between lean Dem and lean Rep). Say for the sake of argument that we would be holding two of them right now. That starts our running total at 6 D – 4 R.

Note: the voting block shapes for CA can be pretty large right now in Dave’s App. CD-6 is about 50k under populated with CD-07 about 50k over populated. If I swap the LA proper parts of CD-8 back to CD-6, that swaps to CD-8 being 30k under and CD-6 being 30k over. So, about half of that southern part of LA proper needs to go back to CD-6. For a fictional scenario, I figure this was an ok kludge.

Texas
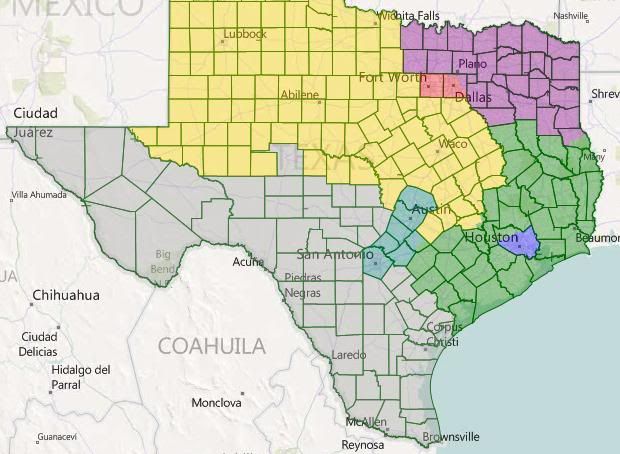
Texas has seven seats: (CD-1) Harris, (CD-2)Southeast Texas, (CD-3) Northeast Texas, (CD-4) Metroplex, (CD-5) North and Central Texas, (CD-6) San Antonio/Austin, and (CD-7) South Texas.

CD-7, of course, is heavily Hispanic. CD-1 is plurality Hispanic, and CD-4 and CD-6 are only plurality white.

I would think that CD-1 and CD-6 are easy gets for us, with CD-4 and CD-7 leaning our way. The other three are ubersafe for the GOP. Running total: Dem 10, Rep 7.

Florida
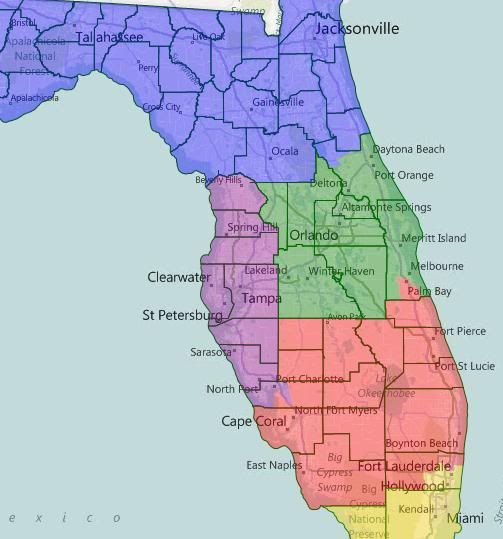
Five districts: CD-01 North Florida, CD-02 North Central Florida, CD-03 West Central Florida, CD-04 South Central Florida, CD-05 South Florida.

CD-05 is majority Hispanic, the rest majority white.

I’d like to think that these are all at least potentially competitive, but I’m going to be conservative here and say that we only hold one of these (Nelson in Orlando?). Running total: Dem 11, Rep 11.

New York
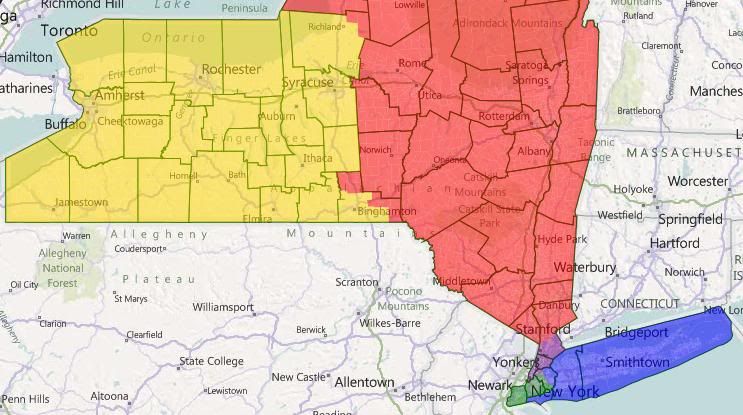


Overview
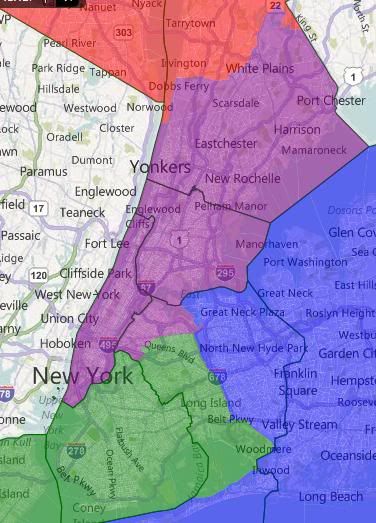


NYC Detail

Five districts: CD-01 Suffolk/Nassau/NW Queens, CD-02 Brooklyn/Staten Island/South Queens, CD-03 Manhatten/Bronx/Northwest Queens/South Westchester, CD-04 East Upstate, CD-05 West Upstate.

I forgot to save this map, so I don’t have racial stats. CD-02 and CD-03 were majority minority, I think.

Partisan breakdown here depends on whether 2010 factors into the equation. In a normal environment, I think CD-04 is the only truly vulnerable district, but we’ll spot the GOP CD-05 as well. Running total: Dem 14, Rep 13.

Illinois
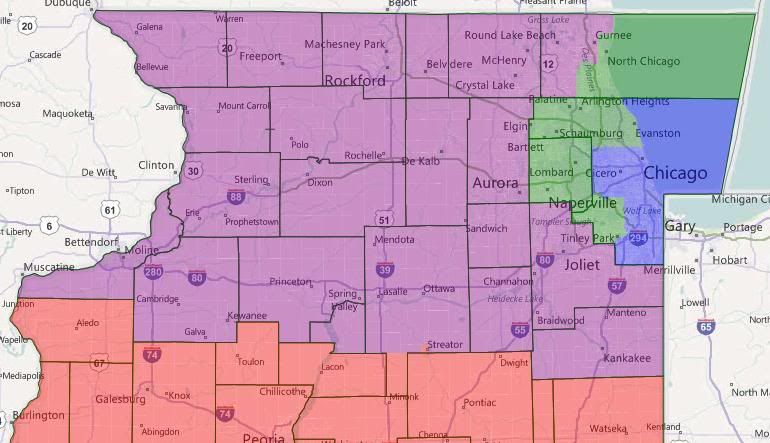
CD-01 Chicago, CD-02 Suburban Chicago, CD-03 Northern Illinois, CD-04 Southern Illinois. CD-01 is plurality black at 35% or so. The rest majority white. I’m going to call this a 2-2 split, so running total: Dem 16, Rep 15.

Pennsylvania
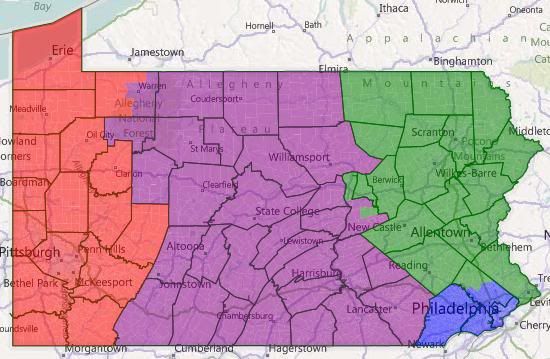
CD-01 Philadelphia, CD-02 Northeast PA, CD-03 Central Pa, CD-04 West PA. All majority white. I’m going to call this one a 2-2 split also, so running total Dem 18, Rep 17.

Georgia
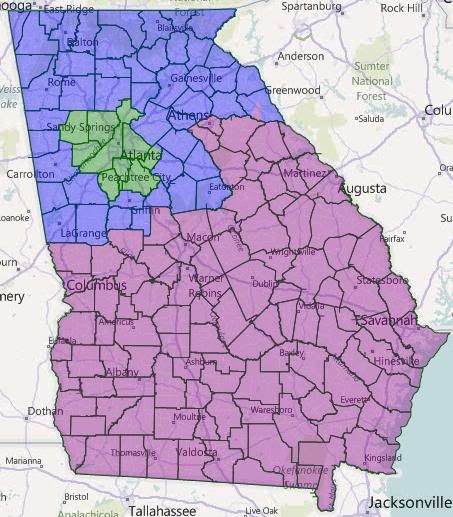
Three districts: CD-01 North Georgia, CD-02 Atlanta, CD-03 South Georgia.

Atlanta is plurality white and about 40% black, the rest are majority white.

I assume we’d take Atlanta and Republicans would get the other two. Running total: Dem 19, GOP 19.

Michigan
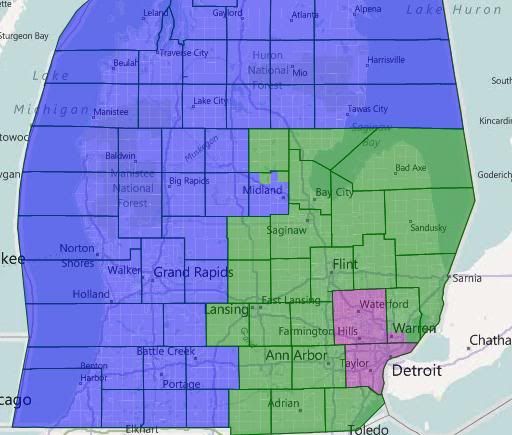
Three districts: CD-01 North and West Michigan, CD-02 Southeast Michigan, CD-03 Wayne/Oakland/South Macomb.

Looks like I forgot to save this map too. I’m pretty sure they’re all majority white.

CD-02 and CD-03 are safe Democratic (and would probably be represented by Stabenow and Levin, respectively.) CD-01 is likely Republican. Running total: Dem 21, GOP 20.

New Jersey
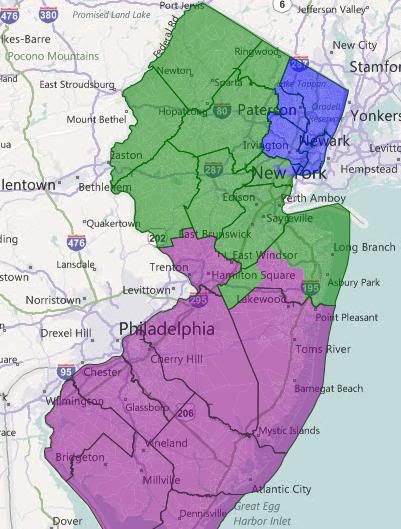
Three districts: CD-01 Greater Newark, CD-02 North Jersey, CD-03 South Jersey.

CD-01 is white plurality, the other two white majority.

I know a lot of Democratic strength is locked-up in CD-01, but we’d still be likely to hold at least two of these, right? Running total: Dem 23, GOP 21.

North Carolina
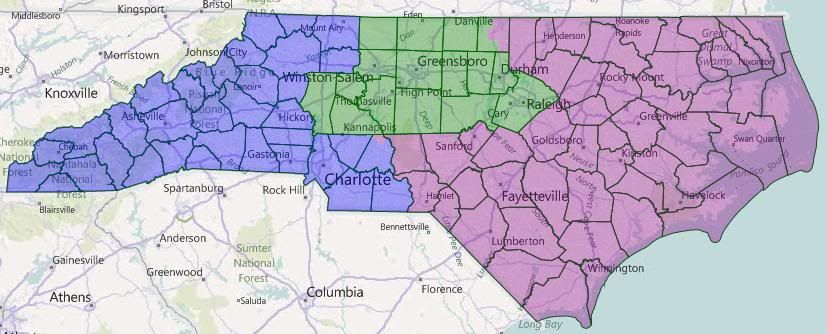
CD-01 Charlotte/West Carolina – Likely Republican?

CD-02 Triangle and Triad – Likely Dem

CD-03 East Carolina – Toss-up?

All are majority white; CD-03 has the highest black percentage at 27%. I’m going to give us a Blue Dog-ish Dem in the east, so running total: Dem 25, Rep 22.

Ohio
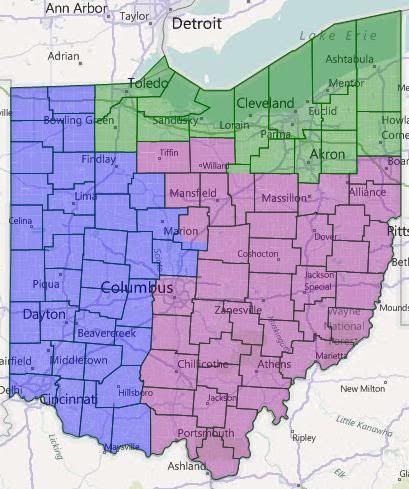
CD-01 West Ohio, Likely R

CD-02 North Ohio, Safe D

CD-03 Central and SE Ohio, Tossup?

All majority white. I’ll throw the R’s a bone here and call the running total: Dem 26, Rep 24.

Note that these eleven states account for half the senators in the alternate universe.

States with Two Senators

AKA the status quo

No geographic breakdowns anymore, I’m too tired. Remember, Blue = 1 and Green = 2.

Arizona
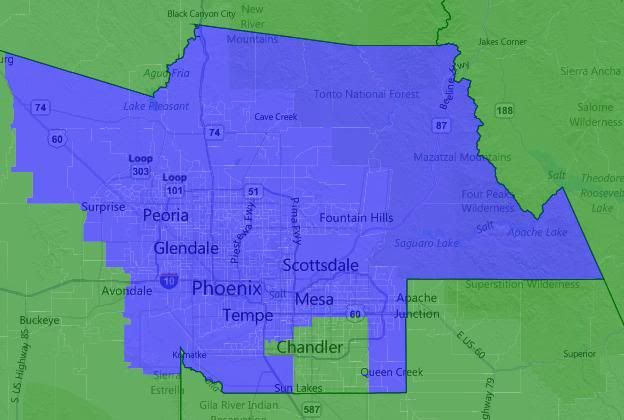
Both majority white at 58%. I have no idea if splitting Arizona between Maricopa and outstate helps us. I’ll assume not. Running total: Dem 26, Rep 26.

Colorado
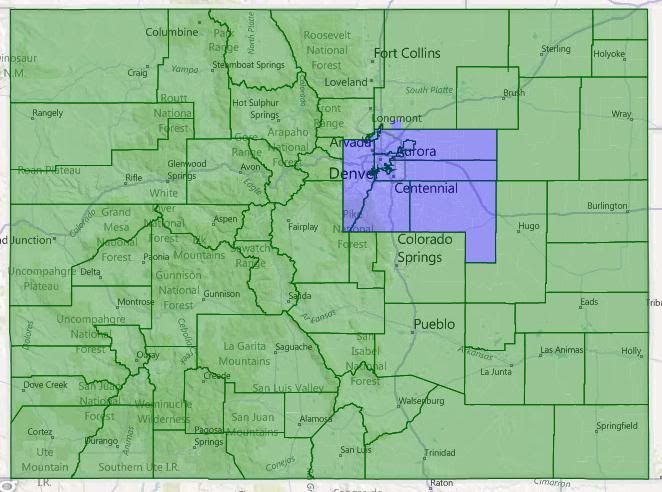
I assume that cutting out Denver is bad for us. Running total: Dem 27, Rep 27.

Indiana
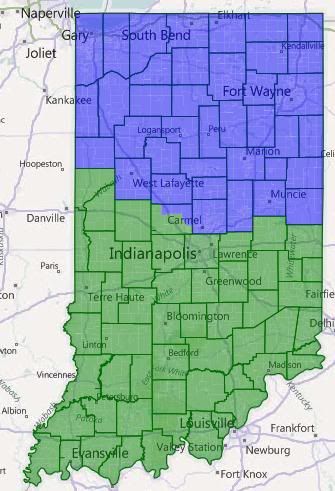
I could see both of these being competitive under the right circumstances. I’m going to give us the northern one. Running total: Dem 28, Rep 28.

Maryland
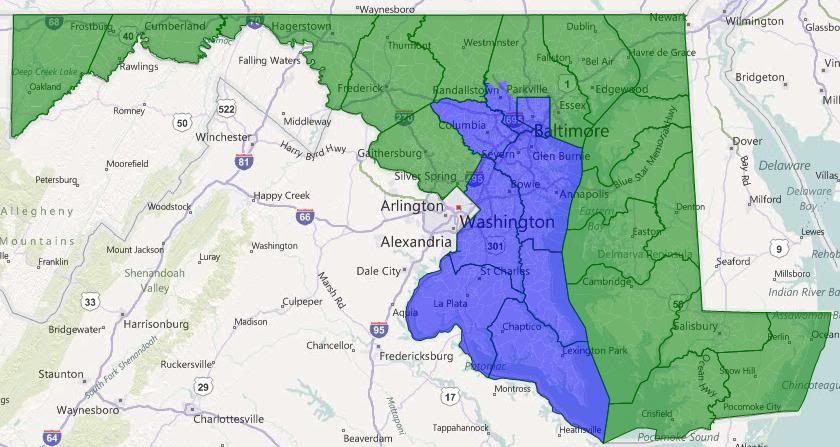
CD-01 is plurality black at 45%; this makes the other district more competitive than it ought to be. I still think we take both. Running total: Dem 30, Rep 28.

Massachusetts
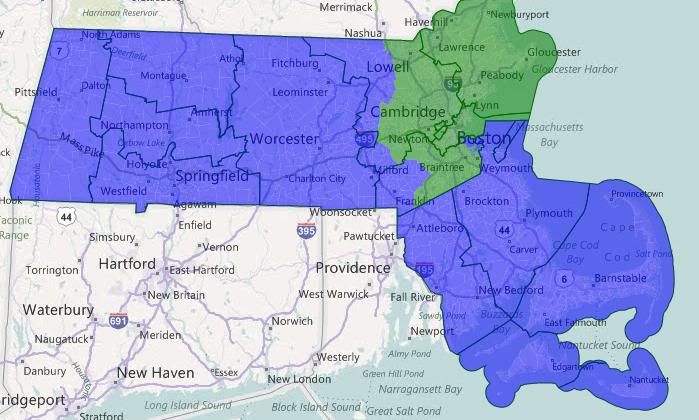
Let’s go ahead and assume Scott Brown. Running total: Dem 31, Rep 29.

Missouri
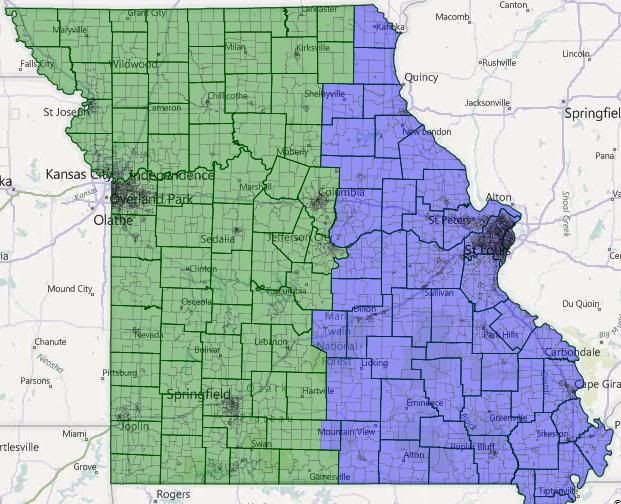
No idea what the ramifications of splitting Missouri are. I’m calling it split. Running total: Dem 32, Rep 30.

Minnesota
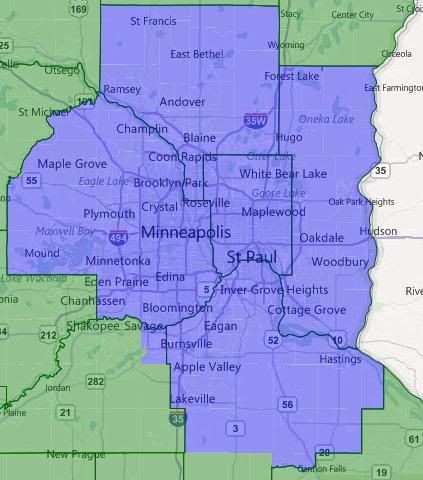
I assume we can hold both of these? Running total: Dem 34, Rep 30.

Tennesee

CD-01 is safe GOP. I could see us competing in CD-02. But running total: Dem 34, Rep 32.

Virginia
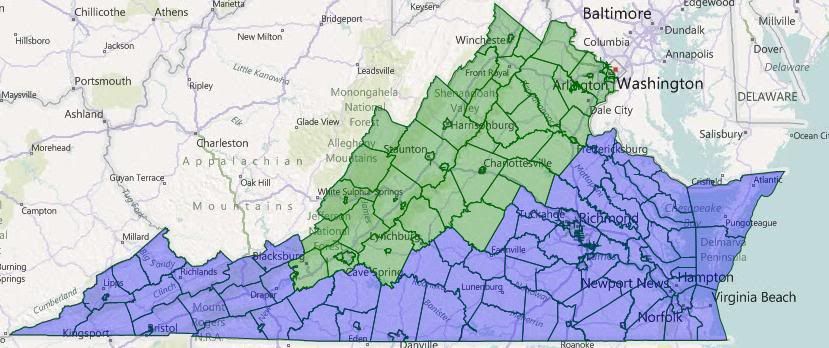
I’m not happy with this division, but everything else looked worse. Both districts should still be winnable for us, so running total: Dem 36, Rep 32.

Washington
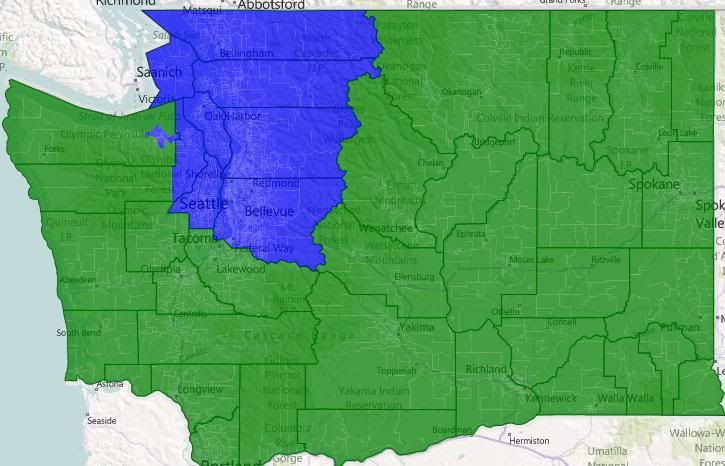
Probably the state where the split harms us most, unless Tacoma and Olympia can outweigh the rest of the state. I’m calling it split, so running total: Dem 37, Rep 33.

Wisconsin
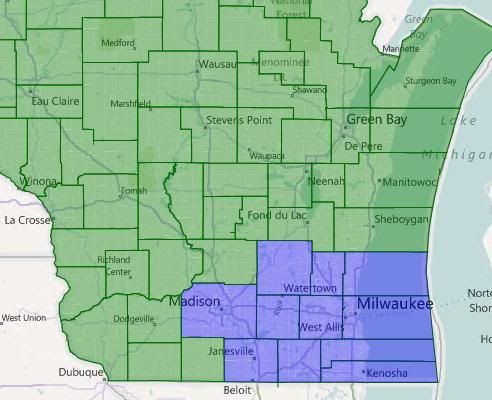
Madison and Milwaukee versus the Circle of Ignorance! The rest of Wisconsin looks on… I’m giving us both, so running total Dem 39, Rep 33.

The Single Senator States

AKA The unfairly advantaged

The remaining 28 states currently have almost enough votes to sustain a filibuster; in the alternate universe, they don’t even have enough to block one.

Northeast

I’d give us Delaware, Vermont, Connecticut, and Rhode Island. Maine and New Hampshire are probably toss-ups, so I’ll get us one of them. Running total: Dem 44, Rep 34.

South

They get Alabama, Mississippi, Kentucky, Oklahoma, and South Carolina. We get West Virginia. And I’ll split Arkansas and Louisiana. Running total: Dem 46, Rep 40.

Midwest

They get Kansas. I’ll split Iowa, Nebraska, and the Dakotas. Running total: Dem 48, Rep 43.

West

We get Oregon, New Mexico, Hawaii and Montana. They get Wyoming, Idaho, and Utah. That leaves splitting Nevada and Alaska. Final total: Dem 53, Rep 47.

Conclusion

Ok, that’s bizarre. I totally didn’t set out to end up where we actually are, it’s just where my guesses lead. Even if my take on this particular exercise didn’t show any partisan bias to the set-up of the Senate, it does highlight just how undemocratic that body is.

Again, please feel free to chime in about who you think would be in office in the alternate universe or to show off your (more gerrymandered?) versions of the alternate universe’s Senate districts.

MA-Sen: Brown Leads Capuano, Elizabeth Warren

(Please give a warm welcome to brownsox (aka Arjun Jaikumar) who is joining our horserace superteam – promoted by DavidNYC)

Pretty reasonable numbers, but a dodgy-looking sample.

Western New England College (PDF) (3/6-10, Massachusetts voters):

Michael Capuano (D): 38

Scott Brown (R-inc): 51

Elizabeth Warren (D): 34

Scott Brown (R-inc): 51

(MoE: ±4.5%)

The toplines are pretty much in line with what other pollsters have shown, like PPP. Brown has a solid lead, hovering around 50%, while his prospective opponents aren’t especially well known (one difference between WNEC’s poll and PPP’s is that Mike Capuano, tested in both polls, has impeccable 30/14 favorables in WNEC’s poll and pretty lousy 26/27 favorables in PPP’s).

Brown also leads Elizabeth Warren, who WNEC decided to poll for reasons best known to them (though check out those 17/3 favorables – Mike Beebe, eat your heart out!)

Like a lot of university polls, though, WNEC’s sample seems bizarre – 34% Democrats, 12% Republicans and 47% independents (the remainder responded “something else”). That’s very low on Democrats for a Massachusetts poll – the 2008 exit polls were 43% Dem, 17% Republican, 40% indie. Still, the toplines are close enough to everybody else’s numbers that they seem likely to be accurate. So the question is, can Brown lose?

He’s popular, but unlikely to get much more popular than he already is, especially as he continues to vote with Republican leadership to cut jobs and slash Medicare benefits. And popular Republicans can lose in Massachusetts in Presidential election years – ask former Governor Bill Weld, who ran for the Senate after receiving an eye-popping 71% of the vote in his 1994 reelection. Weld lost to John Kerry by seven points, 52% to 45%, helped in no small part by Bill Clinton’s 33-point romp in Massachusetts.

So sure, Brown can lose. He starts in a strong position for reelection, though, and it will take an exceptional campaign to unseat him.

The Link Between Senate and Presidential Voting

After seeing a lot of people predict that Ben Nelson and Scott Brown will lose because of their states’ respective presidential voting patterns, I was reminded of a section of one of my political science textbooks from last semester. In Chapter 6 of The Politics of Congressional Elections, the author, Gary Jacobson, details the events leading up to each set of congressional elections from 1980 to 2006 as well as the overall results. One thing I found particularly interesting at the time was that the percentage of Senate seats won by the party of the presidential candidate that also won that state has been on the rise over the past decade. Here are the relevant passages from page 218-219 of the book:

The same trend toward greater consistency in voting for president and U.S. representative in 2004 (Figure 6-3) appeared in Senate elections as well, resulting in a four-seat addition to the Republicans’ Senate majority. . . The Democrat’s main problem was again structural. They had to compete with the more-efficient distribution of Republican voters. Although Gore had won the national vote in 2000, Bush carried thirty of the fifty states, including twenty-two of the thirty-four states with Senate contests in 2004. Democrats had to defend ten seats in states Bush had won, including five left open by retirements, all in the South, where support for Democrats has been eroding for several decades. Meanwhile, Republicans were defending only three seats in states won by Gore. . . Seven of the eight Senate seats that changed party hands in 2004 went to the party that won the state in the 2000 and 2004 presidential elections; Salazar’s victory was the lone exception. . . More generally, twenty-seven of the thirty-four Senate contests were won by the party whose presidential candidate won the state’s electoral votes, tying 1964 for the highest level of congruence in president-Senate election results in the past half century. When the 2004 winners were added to the continuing Senate membership, fully 75 percent of Senators represented states where their party’s candidate won the most recent presidential election, the highest proportion in at least fifty years.

So what does this mean for the parties going into 2012. More below the fold.

In 2012, Democrats have 23 Senate seats up for election. These are listed below and the states in bold were won by McCain in 2008.

Democratic-Held Senate Seats

California

Connecticut

Delaware

Florida

Hawaii

Maryland

Michigan

Minnesota

Missouri

Montana

Nebraska

New Jersey

New Mexico

New York

North Dakota

Ohio

Pennsylvania

Rhode Island

Vermont

Virginia

Washington

West Virginia

Wisconsin

In contrast, Republicans only have 10 seats up in 2012. These are listed below and the states in bold were won by Obama in 2008.

Republican-Held Senate Seats

Arizona

Indiana

Maine

Massachusetts

Mississippi

Nevada

Tennessee

Texas

Utah

Wyoming

So right away you can see that each party holds Senate seats that would tend to go to the opposite party given normal conditions. Republicans should win Missouri, Montana, Nebraska, North Dakota, and West Virginia while Democrats should pick-up Indiana, Maine, Massachusetts, and Nevada. That works out to +1 R even after removing West Virginia and Indiana which are not likely to flip unless something dramatic happens such as Lugar losing to a Tea Party challenger in the primary. Maine is harder to judge, though I predict Snowe would win if she survives a primary challenge, bumping Republicans to +2.

One problem with this analysis is that it is based on the results of the 2008 elections because I can’t see the future and tell you who will win each state in 2012. Some speculation is possible though based on the results from 2008 and recent polls. The only Republican-held seat won by McCain that Obama has a realistic chance of winning is Arizona which he lost by 8.5%. Arguments can be made for Texas or maybe Tennessee but that’s unlikely barring a Regan vs. Mondale type wave. Obama also has a chance at winning Missouri (lost by 0.13%), Montana (lost by 2.38%), and North Dakota (lost by 8.65%) which would increase the chances of holding these Democratic Senate seats.

The Republican presidential candidate could win states with Democratic-held seats in Virginia (lost by 6.3%), Florida (lost by 2.81%) and Ohio (lost by 4.58%). Other states that seem less likely to flip right now but could depending on the environment include Pennsylvania (lost by 10.31%) and Michigan (lost by 16.44%). States that McCain lost last time but may be won by the Republican presidential candidate in 2012 include Indiana (lost by 1.03%) and possibly Nevada (lost by 12.49%). Winning back these states would increase the chance that Republican incumbents could hold their seats.

So where does all of this leave us? Here are three scenarios.

1. Obama wins all of his 2008 states and most Senate seats go with the presidential winner that state – R+1 or 2

Democrats pickup Massachusetts and Nevada, possibly Maine, and fail to pickup Indiana.

Republicans pickup Missouri, Montana, Nebraska, and North Dakota and fail to pickup West Virginia.

2. Obama improves on his 2008 map and most Senate seats go with the presidential winner in that state – D+2 or 3

Democrats pickup 4 or 5 of Arizona, Indiana, Maine, Massachusetts, and Nevada.

Republicans pickup Nebraska and North Dakota and fail to pickup West Virginia.

3. Obama does worse than his 2008 map and most Senate seats go wi the presidential winner in that state – R+2 to 8

Democrats pickup 0 to 2 of Massachusetts and Nevada and fail to pick up Maine.

Republicans pickup 4 to 8 of Florida, Michigan, Missouri, Montana, Nebraska, North Dakota, Ohio, Pennsylvania, Virginia, and West Virginia.

Senate Democrats’ best chance at keeping their majority involves Obama expanding the playing field and it appears this is the plan after Charlotte was chosen to be the site of the DNC. With the continued polarization of electorate, it may not be possible for vulnerable senators like Tester, McCaskill, Webb, and Brown to localize the election in hopes of drawing crossover support. This could certainly help their chances but the trends over the last decade indicate that their electoral survival depends heavily on the President.

By what margin will Bob Shamansky win?

View Results

Loading ... Loading ...

The Worst Republican Senate Candidates of 2010, Part 1

This is the first part of two posts analyzing patterns in the 2010 Senate midterm elections. The second part can be found here.

The 2010 congressional midterm elections constituted, by and large, a victory for the Republican Party. In the Senate Republicans gained six seats. While this was somewhat below expectations, it was much better than Republican hopes just after 2008 – when many expected the party to actually lose seats.

The Senate results provide some interesting fodder for analysis. The table below indicates which Republicans Senate candidates did the worst in 2008. It does so by taking the Republican margin of victory or defeat in a given state and subtracting this by the Cook PVI of the state (the Cook PVI is how a state would be expected to vote in a presidential election in the event of an exact tie nationwide). Given that Republicans won the nationwide vote this year, the average Republican candidate would be expected to do better than the state’s PVI. A bad Republican candidate would actually do worse than the state’s PVI.

Let’s take a look at this table below the flip.

State Republican Margin Cook PVI Republican Overperformance
South Dakota 100.00% 8.9% 91.10%
North Dakota 53.91% 10.4% 43.51%
Kansas 43.72% 11.5% 32.22%
Iowa 31.05% -1.0% 32.05%
Idaho 46.25% 17.4% 28.85%
Oklahoma 44.50% 16.9% 27.60%
Florida 28.69% 1.8% 26.89%
South Carolina 33.83% 7.8% 26.03%
New Hampshire 23.22% -1.6% 24.82%
Arizona 24.14% 6.1% 18.04%
Alabama 30.47% 13.2% 17.27%
Ohio 17.44% 0.7% 16.74%
Georgia 19.31% 6.8% 12.51%
Arkansas 20.96% 8.8% 12.16%
Missouri 13.60% 3.1% 10.50%
Illinois 1.60% -7.7% 9.30%
Louisiana 18.88% 9.7% 9.18%
Utah 28.79% 20.2% 8.59%
Indiana 14.58% 6.2% 8.38%
North Carolina 11.77% 4.3% 7.47%
Wisconsin 4.84% -2.4% 7.24%
Pennsylvania 2.02% -2.0% 4.02%
Kentucky 11.47% 10.4% 1.07%
Washington -4.73% -5.0% 0.27%
Alaska 11.94% 13.4% -1.46%
Colorado -1.63% 0.2% -1.83%
California -10.01% -7.4% -2.61%
Nevada -5.74% -1.3% -4.44%
Connecticut -11.94% -7.1% -4.84%
Delaware -16.58% -7.0% -9.58%
Oregon -17.98% -4.0% -13.98%
New York (S) -27.84% -10.2% -17.64%
Maryland -26.44% -8.5% -17.94%
West Virginia -10.07% 7.9% -17.97%
Vermont -33.41% -13.4% -20.01%
New York -34.10% -10.2% -23.90%
Hawaii -53.24% -12.5% -40.74%
Total/Average 5.54% 2.3% 8.08%

(Note: The data in Alaska and Florida refer to the official candidates nominated by the parties, not the independent candidates – Senator Lisa Murkowski and Governor Charlie Crist – who ran in the respective states).

This table reveals some fascinating trends. There is a very clear pattern: the worst Republican candidates ran in the bluest states – and the bluer the state, the more the Republican underperformed. This does not just mean that these Republicans lost, but that they lost by more than the average Republican was supposed to in the state. Republican candidates did worse than the state’s PVI in thirteen states; nine of these states had a Democratic PVI.

There seems to be a PVI tipping point at which Republicans start underperforming: when a state is more than 5% Democratic than the nation (PVI D+5). Only one Republican in the nine states that fit this category overperformed the state PVI (Senator Mark Kirk of Illinois ).

Something is puzzling about this pattern. It is true that states like Connecticut or Maryland will probably vote Democratic even in Republican victories. The Cook PVI predicts that Democrats will win by X% in the event of a national tie in the popular vote. One would thus have expected Republican candidates to do better than this in 2010, given that 2010 was the strongest Republican performance in a generation.

Yet this did not happen. In a lot of blue states Democrats actually did better than the Cook PVI would project them to do – that is, said blue states behaved like the Democrats had actually won the popular vote, which they certainly did not in 2010. The bluer the state, the stronger this pattern.

There are a couple of reasons why this might be. The first thing that comes to mind is the money and recruiting game. The Republican Party, reasonably enough, does not expect its candidates to win in places like New York and Maryland . So it puts less effort into Republican candidates in those states. They get less money – and therefore less advertising, less ground game, and so on. Nobody had any idea who the Republican candidate in Vermont was, for instance. That probably contributes to Republican underperformance in deep-blue states.

The second factor might be a flaw in the model the table uses. Democratic and Republican strongholds, for whatever reason, behave differently from “uniform swing” models. In almost all the counties President Barack Obama won, for instance, he improved upon President Bill Clinton 1992 and 1996 performance – despite the fact that Mr. Clinton won by similar margins in the popular vote. This holds true from San Francisco to rural Mississippi . In the 2010 Massachusetts special Senate election, the most Democratic areas of Massachusetts swung least towards Republican Senator Scott Brown. The fact that the worst Republican candidates ran in the bluest states fits the pattern.

The table presents another startling pattern, which will be discussed in the next post: there are surprisingly few Republicans who did worse than they were supposed to in red states.

–Inoljt

2010 Politicos of the Year

So, everyone else does lists at the end of the year. Why shouldn’t we? Here following, my picks for the 2010 Politicos of the year (in reverse chronological order).  

10. Suzana Martinez – NM-Gov

Martinez was a unknown district attorney when she took on Lt. Governor Dina Denish in a state that had not only overwhelmingly voted for Obama in 2008 but elected an all Democratic slate to Congress. She succesfully tied Denish into scandal-ridden outgoing governor Bill Richardson and won. The fact she did so in such a Democratic state makes her acheivement marginally more impressive than the Republicans other woman-minority governor-elect, Nikki Haley.

9. Lisa Murkowski – AK-SEN

Ran won of the worst primary campaigns in history, followed by the first successful write in campaign in 50 years. The kudos she deserves for the later far outweigh the mocking she deserves for the former.

8. Jerry Brown – CA-Gov

The former and future governor of California survived the most expensive attack campaign in American history. Almost without breaking a sweat.

7. Kamala Harris – CA-AG

A rising star, and the first woman to win this traditionally conservative law and order position. It’s no accident she’s being compared to Obama.

6. Rick Snyder – MI-Gov

“One tough nerd” managed to beat out three better known candidates in the Republican primary and crush his Democratic opponent in a state that gave Obama a landside win. Good luck with governing it.

5. Rick Scott – FL-Gov

Just as Time Magazine once picked the Ayatollah Khoemeni as “Man of the Year” we have to put Scott up there as a politician of the year. He beat out Florida’s AG for the nomination, and went on to defeat the much respected CFO of the state, despite being acclaimed as the “Madoff of Medicare,” among other titles.

4. Pete Sessions – R-Texas

It’s hard to single out one candidate in the Republican sweep of the House races this year, although some (Bob Dold? Chip Cravaack? Bill Flores) stand out. So, I’m putting Pete Sessions as a placeholder for everyone, because despite criticism about the NRCC’s tepid fundraising he managed to do better than either the RGA or the NRSC, partially through being very agressive about targeting races. Of course, we’ll see how he does in 2012, when the landscape may not be as promising.

3. Marco Rubio – FL-SEN

Almost everyone (except Kos) was declaring Rubio dead in the water when Charlie Crist released his first fundraising totals after announcing for Senate in 2009. Now, it’s Charlie Crist who is dead in the water, and Marco Rubio who is the potential Republican presidential candidate.

2. Harry Reid – NV-SEN

Here’s how much respect I have for Harry Reid as a politician: I think he would have beaten any of his opponents for Senate in 2010. He’s that good – his commercials were some of the best of the cycle.

1. Scott Brown – MA-SEN

It’s hard to believe that at the beginning of the year, it was assumed Martha Coakley, as Steve Singiser put it, “is likely to be the first woman elected to that chamber from the State of Massachusetts.” Even after all that’s happened since Brown’s victory, it’s hard to come up with a more shocking political result in a long time (the only one I can come up with is Harris Wofford’s win over Richard Thornburgh way back in 1991). What’s more, at this writing, Brown seems to be holding on to his popularity. Because Brown became the early face of the Republican wave that would sweep most strongly in the House elections, but also in the Senate, Governor and all the way down to the state legislatures, I think he should be 2010’s Politico of the Year.

WORST POLITICOS – 2010

1. Christine O’Donnell

Oh I hope she goes to jail. I really do. Even then, she probably won’t shut up. But I do have to say: thank you Erik Erickson and all the Tea Party organizations who gave us Dems a freebie in Delaware this year.

2. Joe Miller

Would have probably one a place as one of the best had he maintained his momentum after the primary. Instead, he lost to a write-in. Ultamite choke.

Del Ali

The head of polling organization Research 2000 is not a politician, but he was involved enough in politics that he makes my worst list for this year. Hope Kos wins his lawsuit.

Alan Grayson

Republicans should send a big thanks to Grayson for taking so much cash from well meaning progressives to fund an 18 point loss – one of the worst of any incumbent this cycle.

Blanche Lincoln, Paul Hodes (tie)

I guess you can give Lincoln credit for beating Bill Halter in the primary, but considering she was chairman of a major committee (Agriculture) in the Senate, shouldn’t she have been able to keep this race closer than a 22 point spread? As for Hodes, remember back in 2008 when Kos told us Hodes would finish off Judd Gregg (or whoever took Gregg’s place) in 2010? Yeah, well Hodes lost by almost 24 points. That was worse than Lee Fisher, or almost anyone else in a supposedly competitive race.  

The 10 best (and five worst) campaigns of the 2010 cycle

So here we are at the end of the 2010 race (well, almost at the end – there are still a couple of uncalled races). These are my picks for best and worst campaigns of this cycle. What are yours? And tell me if you agree or disagree with any of these

BEST CAMPAIGNS

Harry Reid – NV-SENATE This was a masterpiece, one of those campaigns that will be studied for decades as an example of how to win in a negative environment. Reid’s ads were brilliant, his strategy was forward thinking (i.e. he started knocking out potential opponenents in 2008) and he did a great job with GOTV and the other essentials. Yes, he got lucky in his opponent (and very unlucky in the cycle he was running), but given how at one point it looked like the Republicans could run a ferret against Harry Reid (oh wait, I guess they did) and still win, this still was an amazing comeback story.

Ron Johnson – WI-SENATE Yes, Feingold had underperformed in the past, but he had also survived a Republican year in 2004, and his outsider cred had beaten Republicans three times before. But Johnson ran a canny campaign that turned Feingold into a Washington insider, and managed to pull the biggest upset of an incumbent Senator of the cycle.

Rick Scott – FL-GOVERNOR This one pains me, because I think Scott is a loathsome individual. But the fact of the matter is, to get such a loathsome individual across the finish line against an incumbent Attorney General and the respected CFO of the state, you have to have a pretty good campaign. Best move: tarring Sink with the same corruption brush that had been used against Scott, even though the cases weren’t even close to similar.

National Republican Campaign Committee The NRCC and Pete Sessions got ridiculed a fair amount on this site and others for their poor fundraising compared to the DCCC, but it turns out they were probably the smartest of any of the big campaign committees, opening up new opportunities throughout September and October. They certainly outperformed the more respected RGA.

Barbara Boxer – CA-SENATE Boxer is thought to be in trouble every campaign cycle, and everytime she outperforms expectations. Give the woman some respect.

John Kasich – OH-GOVERNOR Yeah, Portman blew his opponent away, whereas Kasich race was much closer, and yes Ohio’s economy is in the crapper, but he still had a tough job in beating Ted Stickland, who’s unpopularity never reached the level of some other Midwestern governors. Along with Scott’s win, the biggest victory (in terms of influence) for the Republicans on election night.  

Marco Rubio – FL-SENATE Rubio showed some mad (and for us Dems, potentially scary) political skills in first driving Crist out of the Republican party, and secondly, beating both his opponents with just under 50 percent of the vote.

Bob Dold – IL-10 It’s hard to single out one House campaign as being better than the others in a wave year, but Dold won a seat almost none of the pundits thought he could win, and (with Costa apparently holding on) pulled off the most Democratic seat of the cycle. Gotta give the guy props for that.

Lisa Murkowski – AK-SENATE (write in campaign only). Murkowski ran one of the worst campaigns up until the primary, but the fact she seems about to win as the first write in candidate for Senate since the 1950’s is pretty amazing, and deserves some credit.

Ben Chandler One of the few Dems to survive Tuesday’s apocalypse. In a R+9 district, no small feat.

WORST CAMPAIGNS

Meg Whitman, CA-GOVERNOR How could you spend so much money, and lose so badly?

Lee Fisher, OH-SENATE Fisher’s campaign was basically all downhill after he won the primary.

DCCC We all loved Chris Van Hollen after the 2008 cycle, but I think he made a huge strategic error in not cutting more Democrats loose when he realized how bad the wave was going to be.

Alan Grayson, FL-08 One last thing to say about Grayson – when is the last time a Democrat was responsible for the most sleazy, misleading ad of the campaign?

Jim Oberstar, MN-08 Of all the committee chairs to lose this cycle, Oberstar was the only one to lose in a Democratic district (according to PVI). He should have seen this one coming.  

My Predictions for 2010

At long last, I have finished making predictions, this time mixing my “gut feeling” predictions from earlier with the formula prediction methods I had used since 2006. I found the dearth of House polls very annoying, so many of my House predictions could be way off. We shall see in 12 or so hours.

GOVERNOR

Image and video hosting by TinyPic

Alabama: Bentley by 15.33%

Alaska: Parnell by 15.67%

Arizona: Brewer by 15%

Arkansas: Beebe by 25.67%

California: Brown by 14.33%

Colorado: Hickenlooper by 3.67%

Connecticut: Malloy by 5.67%

Florida: Sink by 1.67%

Georgia: Deal by 7.67%

Hawaii: Abercrombie by 5%

Idaho: Otter by 22%

Illinois: Brady by 4.67%

Iowa: Branstad by 10.5%

Kansas: Brownback by 27%

Maine: LePage by 11.33%

Maryland: O’Malley by 12.67%

Massachusetts: Patrick by 2.67%

Michigan: Snyder by 16.67%

Minnesota: Dayton by 1.33%

Nebraska: Heineman by 42%

Nevada: Sandoval by 15.67%

New Hampshire: Lynch by 8.33%

New Mexico: Martinez by 8.33%

New York: Cuomo by 22%

Ohio: Strickland by 1%

Oklahoma: Fallin by 18.5%

Oregon: Kitzhaber by 1.67%

Pennsylvania: Corbett by 9%

Rhode Island: Chafee by 8%

South Carolina: Haley by 8.33%

South Dakota: Daugaard by 13.67%

Tennessee: Haslam by 28%

Texas: Perry by 1%

Utah: Herbert by 25.33%

Vermont: Shumlin by 2%

Wisconsin: Walker by 8.67%

Wyoming: Mead by 36%

OVERALL: Republicans gain a net of 5 for the majority of governorships, 27-22-1

SENATE

Image and video hosting by TinyPic

Alabama: Shelby by 28%

Alaska: McAdams by 0.67% (Miller in 2nd; Murkowski in 3rd)

Arizona: McCain by 23%

Arkansas: Boozman by 19.67%

California: Boxer by 6.67%

Colorado: Buck by 1%

Connecticut: Blumenthal by 8%

Delaware: Coons by 14%

Florida: Rubio by 16%

Georgia: Isakson by 25.67%

Hawaii: Inouye by 24.5%

Idaho: Crapo by 44%

Illinois: Kirk by 4.33%

Indiana: Coats by 10.33%

Iowa: Grassley by 31%

Kansas: Moran by 40%

Kentucky: Paul by 3.18%

Louisiana: Vitter by 5.87%

Maryland: Mikulski by 26.67%

Missouri: Robin Carnahan by 0.67%

Nevada: Reid by 0.67%

New Hampshire: Ayotte by 15%

New York A: Schumer by 28.67%

New York B: Gillibrand by 18.33%

North Carolina: Burr by 12.33%

North Dakota: Hoeven by 47%

Ohio: Portman by 9.83%

Oklahoma: Coburn by 40%

Oregon: Wyden by 15.33%

Pennsylvania: Toomey by 4.67%

South Carolina: DeMint by 42% (The Green candidate may get more votes than the Greene candidate.)

South Dakota: Thune by 70-90%

Utah: Lee by 25.33%

Vermont: Leahy by 35%

Washington: Murray by 1.88%

West Virginia: Manchin by 1.33%

Wisconsin: Johnson by 7.67%

OVERALL: Republicans gain a net of 5, but Democrats retain control 54-46

HOUSE

Light Blue = D+1; Light Red = R+1; Red = R+2; Medium-Dark Red = R+3; Dark Red = R+4; Very Dark Red = R+5

Image and video hosting by TinyPic

AL-02: Bright by 3.75%

AZ-01: Gosar by 4% (R pickup)

AZ-03: Hulburd by 1.17% (D pickup)

AZ-05: Schweikert by 0.67% (R pickup)

AZ-07: Grijalva by 4.08%

AZ-08: Giffords by 6.12%

AR-01: Crawford by 5.56% (R pickup)

AR-02: Griffin by 11% (R pickup)

CA-03: Lungren by 3.75%

CA-11: McNerney by 2.75%

CA-18: Cardoza by 10.75%

CA-20: Costa by 2.87%

CA-44: Calvert by 13.17%

CA-45: Bono Mack by 15%

CA-47: Sanchez by 8.25%

CO-03: Salazar by 1.25%

CO-04: Gardner by 3.58% (R pickup)

CT-04: Himes by 2.42%

CT-05: Murphy by 4.17%

DE-AL: Carney by 9.83% (D pickup)

FL-02: Southerland by 9.25% (R pickup)

FL-08: Webster by 3.25% (R pickup)

FL-22: Klein by 0.94%

FL-24: Adams by 6.25% (R pickup)

FL-25: Rivera by 3%

GA-02: Bishop by 2.67%

GA-08: Scott by 12.5% (R pickup)

HI-01: Hanabusa by 2.17% (D pickup)

ID-01: Minnick by 2.42%

IL-10: Seals by 7.6% (D pickup)

IL-11: Kinzinger by 5.13% (R pickup)

IL-14: Hultgren by 0.31% (R pickup)

IL-17: Schilling by 2.63% (R pickup)

IN-02: Donnelly by 4.38%

IN-08: Buschon by 8.75% (R pickup)

IN-09: Hill by 0.52%

IA-01: Braley by 10%

IA-02: Loebsack by 8.75%

IA-03: Boswell by 8.07%

KS-03: Yoder by 10% (R pickup)

KY-03: Yarmuth by 10.5%

KY-06: Chandler by 3.69%

LA-02: Richmond by 11.83% (D pickup)

LA-03: Landry by 12.25% (R pickup)

ME-01: Pingree by 12.42%

MD-01: Harris by 4.92% (R pickup)

MA-10: Keating by 2.63%

MI-01: Benishek by 2.71% (R pickup)

MI-07: Schauer by 0.44%

MI-09: Peters by 3.88%

MN-01: Walz by 10.42%

MN-08: Oberstar by 4.88%

MS-01: Childers by 0.88%

MS-04: Taylor by 2.69%

MO-03: Russ Carnahan by 5.63%

NV-03: Titus by 0.33%

NH-01: Guinta by 10.25% (R pickup)

NH-02: Bass by 0.08% (R pickup)

NJ-03: Runyan by 1.13% (R pickup)

NM-01: Barela by 0.63% (R pickup)

NM-02: Pearce by 4.83% (R pickup)

NY-01: Bishop by 7.56%

NY-13: McMahon by 7.5%

NY-19: Hayworth by 1.02% (R pickup)

NY-20: Gibson by 3.46% (R pickup)

NY-23: Owens by 0.88%

NY-24: Arcuri by 3.31%

NY-25: Maffei by 6.58%

NY-29: Zeller by 12.5% (R pickup)

NC-02: Etheridge by 2.5%

NC-07: McIntyre by 3.75%

NC-08: Kissell by 2.38%

NC-11: Shuler by 11.88%

ND-AL: Berg by 4.97% (R pickup)

OH-01: Chabot by 6.25% (R pickup)

OH-06: Wilson by 2.06%

OH-13: Sutton by 10%

OH-15: Stivers by 6.25% (R pickup)

OH-16: Renacci by 0.63% (R pickup)

OH-18: Gibbs by 1.88% (R pickup)

OR-05: Schrader by 2.75%

PA-03: Kelly by 6.25% (R pickup)

PA-04: Altmire by 12.58%

PA-07: Meehan by 3.83% (R pickup)

PA-08: Fitzpatrick by 4.53% (R pickup)

PA-10: Marino by 4.57% (R pickup)

PA-11: Barletta by 2.13% (R pickup)

PA-12: Critz by 5.38%

PA-15: Dent by 11.63%

RI-01: Cicilline by 4.94%

SC-05: Mulvaney by 4.75% (R pickup)

SD-AL: Noem by 0.31% (R pickup)

TN-04: DesJarlais by 1% (R pickup)

TN-06: Black by 12.5% (R pickup)

TN-08: Fincher by 9.5% (R pickup)

TX-17: Edwards by 1.72%

TX-23: Rodriguez by 2.15%

TX-27: Ortiz by 2.88%

VA-02: Rigell by 3.04% (R pickup)

VA-05: Hurt by 5.28% (R pickup)

VA-09: Boucher by 4.5%

WA-02: Larsen by 5.75%

WA-03: Herrera by 3.56% (R pickup)

WA-08: Reichert by 5.38%

WV-01: McKinley by 2.25% (R pickup)

WI-03: Kind by 8.75%

WI-07: Duffy by 7.21% (R pickup)

WI-08: Ribble by 5.46% (R pickup)

OVERALL: Republicans gain a net of 42 for control 220-215

The Most Optimistic Set of Predictions You’ll See (H: D-24, S: D-4)

I think I’m about to post the most optimistic set of predictions this board will probably see. Aside from a brutal South, I think Dems will be relatively okay through the rest of the nation.

(As a side note, I’ll be knocking doors in Pittsburgh all day tomorrow, so I’m signing off until 9PM-ish tomorrow.)

Reasoning:

1. I fundamentally believe that the polling is off in our favor-too much Razzy goodness, too much crappy Republican internal polling, and bad, bad LV models (also cell phone effect) have been baked into the so called “cake”. I just don’t buy it (either that or I’m in denial).

2. …..except in the South, there I do buy the polling actually being as bad as it is.

3. The other major thing that should help Democrats, especially in the Philadelphia-Kansas City corridor is the GOTV ground game brought to you by your friendly local unions. This conversely explains why the South will be so bad.

4. In key states, like Ohio, Pennsylvania, Colorado, and New York,  while they may not all win, Senate and Gubernatorial candidates are doing well enough to save the Chris Carneys, John Salazars, Zack Spaces, and John Halls of the world.

5. Too many bad GOP candidates like Allan West, Tim Walberg, Tom Marino, Andy Harris and Sharron Angle (among many others).

6. Everyone remembers the great GOP landslide of 1998, don’t we….

Senate

Senate (D-4)

North Dakota

Indiana

Arkansas

Wisconsin (though I can easily see PA here)

House:

Republican Gains (31)

South (14)

Arkansas 1st

Arkansas 2nd

Florida 2nd

Florida 8th

Florida 24th

Georgia 8th

Louisiana 3rd

Mississippi 1st

Tennessee 4th

Tennessee 6th

Tennessee 8th

Texas 17th

Virginia 2nd

Virginia 5th

Northeast (5)

New Hampshire 1st

New York 29th

Pennsylvania 3rd

Pennsylvania 7th

Pennsylvania 11th

Midwest (9)

Michigan 1st

Illinois 11th

Illinois 17th

Indiana 8th

Kansas 3rd

Ohio 1st

Ohio 15th

Wisconsin 7th

Wisconsin 8th

West (3)

Arizona 1st

Colorado 4th

New Mexico 2nd

Democratic Pickups (7)

Arizona 3rd ****UPSET SPECIAL****

Delawrare-AL

Florida 25th

Hawaii 1st

Illinois 10th

Louisiana 2nd

Washington 8th ****UPSET SPECIAL****

House and Senate predictions

D-held house seats:

I would be shocked if Dems held any of these: AR 2, CO 4, FL 2, FL 8, FL 24, IL 11, IN 8, KS 3, LA 3, NY 29, OH 1, OH 15, PA 3, TN 6, TN 8, TX 17. +16 R.

I would be surprised but not shocked if Dems held any of these: MD 1, MS 1, NH 1, PA 7, VA 2, VA 5, WA 3. +5.6 R if each has an 80% chance to go R.

I’d bet the Reep if I had to bet, but would not be surprised if Dems held any of these: AR 1, AZ 1, WI 7, WI 8, MI 1, PA 8, OH 16, NV 3, NM 2, SC 5, ND, GA 8, NY 20, NJ 3, CO 3, NH 2, IL 17. +10.2 R if each has a 60% chance to go R.

I’d bet the Dem if I had to bet, but would not be surprised if Reeps took any of these: AZ 5, AL 2, IL 14, NY 19, NY 23, PA 10, PA 11, SD, MI 7, WV 1, OH 18, FL 22, NC 8, IN 9, TN 4, TX 23, MS 4. +6.8 R if each has a 40% chance to go R.

I would be surprised but not shocked if Reeps took any of these: CT 4, CT 5, MN 8, IA 2, ID 1, IN 2, MO 4, NY 24, NY 25, PA 12, MI 9, AZ 8, OR 5, WA 2, NC 7, MA 10, NM 1, CA 11, CA 20, CA 22, CA 47, VA 9, VA 11, OH 6, CO 7. +5.0 R if each has a 20% chance to go R.

I would be shocked if any other Dem seats flipped. That includes NC 11 and NY 22.

R-held seats:

I would be shocked if Reeps held DE. +1 D.

I would be surprised but not shocked if Reeps held any of these: HI 1, IL 10, LA 2. +2.4 D if each has an 80% chance to go D.

I’d bet the Reep if I had to bet, but would not be surprised if Dems took FL 25. +0.4D if the Dem has a 40% shot.

I would be surprised but not shocked if Dems took WA 8 or CA 3. +0.4 D if each has a 20% chance to go D.

I would be shocked if any other Reep seats flipped.

So I have Reeps flipping an expected 43.6 seats, Dems flipping 4.2, for a net of 39.4 to the Reeps…hmm. If I had to bet I’d bet the over, as I suspect my ratings may be too favorable to Dems. I’ll just round up to 40.

Senate:

D-held seats:

ND, AR, IN 100% to flip.

WI 90%

PA 75%

IL 55%

CO 50%

NV 40%

WA 25%

WV 20%

CA 5%

CT 5%

Everything else, forget it. R +6.65.

R-held seats:

AK 20% counting Murk as a Reep.

KY 5%

MO 5%

and that’s it. D +0.3.

Net of 6.35 seats to the Reeps, call it 6 because Senate races are easier to keep track of.

So that’s a net of 40 House seats and 6 Senate seats to the Reeps.