Apportioning the US Senate: A Weekend Fantasia

This diary explores the following alternate reality: What if the US Senate was apportioned like the US House? One hundred members, single-member districts, distributed just like House seats (ie, every state gets one seat and then the rest are apportioned using the rule of equal proportions.)

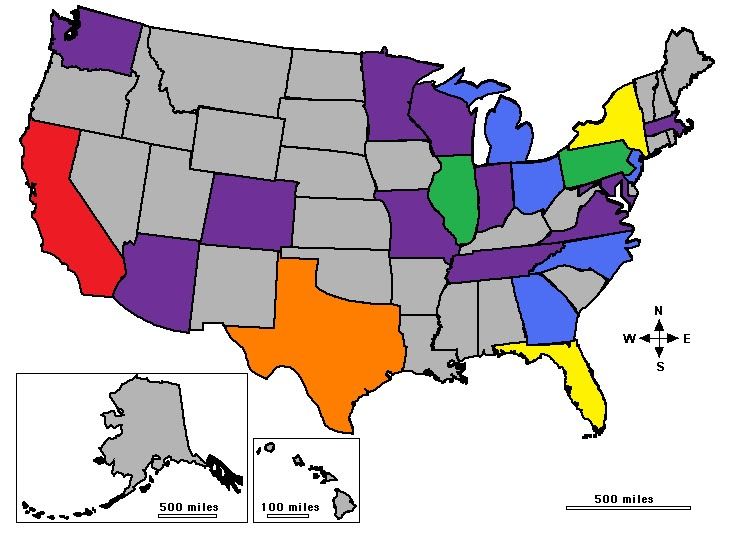
Using 2010 data, the map would look like this:

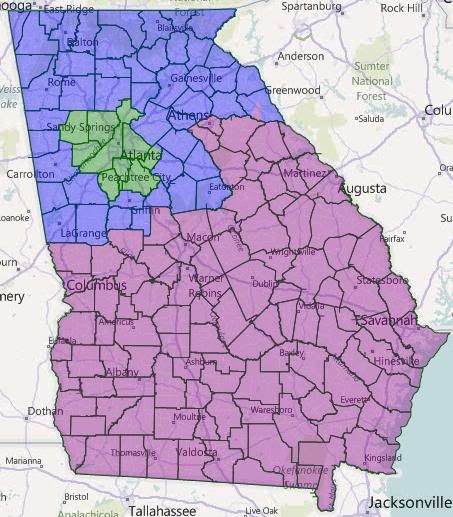
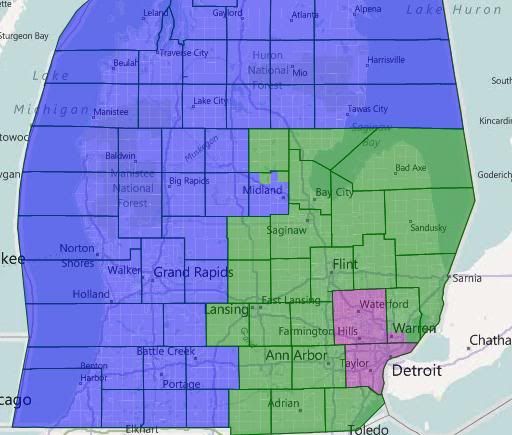
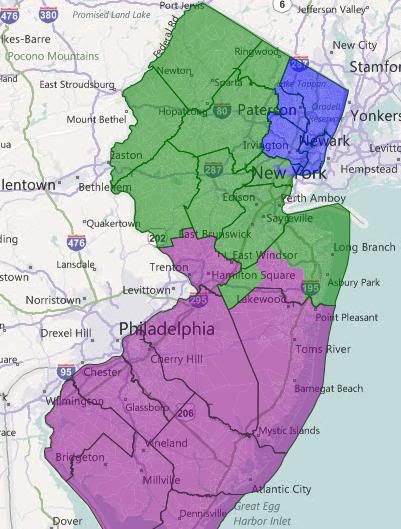
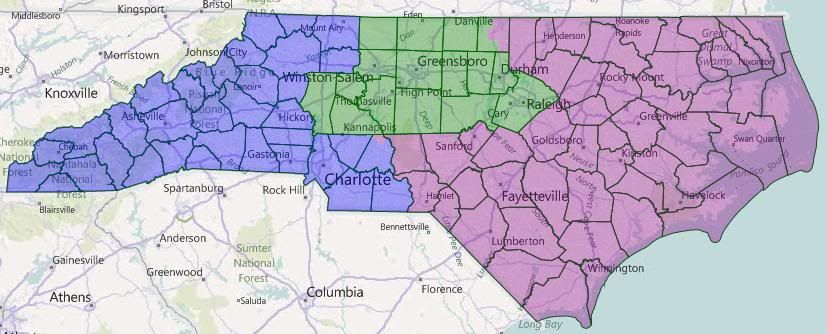
California, in red, would have 10 seats. Texas, in orange, would have 7. New York and Florida, in yellow, would have 5. Illinois and Pennsylvania, in green, would have 4. Georgia, North Carolina, Ohio, New Jersey, and Michigan – all in blue – would have 3. Eleven other states, in purple, would have their current 2. And the remaining twenty-eight states, in grey, would be down to 1.

Two seats would have moved as a result of the 2010 Senate reapportionment, with Texas and Colorado gaining at the expense of Ohio and New York.

(Figures are from the Census Bureau. Since we’re doing this just like the House, all you have to do is look at the House priority lists and cut it off at 100 instead of 435. See here for the 2010 data and here for the 2000 data.)

After the jump, I have maps for the 22 states that would have more than one senator in this alternate universe. Please feel free to post your own.

I’d also be very interested to hear who you all think would be in the senate in this alternate universe. I’m having a hard time figuring out how the one-third-at-time-up-for-election rule would work in a reapportioned body, so perhaps in the alternate universe, senators have four year terms and are elected at presidential midterm? That’s not a fixed rule for this hypothetical, just a guess.

Notes: The presentation of maps for states with more than one senator is sorted according to number of senators, then alphabetically. There’s a brief round up of the one-senator states at then end.

I’ve used the default colors throughout, so blue = CD-1, green = CD-2 purple = CD-3, red = CD-4, yellow = CD-5, teal = CD-6, grey = CD-7, slate blue = CD-8, cyan = CD-9 and pink = CD-10.

I’ve assumed that a compactionist ethic would be at play, and that minority opportunity districts would be favored, even if they’re not 50%+. Obviously, that’s another part of the alternate universe.

States with 3 or more senators

AKA those disadvantaged by the current system

California


Overview


LA Detail

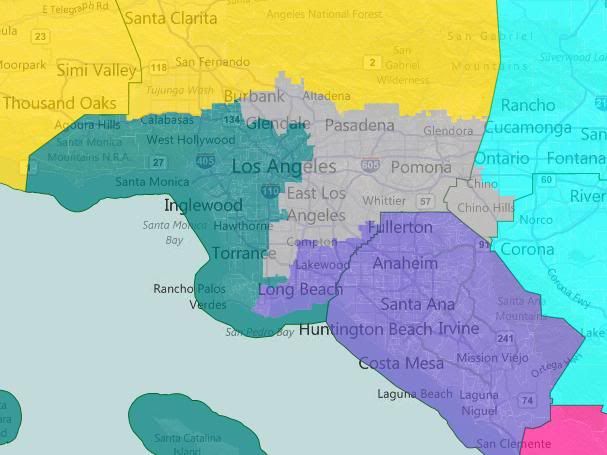
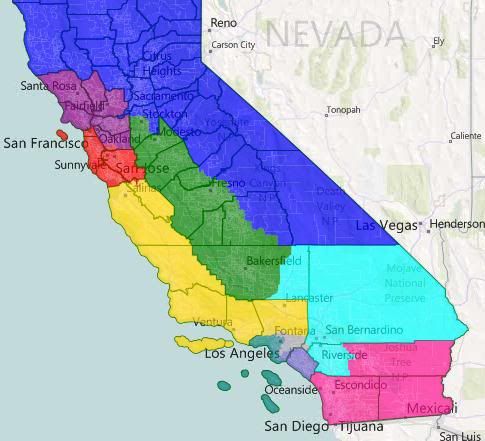
California has ten districts: (CD-1) North CA/Sacramento/Sierra Nevada, (CD-2) Central Valley, (CD-3) North Bay, (CD-4) South Bay, (CD-5) Central Coast, (CD-6) East LA County, (CD-7) West LA County, (CD-8) Orange County/Long Beach,

(CD-9) Inland Empire, and (CD-10) San Diego/Salton Sea.

CD-1 is the only one that’s majority-white by total population. CD-2, CD-5, CD-6, and CD-9 are plurality Hispanic. CD-07 is majority Hispanic.

My guess is that CD-3, CD-4, CD-6, and CD-7 would be safe Democratic, with the rest being some form of competitive (ie, between lean Dem and lean Rep). Say for the sake of argument that we would be holding two of them right now. That starts our running total at 6 D – 4 R.

Note: the voting block shapes for CA can be pretty large right now in Dave’s App. CD-6 is about 50k under populated with CD-07 about 50k over populated. If I swap the LA proper parts of CD-8 back to CD-6, that swaps to CD-8 being 30k under and CD-6 being 30k over. So, about half of that southern part of LA proper needs to go back to CD-6. For a fictional scenario, I figure this was an ok kludge.

Texas

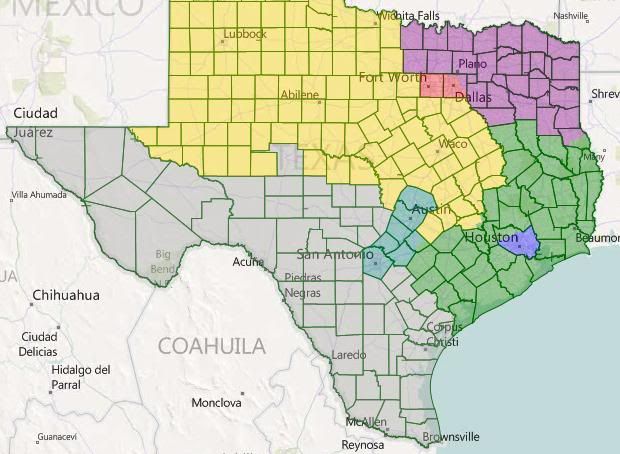
Texas has seven seats: (CD-1) Harris, (CD-2)Southeast Texas, (CD-3) Northeast Texas, (CD-4) Metroplex, (CD-5) North and Central Texas, (CD-6) San Antonio/Austin, and (CD-7) South Texas.

CD-7, of course, is heavily Hispanic. CD-1 is plurality Hispanic, and CD-4 and CD-6 are only plurality white.

I would think that CD-1 and CD-6 are easy gets for us, with CD-4 and CD-7 leaning our way. The other three are ubersafe for the GOP. Running total: Dem 10, Rep 7.

Florida

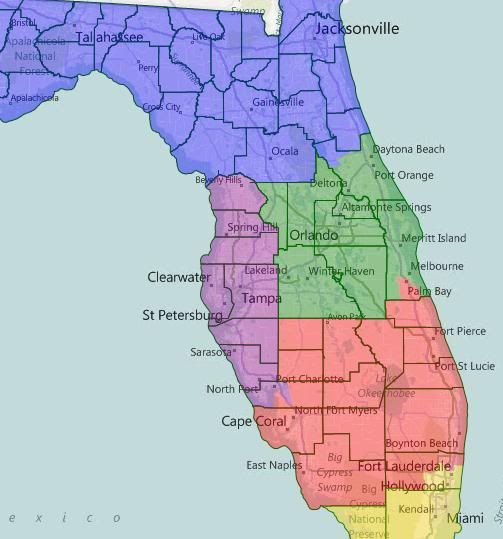
Five districts: CD-01 North Florida, CD-02 North Central Florida, CD-03 West Central Florida, CD-04 South Central Florida, CD-05 South Florida.

CD-05 is majority Hispanic, the rest majority white.

I’d like to think that these are all at least potentially competitive, but I’m going to be conservative here and say that we only hold one of these (Nelson in Orlando?). Running total: Dem 11, Rep 11.

New York


Overview


NYC Detail

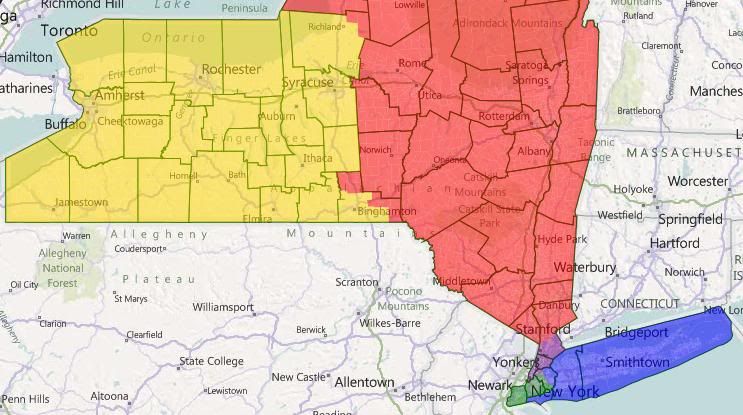
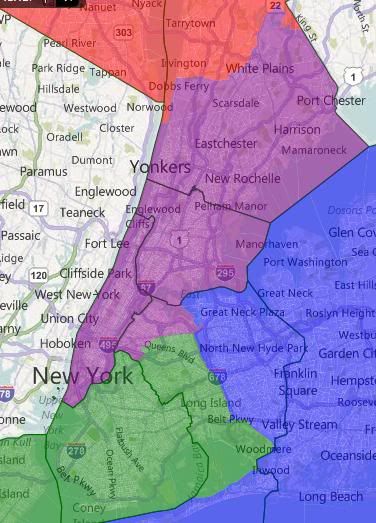
Five districts: CD-01 Suffolk/Nassau/NW Queens, CD-02 Brooklyn/Staten Island/South Queens, CD-03 Manhatten/Bronx/Northwest Queens/South Westchester, CD-04 East Upstate, CD-05 West Upstate.

I forgot to save this map, so I don’t have racial stats. CD-02 and CD-03 were majority minority, I think.

Partisan breakdown here depends on whether 2010 factors into the equation. In a normal environment, I think CD-04 is the only truly vulnerable district, but we’ll spot the GOP CD-05 as well. Running total: Dem 14, Rep 13.

Illinois

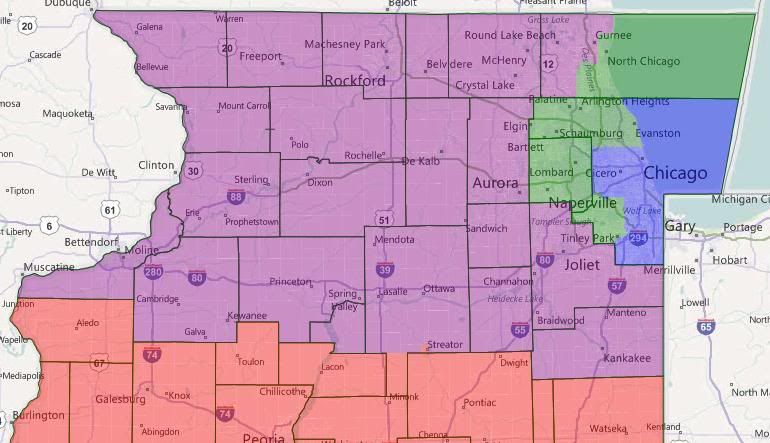
CD-01 Chicago, CD-02 Suburban Chicago, CD-03 Northern Illinois, CD-04 Southern Illinois. CD-01 is plurality black at 35% or so. The rest majority white. I’m going to call this a 2-2 split, so running total: Dem 16, Rep 15.

Pennsylvania

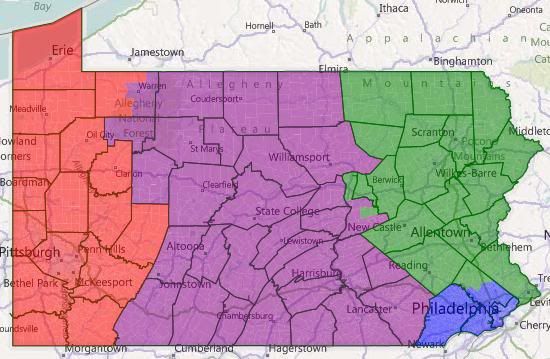
CD-01 Philadelphia, CD-02 Northeast PA, CD-03 Central Pa, CD-04 West PA. All majority white. I’m going to call this one a 2-2 split also, so running total Dem 18, Rep 17.

Georgia

Three districts: CD-01 North Georgia, CD-02 Atlanta, CD-03 South Georgia.

Atlanta is plurality white and about 40% black, the rest are majority white.

I assume we’d take Atlanta and Republicans would get the other two. Running total: Dem 19, GOP 19.

Michigan

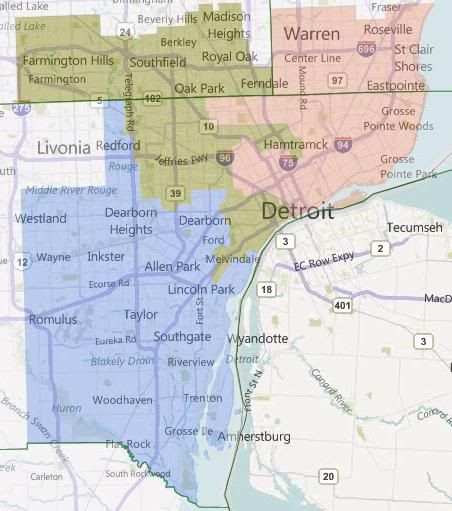
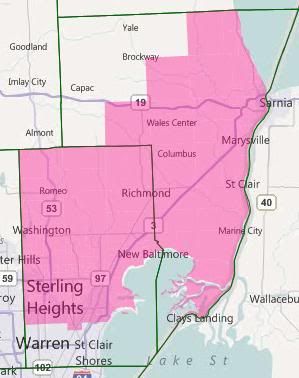
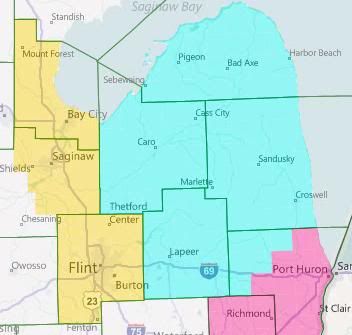
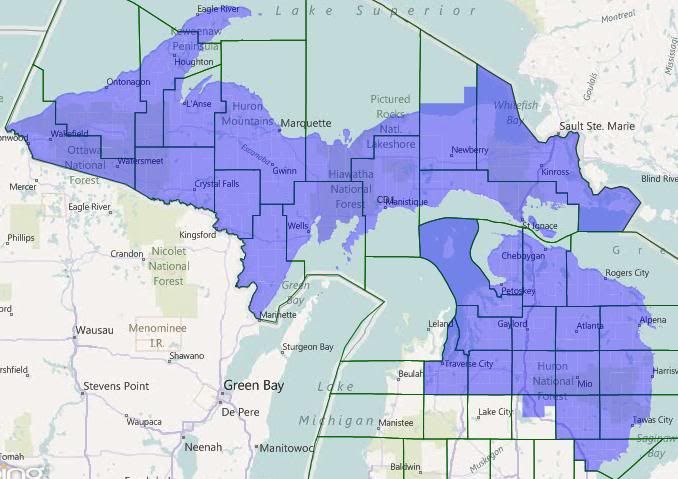
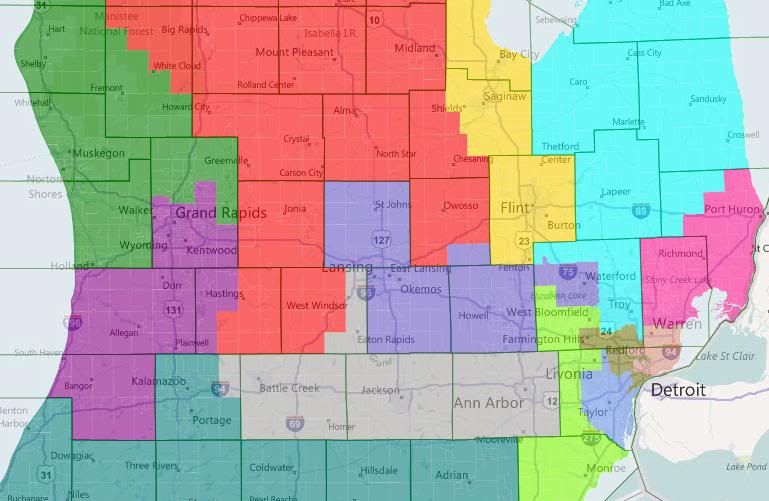
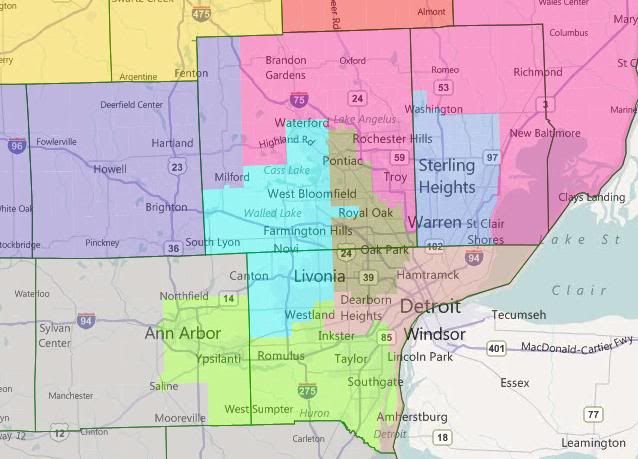
Three districts: CD-01 North and West Michigan, CD-02 Southeast Michigan, CD-03 Wayne/Oakland/South Macomb.

Looks like I forgot to save this map too. I’m pretty sure they’re all majority white.

CD-02 and CD-03 are safe Democratic (and would probably be represented by Stabenow and Levin, respectively.) CD-01 is likely Republican. Running total: Dem 21, GOP 20.

New Jersey

Three districts: CD-01 Greater Newark, CD-02 North Jersey, CD-03 South Jersey.

CD-01 is white plurality, the other two white majority.

I know a lot of Democratic strength is locked-up in CD-01, but we’d still be likely to hold at least two of these, right? Running total: Dem 23, GOP 21.

North Carolina

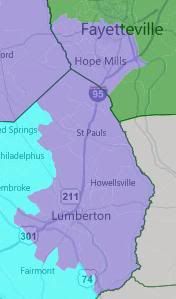
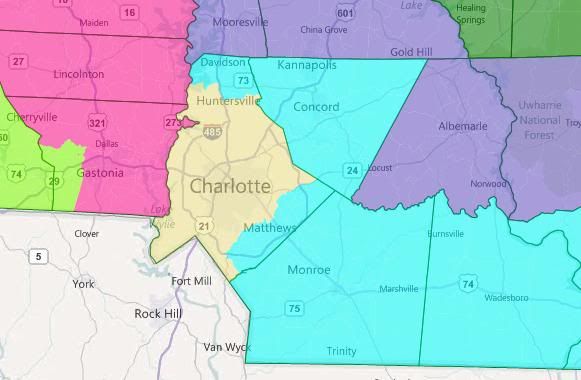
CD-01 Charlotte/West Carolina – Likely Republican?

CD-02 Triangle and Triad – Likely Dem

CD-03 East Carolina – Toss-up?

All are majority white; CD-03 has the highest black percentage at 27%. I’m going to give us a Blue Dog-ish Dem in the east, so running total: Dem 25, Rep 22.

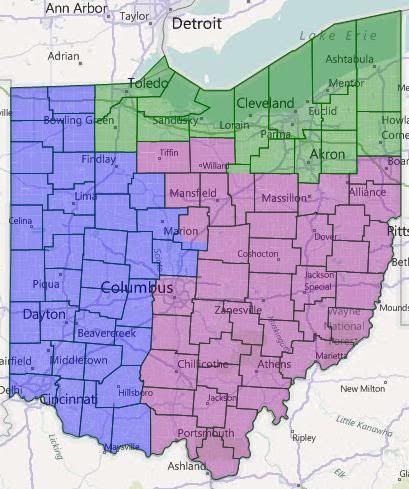
Ohio

CD-01 West Ohio, Likely R

CD-02 North Ohio, Safe D

CD-03 Central and SE Ohio, Tossup?

All majority white. I’ll throw the R’s a bone here and call the running total: Dem 26, Rep 24.

Note that these eleven states account for half the senators in the alternate universe.

States with Two Senators

AKA the status quo

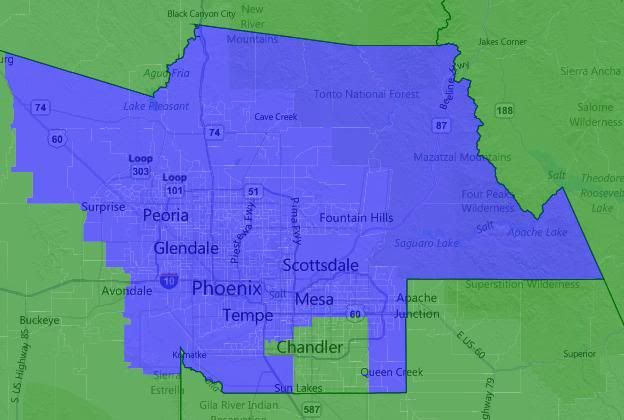
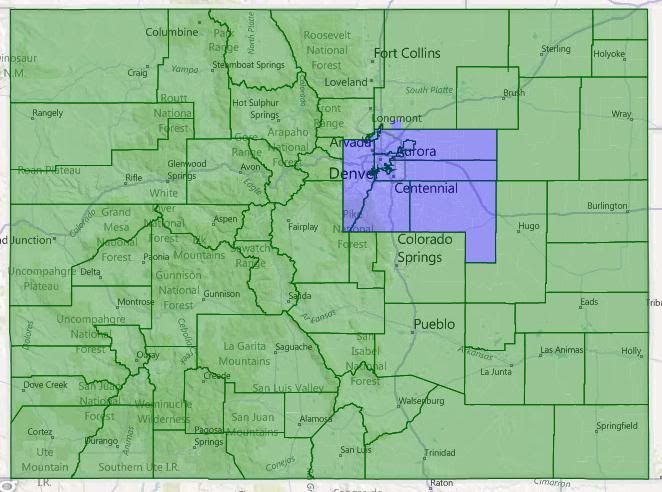
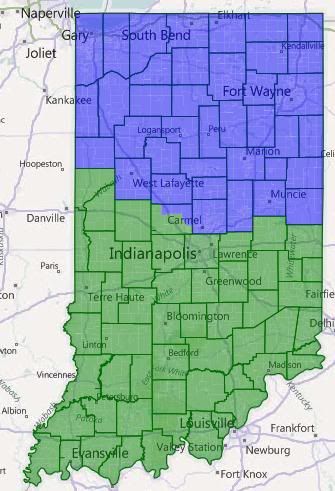
No geographic breakdowns anymore, I’m too tired. Remember, Blue = 1 and Green = 2.

Arizona

Both majority white at 58%. I have no idea if splitting Arizona between Maricopa and outstate helps us. I’ll assume not. Running total: Dem 26, Rep 26.

Colorado

I assume that cutting out Denver is bad for us. Running total: Dem 27, Rep 27.

Indiana

I could see both of these being competitive under the right circumstances. I’m going to give us the northern one. Running total: Dem 28, Rep 28.

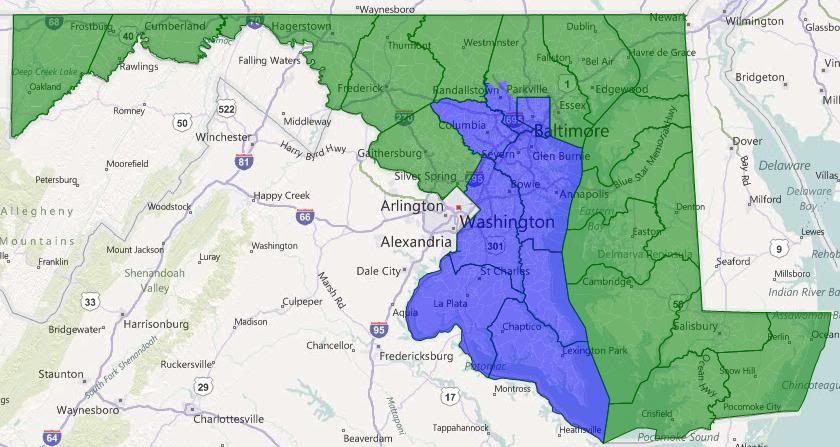
Maryland

CD-01 is plurality black at 45%; this makes the other district more competitive than it ought to be. I still think we take both. Running total: Dem 30, Rep 28.

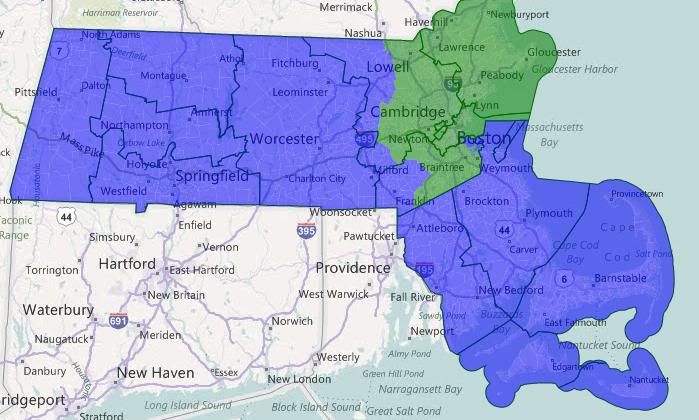
Massachusetts

Let’s go ahead and assume Scott Brown. Running total: Dem 31, Rep 29.

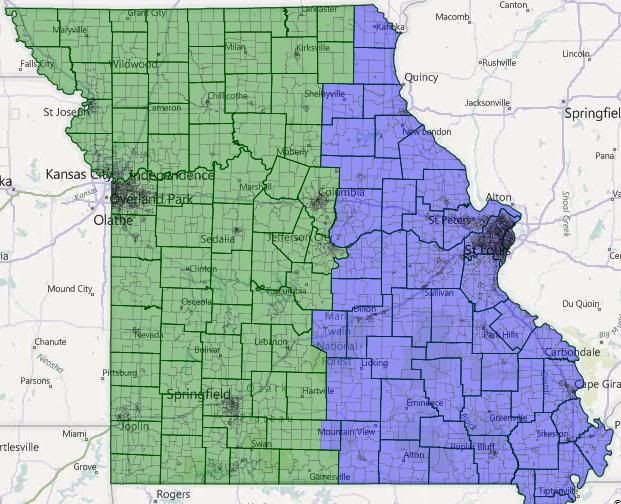
Missouri

No idea what the ramifications of splitting Missouri are. I’m calling it split. Running total: Dem 32, Rep 30.

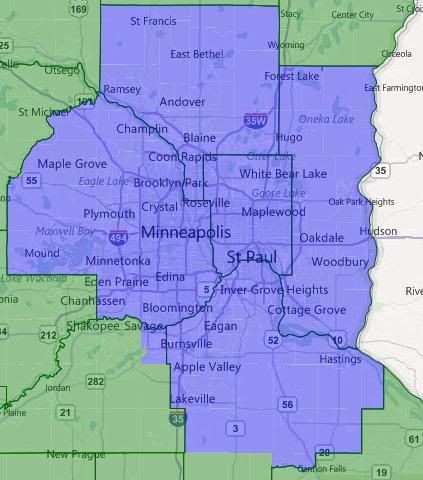
Minnesota

I assume we can hold both of these? Running total: Dem 34, Rep 30.

Tennesee

CD-01 is safe GOP. I could see us competing in CD-02. But running total: Dem 34, Rep 32.

Virginia

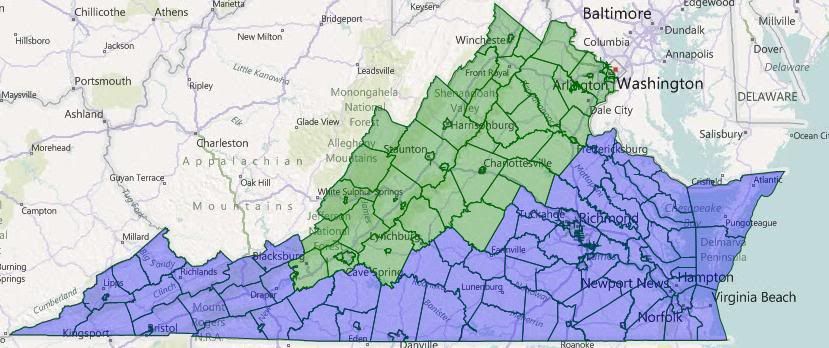
I’m not happy with this division, but everything else looked worse. Both districts should still be winnable for us, so running total: Dem 36, Rep 32.

Washington

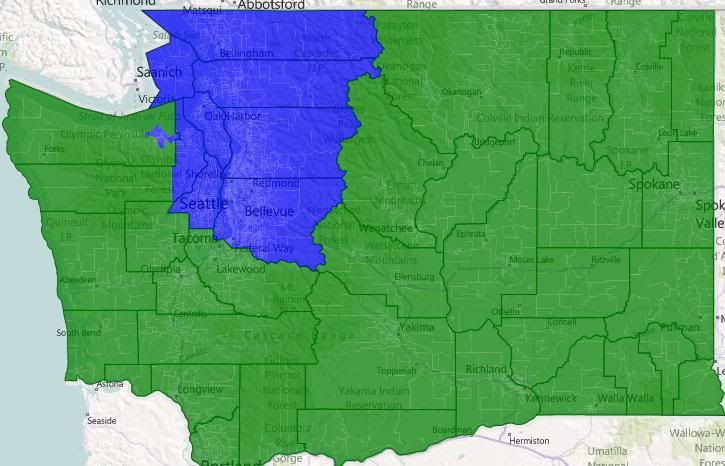
Probably the state where the split harms us most, unless Tacoma and Olympia can outweigh the rest of the state. I’m calling it split, so running total: Dem 37, Rep 33.

Wisconsin

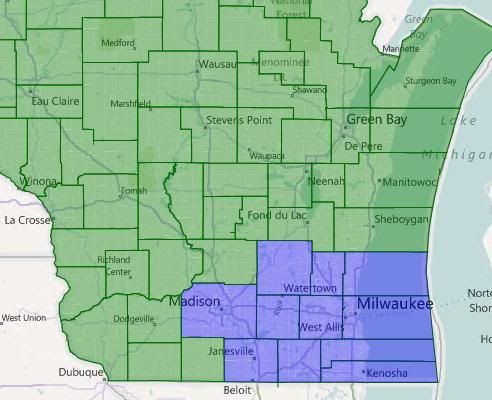
Madison and Milwaukee versus the Circle of Ignorance! The rest of Wisconsin looks on… I’m giving us both, so running total Dem 39, Rep 33.

The Single Senator States

AKA The unfairly advantaged

The remaining 28 states currently have almost enough votes to sustain a filibuster; in the alternate universe, they don’t even have enough to block one.

Northeast

I’d give us Delaware, Vermont, Connecticut, and Rhode Island. Maine and New Hampshire are probably toss-ups, so I’ll get us one of them. Running total: Dem 44, Rep 34.

South

They get Alabama, Mississippi, Kentucky, Oklahoma, and South Carolina. We get West Virginia. And I’ll split Arkansas and Louisiana. Running total: Dem 46, Rep 40.

Midwest

They get Kansas. I’ll split Iowa, Nebraska, and the Dakotas. Running total: Dem 48, Rep 43.

West

We get Oregon, New Mexico, Hawaii and Montana. They get Wyoming, Idaho, and Utah. That leaves splitting Nevada and Alaska. Final total: Dem 53, Rep 47.

Conclusion

Ok, that’s bizarre. I totally didn’t set out to end up where we actually are, it’s just where my guesses lead. Even if my take on this particular exercise didn’t show any partisan bias to the set-up of the Senate, it does highlight just how undemocratic that body is.

Again, please feel free to chime in about who you think would be in office in the alternate universe or to show off your (more gerrymandered?) versions of the alternate universe’s Senate districts.

The Knollenberg Project: Michigan Congressional Redistricting

Conventional wisdom regarding Michigan’s congressional redistricting process to this point has looked towards the state Republicans dealing with Michigan’s lost seat by consolidating Sander Levin and Gary Peters into a single district. Two relatively new sources of information are challenging that wisdom.

First, the actual census numbers came out. And the beating that Detroit took over the last ten years was a lot worse than generally thought. As best as I can tell, it’s no longer possible to draw two majority-black congressional districts in Wayne County. Instead, whichever district is centered on western Detroit is going to have to crossover into southern Oakland County to pick up, at the very least, the city of Southfield. Which suggests the option of having that district scoop up as many white Oakland County Democrats as it can, since it’s in the neighborhood anyway. Which in turn suggests that the relevant pairing is going to be Levin-Conyers, not Levin-Peters.

Second, per a recent digest, state representative Marty Knollenbeg, a member of the redistricting committee and son of Peter’s predecessor, has moved from talking about challenging Peters in 2012 to actually starting the machinery of his campaign, in the form of an exploratory committee. That suggest that Knollenberg thinks Peters (or at least the bulk of Peters’ district) is going to be in such a form that it would be amenable to electing a Republican. Which again cuts against the Levin-Peters pairing.

So: If there’s a district for Knollenberg, some other district is still geting cut. Maintaining two VRA black districts requires one of the Detroit districts to cut into Levin’s Twelfth. Putting that together, perhaps the Twelfth is the district to go? What would that look like?

I explore three possible solutions after the jump.

Common Threads

All three of my solutions have six districts that are identical: MI-01, MI-05, MI-09, MI-10, MI-13, and MI-14. The new MI-12, which is now the designation for Dingell’s district, stays more or less in place for all three maps also. Here’s the process by which those six districts were built.

First, the inner Metro Detroit districts. Basically, all three of these maps are looking at scenarios where MI-14, based in western Detroit, takes in the western (Oakland County) portion of the dismantled MI-12, while MI-13, based in eastern Detroit, takes in the eastern (Macomb County) portion of the dismantled MI-12.

The particular version stretches MI-13 to its breaking point — it’s almost literally 50%+1 black by VAP. (It’s 50%+218.) It takes in heavily Democratic Warren, Eastpointe, and Roseville, along with not quite so Democratic St. Clair Shores. (I’m realizing now that I should look at scenarios where St. Clair Shores is in MI-10.) It’s forced into taking the Grosse Points and Harper Woods, and after that it can’t take any more non-black population. That’s why MI-14 has the odd arms to take in white Hamtramck and hispanic southern Detroit.

Besides those arms, MI-14 takes in the rest of Detroit, and then moves north in Oakland County, taking in Southfield for its black population, and the spreading east and west to take in the most Democratic parts of southeastern Oakland. It can’t quite do this cleanly, the little city of Clawson ends up split between it and the undrawn MI-09.

MI-12, having been dismantled, is then reborn as the designation for Dingell’s district. It takes in the most Democratic of the Wayne County suburbs, leaving the western tier of townships for McCotter (or at least he hopes so). Note that dismantling and relocating MI-12 in this way prevents Dingell from hanging on to Ann Arbor, which is going to be problematic for the Republicans later.

Then MI-10. It takes up the rest of Macomb, and then fills its balance by taking in as much of St. Clair County as it can. There’s been significant population growth in St. Clair and northern Macomb. This, combined with the fact that MI-13 isn’t taking in all of the old MI-12’s portion of Macomb County, causes Candice Miller to lose most of her Thumb Counties.

Obama won Macomb County by about a 36k margin. Warren by itself accounts for about 13k of that margin. The rest of MI-13’s part of Macomb County is about another 15k. That means that the rest of the county went for Obama by about an 8k margin, out of about 285k total votes (for the rest of the county.) Obama won the part of St. Clair County that’s in this district by about 3k out of 72k. That adds up to Obama winning this district by 11k out of 285k total votes. That’s not going to be as comfortable as for Candice Miller as her current R+5 district, but it should be manageable.

And now the Thumb. The Thumb Counties proper are fairly Republican, so I’m assigning them to our rebuilt MI-09 (which will also be taking in a good part of Oakland, as you’ll see later). That implies the assigned shape for MI-05: Gennessee and Bay Counties plus the most Democratic parts of Saginaw County that will fit.

Which in turn implies this shape for MI-01. Having been kicked out of Bay County by MI-05, it needs to pick up population somewhere, and adding Republican Grand Traverse County to it will help anchor it for Benishek. One goal going forward is to keep that move from harming Dave Camp too much.

Okay, so with those 5-6 district set in place, what sort of options do we have for the others?

Interlude

The current Republican map of Michigan has some very finely wrought pieces. In particular, they went out of their way to make sure that most of Michigan’s Democratic-leaning cities in the outstate ended up in separate districts where they could be drowned out by rural and exurban voters. The cases in point: Muskegon in MI-02, Grand Rapids in MI-03, Kalamazoo in MI-06, Lansing in MI-08. MI-07 was such a case when it was created, keeping Battle Creek safely away from more Democrats (Jackson, so far as I can tell, is swing-tilt-Republican); but Lansing’s western suburbs in Eaton County have blued significantly over the last decade. They then decided that Flint-Saginaw-Bay City was too dangerous to crack, and also packed in Ann Arbor with the southern Detroit suburbs.

This analysis is important because, while we’ve maintained the packed district for Flint, we weren’t able to maintain the Ann Arbor to Dearborn packing. And none of the outstate districts can afford to take on Ann Arbor in addition to the existing Democratic city that they’re warding. The upshot of this is that if Knollenberg is successful at getting a seat made for himself, and if I’m right that Levin’s is then the disappeared seat, then Knollenberg is going to be creating a seat for himself at some other Republican’s expense.

Said another way, the current breakdown of the delegation is nine Republicans and six Democrats. One seat needs to go away; the Republicans obviously want it to be a Democratic one. In addition, Knollenberg is trying to flip a Democratic seat into a Republican one. That would make the delegation 10-4. I submit that it’s impossible to make a map of Michigan with only four districts that are Democratic. 9-5 is the GOP max. Since there are 9 Republicans already, adding another one to the delegation necessarily involves booting an incumbent.

In all three of my sample maps below, that person is Tim Walberg. This is because he is (1) a freshman who is (2) out of step with his swing district which can (3) be made into another MI-05-esque medium-sized-city Dem vote sink. The three options are named for the cities that the new MI-07 covers.

Option 1 — Ann Arbor, Battle Creek, Delta Township

Option 1 has MI-07 cover central Michigan from Ann Arbor to Battle Creek, with an arm reaching out to take in the western suburbs of Lansing.

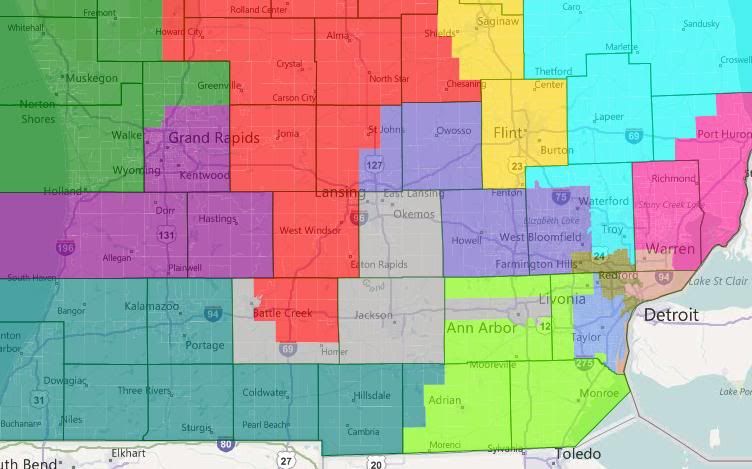
In the west, MI-02 subsumes deep blue Muskegon and the swingy coastal counties with deep red Ottawa and north Kent. (Although not picture, MI-02 takes in all of the coastal counties up to Leelanau. MI-04 has the interior counties that aren’t in MI-01.) MI-03 takes a third of a turn clockwise, dropping Ionia and most of Barry to grab Allegan and Van Buren. Camp’s MI-04 replaces its loss of Republican Grand Traverse with very Republican Ionia and Barry.

Upton’s MI-06 now stretches across southern Michigan, where he picks up an unwelcome constituent in Tim Walberg. Rogers in MI-08 is left to hold down more-or-less the same district that he has now.

Finally, there are the two metro Detroit districts. Knollenberg here adds the northwestern third or so of Oakland County to the Thumb Counties to make the new MI-09, resulting in a reasonably Republican district, even if he’s still holding onto Pontiac. McCotter actually gets shored up here, I think. He picks up Democratic West Bloomfield but loses the most Democratic parts of his current district, which I think balances out in his favor. He also gains Monroe County, which I’m under the impression is swing or lean-Republican these days.

Overall, I think this is the best of the three options for the Republicans. One problem is that having two Oakland-Wayne districts probably violates Michigan’s redistricting standards. That’s more of a political problem than a legal one, though.

Option 2 – Ann Arbor, Battle Creek, Lansing

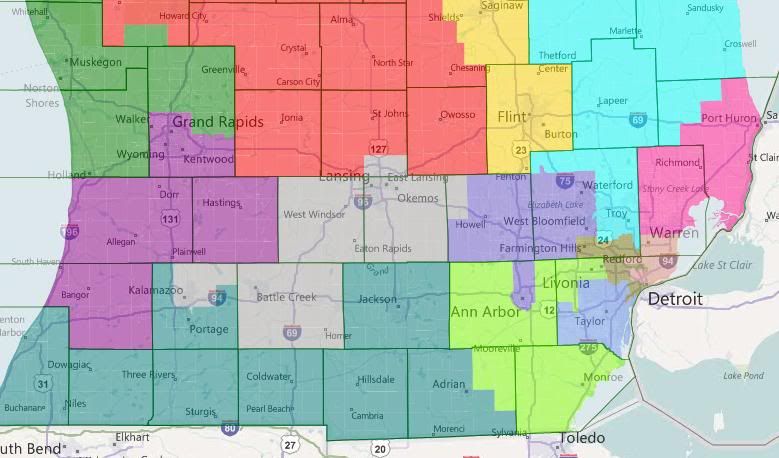
Option 2 has MI-07 cover central Michigan from Lansing to Jackson, with obviously-gerrymandered-yet-Michigan-standards-compliant arms to pick up Battle Creek and Ann Arbor-Ypsilanti.

Off-screen, MI-02 has picked up Wexford, Lake, and most of Newaygo Counties from MI-04, which is has in turn picked up the rest of Eaton and a big chunk of Calhoun. This is bad for Dave Camp. In other news worth mentioning, Walberg is now McCotter’s problem — although the massive amounts of Washtenaw he also picks up are an even larger problem. If I recall some math I did the other day, if you exclude Ann Arbor, the rest of Washtenaw voted 2-1 for Obama. Excluding Ypsilanti also helps, but not that much.

Overall, this map is better for Upton, Amash, and Rogers; and worse for Camp and McCotter.

Option 3 – Battle Creek, Kalamazoo, Lansing

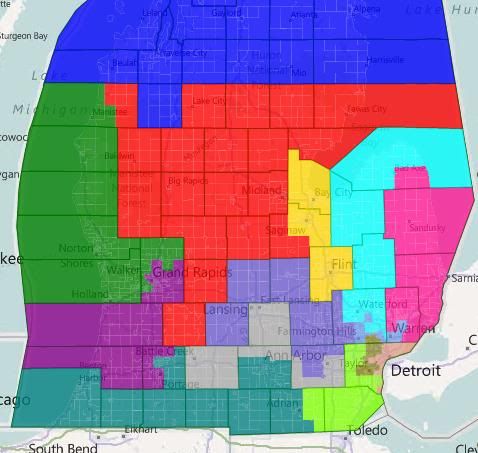
Option 3 has MI-07 cover central Michigan from Lansing to Kalamazoo without dealing with the Ann Arbor problem.

Offscreen, we’re back to the arrangment of the first map — coastal = MI-02, interior = MI-04. Walberg is back to being Upton’s problem — but he’s also lost Kalamazoo, so that’s a legitimately Republican district now. Amash and Camp should both be happy. (Amash’s district in this arrangment, incidentally, is at zero-deviation from ideal.) Rogers should be okay — taking in Ann Arbor for Lansing-East Lansing should balance out. But McCotter’s still in trouble — again, even without Ann Arbor, Washtenaw is a 2-1 Obama jurisdiction.

Bonus Option

As I was writing the diary, I had the inspiration for a pro-Knollenberg, anti-Walberg map that cut out Dingell instead of Levin. MI-13 is 52.2% black VAP, MI-14 is 53.4% black VAP. Here it is without further commentary, because I need to get myself to bed.

Michigan State House Redistricting, Part I

This is first in a series of diaries looking at redistricting in the Michigan State House. I’m not totally sure how many parts there will be yet. The current diary is focused on Wayne County, home of Detroit, and the county with the worst numerical net loss of population over the last ten years of any in the country — just short of a quarter million.

The upshot here is that Wayne County currently possesses 23 state house districts; with the population loss, it’s going to drop to 20. All three seats loss are Detroit-based.

Michigan has a 110-member state house. In 2010, the Republicans gained nineteen seats while losing none, to take control of the chamber by a 63-47 margin.

I haven’t done a full map yet, so I don’t know for sure where those seats are going, but I have to assume that the loss of three safe seats in Detroit is going to make the task of regaining the chamber even more difficult for the Democrats.

Maps and more after the jump.

Note: ideal district size is now 89,851 people. The allowed deviation is 5%, I believe, which translates to 4492 people.

Old Districts

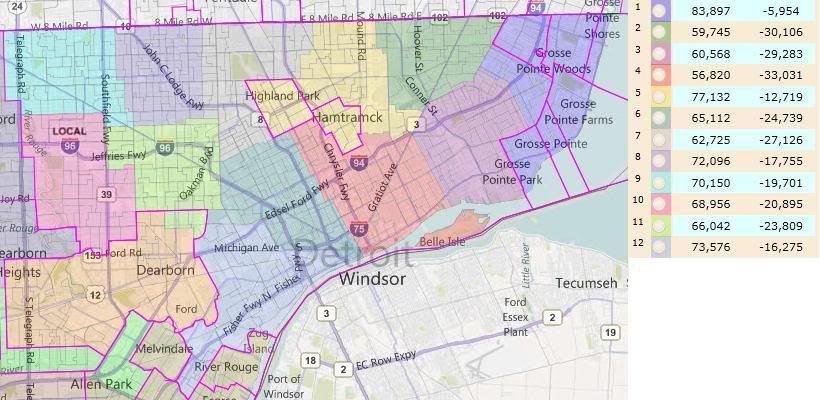
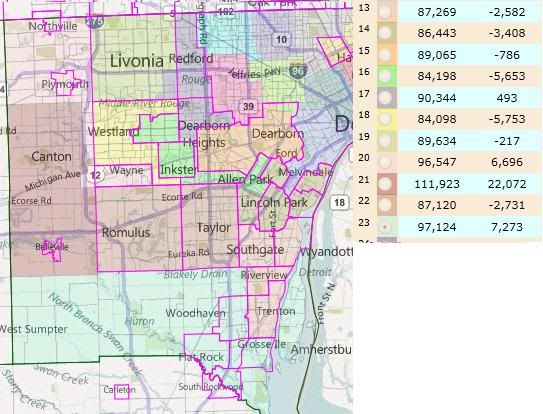
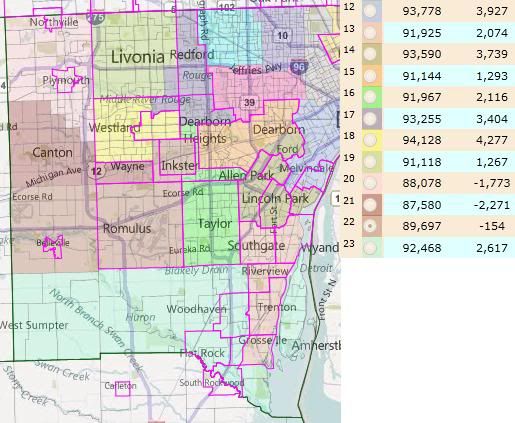
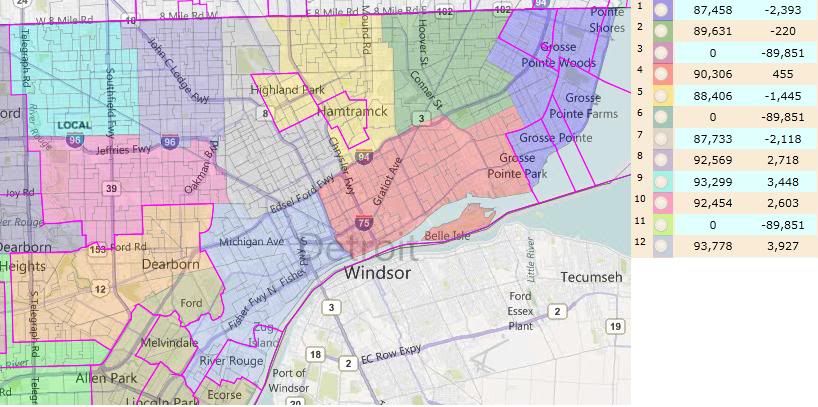
Here’s an approximation of the current districts based solely or partially in Detroit in Dave’s App:

Notice how under-populated the Detroit-based districts are. HD-01 (Grosse Pointes) is majority white; HD-12 (Southern Detroit) is majority Hispanic (total population, just short on VAP); the rest are majority African American. HD-01 is the only competive district, going 54-46 Democratic in 2010. The rest are safely Democratic.

Here’s the approximation of the rest of the county’s districts:

I lightened the colors to make the locality boundaries stand out. This obscures, to my vision, one of the district boundaries. The boundary between HD-14 (Northern Downriver) and HD-22 (Romulus/Taylor) is the Taylor/Allen Park city line.

Surprisingly, to me, there are actually four districts that are overpopulated; three of which are outside the allowable deviation. HD-21 is going to have to be broken up — that’s a really significant positive deviation.

Republicans hold three of these seats: HD-19 (Livonia), HD-20 (Plymouth/Northville), and HD-23 (Southern townships). Of the remaining seats, only HD-21 is competitive. The Democrats held on in 2010 by 51%-49% – about 900 votes. All of these seats should be winnable by the right Democrat in the right environment — I’m pretty sure, for example, that Obama carried every Wayne County district. Also, I’m reasonably certain that HD-20 would have the most Republican PVI, and it was a 2010 pickup for them.

Collectively, the Wayne County districts are 246k underpopulated. The twelve Detroit-based districts account for all but .8k of that shortfall. (That is, the number of non-Detroit-based districts is the same. All of the districts lost in Wayne County will be Detroit-based.)

New Districts

Michigan redistricting standards encourage linedrawers to maintain the integrity of localities where possible. This is the arrangement that I came to while redistributing the eleven non-Detroit-based districts within the limits of that guideline, while trying to protect the three Republican incumbents.

HD-23 (Southern townships) and HD-13 (Southern Downriver) are the only truly clean districts, with Gibraltar having been swapped from the former to the latter.

HD-21 needs to be broken up. Plymouth, Plymouth Twp, Northville, Northville Twp, Canton and Wayne combine to within 4k of the ideal for two districts. A real Republican plan would take into account how best to split Canton to their advantage; my selection of precincts to end up in HD-20 and HD-21 was arbitrary. HD-21, however, should end up more Republican than before: Van Buren Twp and Belleville together are both more Democratic and larger than Wayne.

Livonia and Dearborn are each slightly too large to be single district. I maintained Livonia’s current donation to HD-17, Dearborn ends up donating into HD-14 (Northern Downriver) instead of into Detroit. This is because HD-14 was too large with River Rouge (which therefore ends up in a Detroit-based district) but worked with the donation from Dearborn.

With Van Buren/Belleville bounded on the north by HD-21 and on the south by HD-23, the only place for them to go was into HD-22 to the east. This required Romulus and Taylor to split. I ended up combining Romulus/Van Buren/Belleville with Inkster and enough of Westland to connect them (the portion south of Garden City and east of Merriman Rd), thereby creating an African-American opportunity district. (It’s W 46.8, B 44.9 by total pop; W 50.7, B 42.4 by VAP.) Taylor then combines with the portion of Dearborn Heights south of Ford Road to make HD-16.

The final two districts are then HD-18 (Garden City and the portion of Westland west of Merriman Rd) and HD-17 (Redford, the part of Livonia not in HD-19, the part of Dearborn Heights not in HD-16, and the part of Westland not in HD-18 or HD-22).

The Detroit-based district here are more representative than predictive. I don’t know enough about the incumbent representatives to know which the Republicans might favor or disfavor through redistricting. But you can see in general terms what Detroit looks like with three fewer districts than before.

HD-01 is still majority white, although slightly less so. (It should therefore become less competive for the Republicans.) HD-12 is no longer majority Hispanic. It previously contained every heavily-Hispanic precinct it could; its necessary growth diluted the Hispanic percentage down to 44.5% by total population and 39.2% plurality by VAP.

Conclusion

Republicans could potentially net as many as four state House seats in Wayne County from their control of the redistricting process: the three that are disappeared from Detroit (depending on where they end up) and HD-21, a competitive seat that will be somewhat less Democratic than before.

Michigan Redistricting: An Unexpected Problem

Maintaining two VRA majority-African-American districts in the metro Detroit area is going to be much more of pain than I originally thought. In the relevant population by CD thread, I breezily commented:

And, on an even more important “not-to-mention” note, the Detroit metro area still has more than enough African Americans for two VRA districts, so consolidating MI-13 and MI-14 isn’t in the cards quite yet.

This is not untrue, but the measures required to get those two districts were a lot more dramatic than I expected. The most recent Census estimates painted a very different picture from the actual Census’s report of massive population loss in Wayne County. And so the new districts are likely to be quite different from what I (and others) had previously imagined.

After the jump, I present two different scenarios for the Detroit area districts. Please feel free to post your own — this is very much more about getting a discussion going than presenting anything close to a polished proposal.

Map 1: Skirting the Line

So far as I can tell, this is the best you can do in terms of maximizing the African American percentages of the two Detroit districts while staying in Wayne County. However, the two Detroit districts are majority African American by total population, but not by VAP. So to the best of my understanding of current case law, this solution is VRA-suspect.

Which is unfortunate for the GOP, because this is reasonably successful map for them. Basically, this is an attempt to cut out both Dingell and Peters, while replacing one of their districts with a new safe Ann Arbor plus Lansing district.

District-by-district, briefly:

Benishek’s MI-01 (Blue) is shored up for the Republicans with the addition of Grand Traverse County. Likewise, Upton’s MI-06 (teal) gains Allegan County. Amash’s MI-03 (purple) holds more or less steady, as does Miller’s MI-10 (pink).

Huizenga’s MI-02 (green) – currently the most Republican district – absorbs a couple of problematic counties from Camp’s MI-04 (red). MI-04 is a little shaky for the Republicans, but I’m not sure how to fix that.

Walberg’s MI-07 (grey) loses Eaton and outer Washtenaw County and picks up Monroe County and the southern tier of Wayne County – I could be wrong, but my instincts tells me that’s a wash. Kildee’s MI-05 (yellow) stretches north to take in more of the Thumb and all of Bay County, which marginally weakens it for the Democrats. MI-09 (cyan) is a new heavily Democratic open seat stretching from Ann Arbor to Lansing.

Then, we move into the Detroit Metro area. Massive population loss in Detroit causes Conyer’s MI-14 (brown) and Clarke’s MI-13 (salmon) to chew up most of the Wayne County portions of Dingell’s dismantled MI-15. They’re 50.6% African American total pop, 49.6% VAP and 50.3% African American total pop, 49.5% VAP respectively. Levin’s MI-12 (cornflower blue) stays more or less the same, picking up the rest of Royal Oak from Peter’s dismantled version of MI-09.

Speaking of which, that’s been bisected between McCotter’s MI-11 (lime) and Rogers’s MI-08 (slate blue). McCotter picks up Peters himself and some of the more Republican parts of the dismantled Ninth. Rogers gets some of the most Democratic parts of the old ninth in West Bloomfield, Pontiac, and Auburn Hills — but he no longer has to worry about Lansing, so he should still be fine.

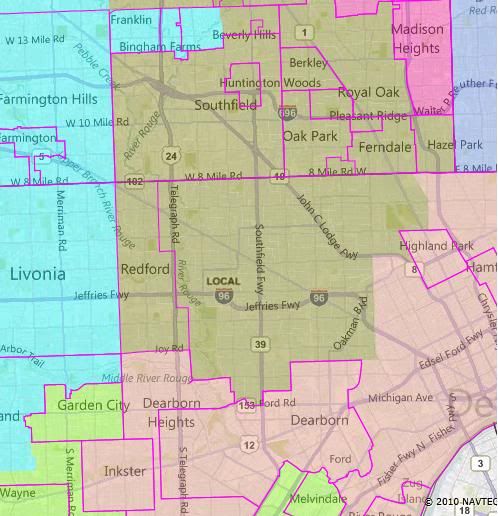
Map 2: The Problem of Pontiac


Same thing, just zoomed in with locality lines

This one really just focuses on the two Detroit districts. In contrast to the first map, you’re looking at two true majority African-American districts. MI-13 (salmon) is 53.0% African American on both measures. MI-14 (brown) is 56.5% African American by total population, 54.6% African American by VAP.

So far as I can tell, stretching Conyers’s district over into Oakland County like this to pick up Southfield and Oak Park is the only way to get the two Detroit districts to combine into majority-African-American status. Having done that, stretching up to majority-African-American Pontiac seems to make a lot of sense.

Having Clarke’s district stretch through Dingell’s Dearborn to get to majority-African-American Inkster isn’t strictly necessary to get to 50% African American by VAP, but it does help.

Now, if I’m right in my understanding of case law and this basic configuration is necessary to comply with the requirements of the VRA, then state GOP has a problem on its hands. They can’t draw a district for McCotter that (1) he can win and (2) conforms with state redistricting standards.

Michigan state redistricting standards frown on county and locality splitting and are generally understood to prohibit what user rdelbov generally calls a “double-cross” — that is, having Districts X and Y share both Counties A and B. If you look over the current map, you’ll see that interpretation seems to have been followed under the last GOP gerrymander. McCotter’s district is the one allocated Oakland-Wayne split district. If Conyers’s district becomes one, then McCotter’s district, under state redistricting standards, can’t do that any more. But McCotter lives in Wayne County, and he needs those Oakland County Republicans to have a winnnable district.

Now, the potential out here is that, so far as I understand it, the state Supreme Court basically declared the state redistricting standards non-justiciable the last time a suit was filed based on them after the 2000 round of redistricting. So if the GOP wants to ignore them, they probably can.

I drew in sample districts around the two Detroit districts. The Detroit metro area ones more of less work, from a GOP perspective, although some of the non-pictured outstate ones were pretty ugly. But without knowing how to resolve the “double-cross” conundrum, I wasn’t really sure how to proceed.

Wrap-Up

So, which is the better way for the GOP to push the limits of redistricing law? Two only-borderline majority African American districts in Detroit? Or violate (potentially unenforceable) state law and have two districts cross the Oakland-Wayne border? Or do you have a better solution altogether?

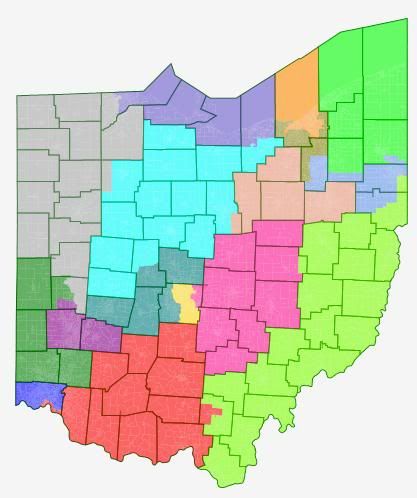
Ohio Two-Ways: Fair Districts & GOP-Friendly

This diary presents two different flavors of Ohio maps: Fair Districts (a la Florida) and GOP-Friendly. Ohio doesn’t have partisan data in the App, so these maps represent my best guesses. I definitely consider these maps to be more discussion-starters about maps under the newly-released 2010 data than polished proposals. In the comments, please feel free to share your own maps or information about local partisan leanings that needs to be taken into account.

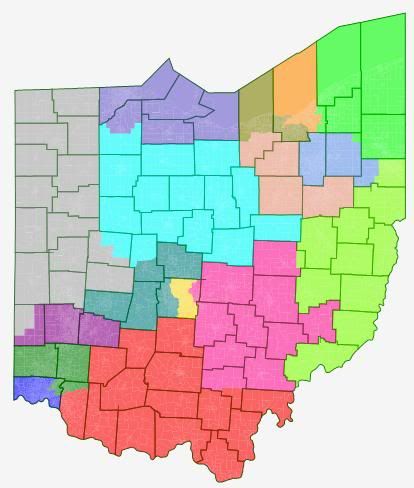
Fair Districts


Ohio’s geography doesn’t lend itself to “must draw” fair-districts as much as Florida’s does, but I think this is a pretty good stab at it. All three of the counties big enough to support a single district have them, and the rest of the districts are reasonably compact. There are 13 counties statewide split between two or more districts. Columbus is the only incorporated locality split between districts. This is mostly because Columbus has some bizarrely intricate boundaries that are hard to follow. I ended up using the Scioto River as my boundary guide instead of city limits.

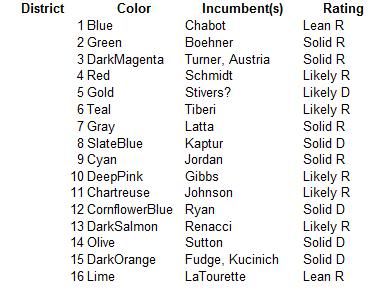
If my ratings are to be trusted (and they probably aren’t), this would be a 9 R – 7 D map. VRA note: OH-15 is a plurality African American district, 47.0% VAP.

GOP Friendly


I used the first map as a base, which is probably not the best idea. But I like good-government maps, and I wanted to try to find a GOP map that conformed at least somewhat to good-government principles. All changes described are relative to the Fair Districts map above.

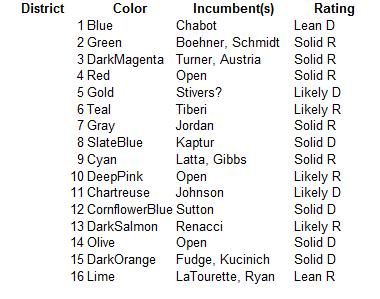
The basic idea here is to pair up Turner and Austria in a Dayton-based district and to pair up Fudge and Kucinich in a Cleveland-based district. Columbus also gets a Democratic vote sink, which means that this map calls for the Republicans to take the hit on both seats. That might not sound “GOP-Friendly”, but they’re maxed out in Ohio post-2010. I think 11-5 is not a bad target for them.

So what’s changed?

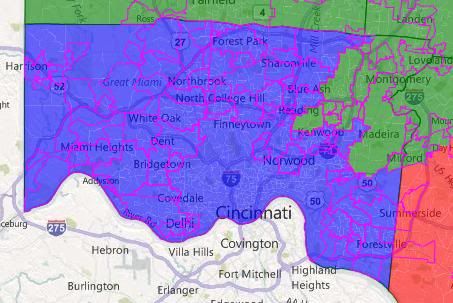
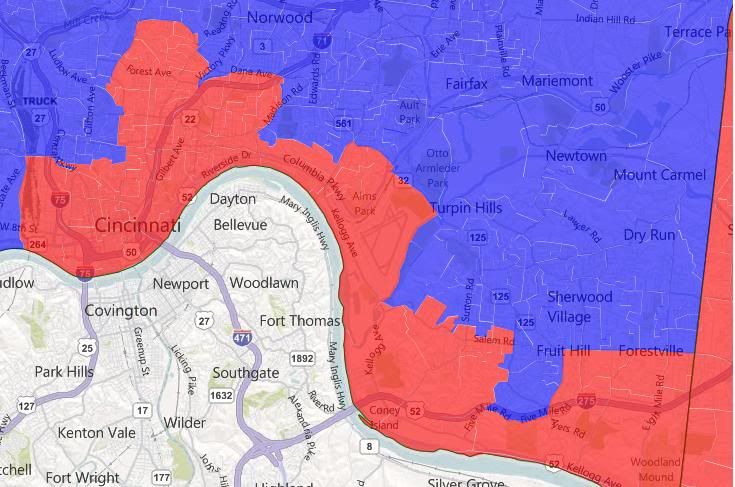
First, Cincinnati. Hamilton County is about 80k too many people for a district. In my Fair Districts map, that 80k were suburban whites added to Boehner’s district. In my GOP-Friendly map, that 80k is a plurality-African-American strip along the Ohio River, mainly in downtown Cincinnati, added to Schmidt’s district. Schmidt might not be able to carry a district that incorporates that part of Hamilton. But most Republicans should be able to, so I think worst case scenario is that they lose that district for a cycle. I’ve also wrapped Boehner’s district around Dayton again, so that he has more of his current constituents.

Second, the northwest. Kaptur’s (under this map) OH-08 has been stretched eastwards, pulling OH-07 and OH-09 north. OH-07 and OH-09 have also swapped some territory. I’m pretty sure under the Fair Districts maps the district that Latta lives in has more of Jordan’s old constituents and vice versa. I tried to rectify that here.

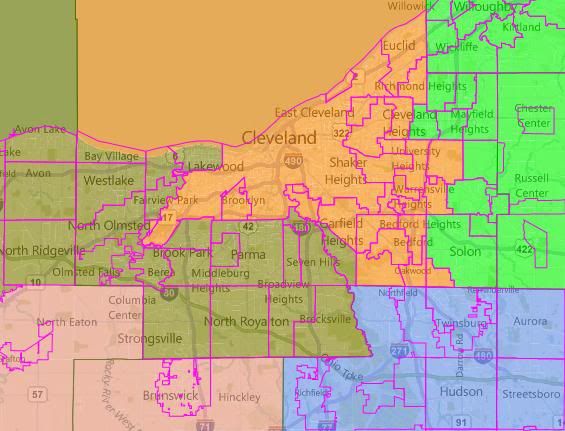
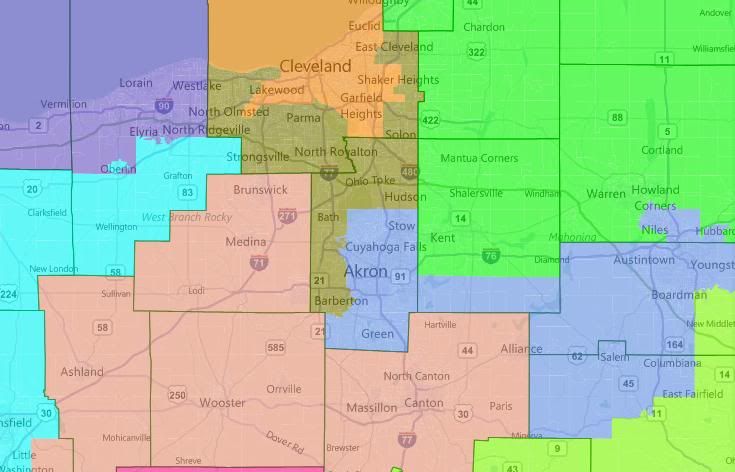
Third, the northeast. There are some major changes here. OH-08 and OH-09 have subsumed Lorain County. This has push OH-14 south and east, where it picks up all of Cuyahoga outside of OH-15 and plunges down into Summitt County and (re)gains Sutton as its incumbent. OH-12 becomes a dumbbell-shaped district linking Akron and Youngstown. It does some swapping with the neighboring OH 16 and OH 11 to get incumbents’ residences right. OH-13 drops out of Lorain and picks up Ashland, shoring it up relative to the Fair Districts map. I would be worried as a Republican about LaTourette, because without partisan data, I’m not sure were he stands in that district.

Fourth, the southwest. Johnson’s district drops Youngstown, to his relief. It stretches south into OH-04 (which went into Cincinnati). It still needs to grow though, so it pushes OH-10 north. This is convenient, because OH-10 needed to come north so that Gibbs would live in it. (I think he lives in Holmes County, but I’m not sure.)

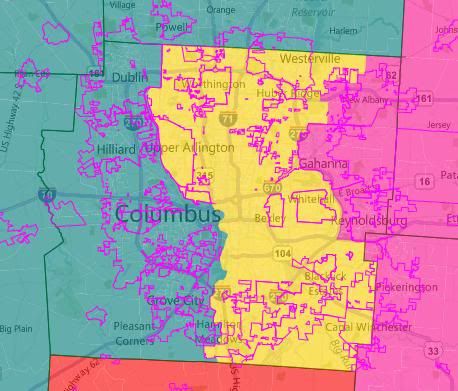
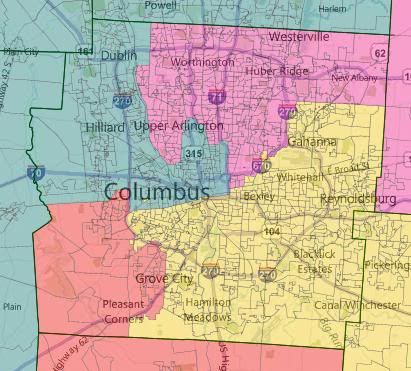
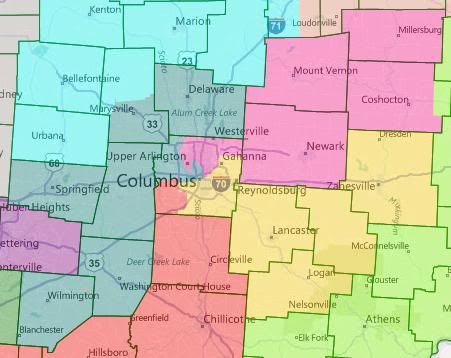
Lastly, Columbus. This probably ought to change, since if the Republicans do create a Democratic vote sink here, they’ll want it to be the best one possible. But without partisan data by precinct, I have no idea what that looks like. If the Republicans aren’t willing to concede a distrct in Columbus (which seems likely, if foolhardy), I think they should probably look at splitting Franklin four ways. Again, without partisan data (and without knowing where exactly Stivers lives), it’s hard to say what that should look like. But here’s a possibility:


North Carolina without an I-85 NC-12

I just wish I could see ten different ways of dealing with the Democrats in the Triad, rather than ten different variations that all deal with them the same way: using NC-12.

roguemapper

Two of the most recent NC redistricting diaries have featured roguemapper’s cri de couer against I-85-based NC-12s in their comments. Here, I’m only delivering two different ways of dealing with the Triad Dems instead of ten. I hope the comment section will make up for the missing eight.

The argument against an I-85-based NC-12 is threefold: (1) it was upheld in the courts as a partisan-based and not minority-based gerrymander; (2) creating a minority-majority NC-12 barely requires leaving Charlotte, let alone Mecklenburg County; and (3) state Republicans have said they don’t want one. I’m currently too lazy to source any of those statements and I’m not interested in arguing them. My purpose is to discuss North Carolina maps that treat that argument as true. Think about it like a move trailer, if it helps:

(booming movie announcer voice) In a world where North Carolina Republicans are committed to a compact, Charlotte-based, minority-majority NC-12… (/booming movie announcer voice)

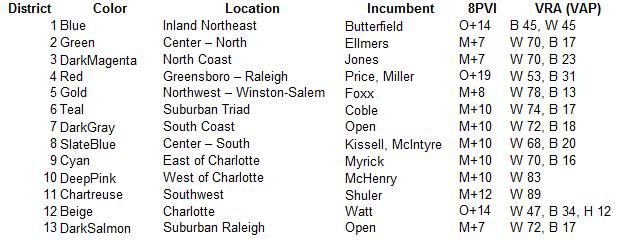
I’m presenting two maps here. One is an  unaggressive and therefore unlikely map that cuts out Kissell but gives the Democrats a new district in the Triad. (It’s also got retrogression issues.) I’m posting it because I think it’s an interesting baseline for what a minimally gerrymandered map could look like. There’s a grand total of ten counties statewide that are split between two or more districts. The other is an extremely aggressive map which creates 10 McCain districts.

Pictures and discussion are after the jump.

(Note: I don’t generally like changing colors, because I’m used to the defaults and I assume others are too. But there are too many blues in the first 13 colors for a NC map. On the first map, NC-08 is Beige. On the second map, NC-12 is Beige.)

Map One


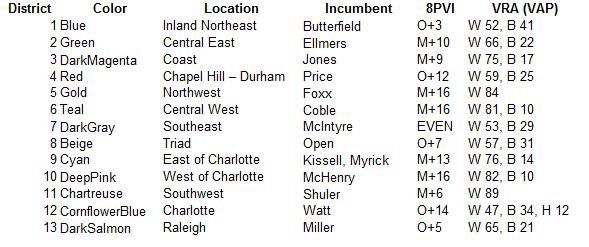
Not much to say about this one. It’s my best attempt to use county integrity as my first priority, with partisan effects as my second. All six Republicans should be fine in districts that McCain carried by at least 9 points by at least 5 pts. Correction: The preceding sentence was incorrect. My 8PVI rating means that McCain did at least 9 pts better than he did nationally in all six Republican districts, but that only means that he won them by at least 5 points, not 9. The seven Democrats have a more varied range of impacts. Shuler and Miller are in districts that are about one point more McCain-friendly. McIntyre’s district gets a seven point boost in Obama-friendliness. Kissell’s district is axed and relocated to the Triad. Miller and Watt hold steady.

NC-01, obviously, would be contentious. There are retrogression concerns in having it become majority-white in terms of VAP (total population it’s merely plurality white). It’s also lost about six points worth of Obama-friendliness. Something like this would require a Republican legislature that’s willing to test the bounds what the courts will let them get away with. If they were willing to adopt the rest of the map (not likely), some playing around with borders of NC-01 and NC-03 should be able to result in better districts for both Jones and Butterfield and satisify retrogression concerns.  (Note that this map has Jones drawn out of his district.)

I don’t actually endorse this version of NC-01 — again, this particular map is meant to be a baseline for county-integrity. This is important primarily because the Republicans in charge of redistricting have been talking a big game about a clean map. I wanted something to be able to compare to their eventual map.

Map Two

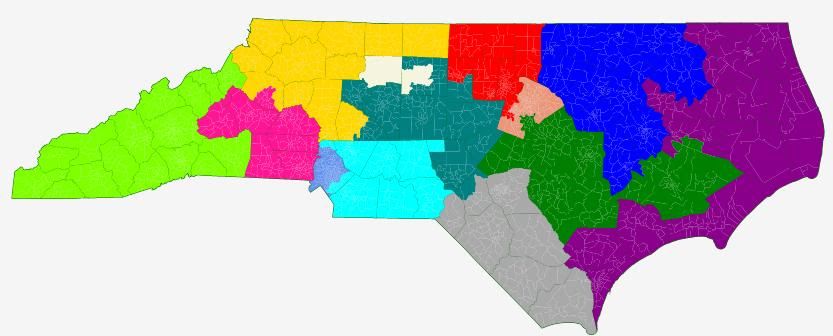
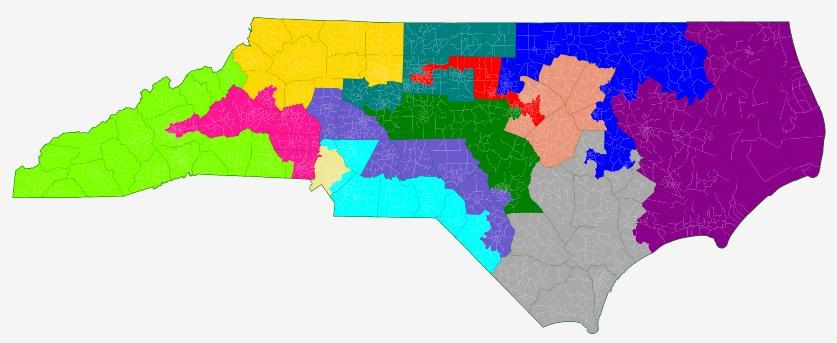
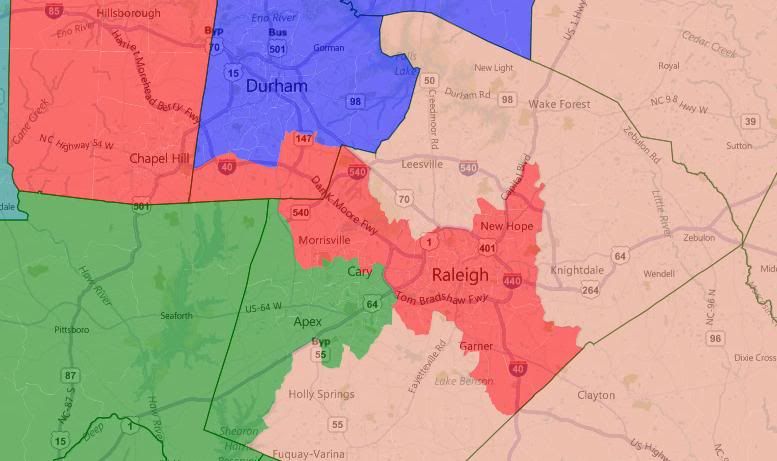
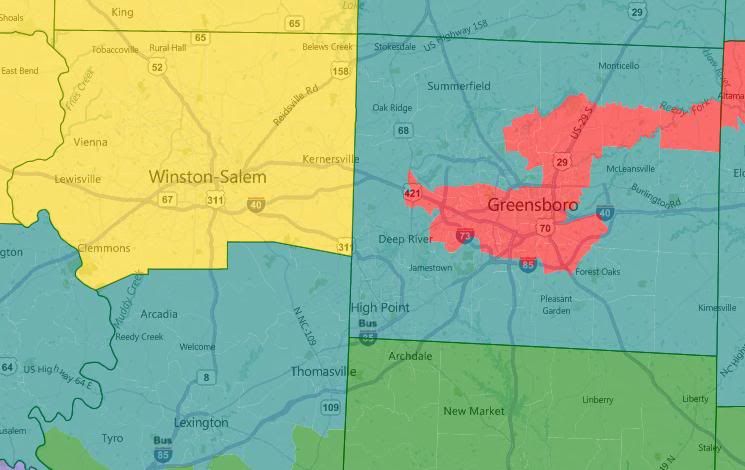
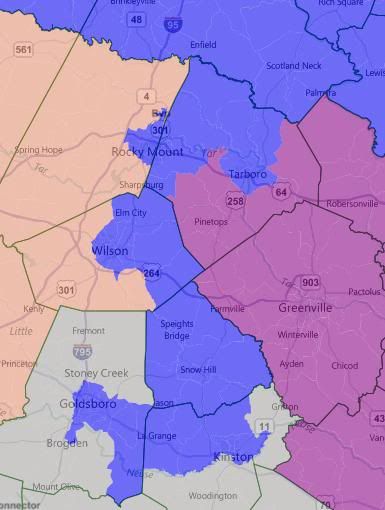
There should be more to say about this one, since it is an actual proposal. But I’m tired, so I’m going to let the pictures tell most of the story. This is, ostensibly, a 10-3 map. Note that is a fairly clean map as well, with a total of 19 counties split between two or more districts.


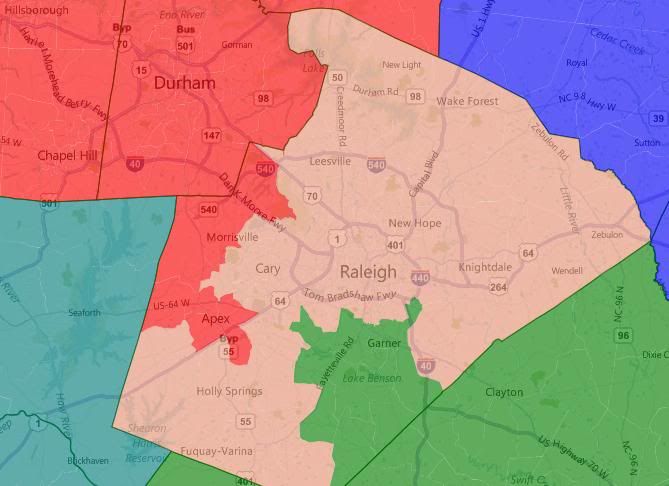
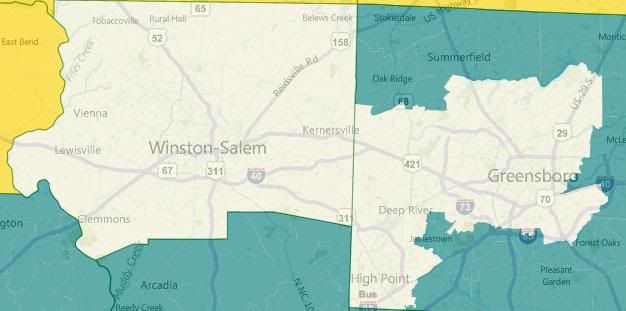
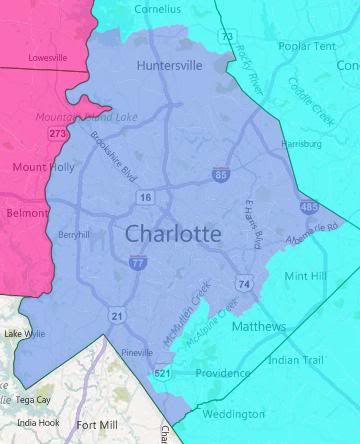
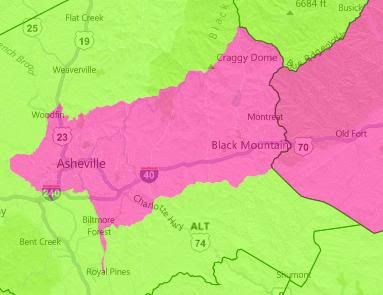
The three Democratic districts are Durham + the core of the old First, Greensboro + Chapel Hill + downtown Raleigh, and Charlotte. Foxx’s district is red enough to absorb all of Winston-Salem easily. McHenry’s is likewise red enough to absorb Asheville.

I’ve lumped two incumbent Democrats into one uber-Democratic seat in the north and two incumbent Democrats into one fairly-Republican seat in the south. I’m curious how the primary process would play out in this NC-04.

There are two new Republican open seats. Note how evenly spread Republican strength is — all in the McCain +7 to +12 range.


Update: Re-reading my diary, I realized that I incorrectly described the meaning of my 8PVI rating. I’ve struck through and corrected a sentence up in the Map One section. 8PVI is based on Cook PVI but only uses 2008 voting data. It’s a measure of how much better Obama or McCain did in a jurisdiction than they did nationwide. The nationwide balance was 53.5 Obama to 46.5 McCain. So O+10 means Obama won a jurisdiction 63.5 to 36.5. M+5 means McCain won a jurisdiction 51.5 to 48.5.

By what margin will Bob Shamansky win?

View Results

Loading ... Loading ...

2010 Virginia & Majority-Minority Districts

This is just a quick diary playing around the new version of Dave’s App and the new 2010 Census data for Virginia.

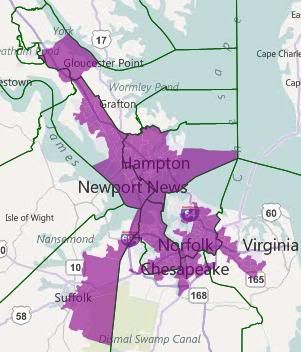
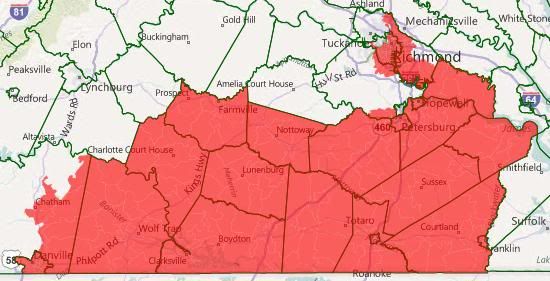
My first interest in playing with the new Census data was to figure out if two African-American-majority districts are possible, as most recent estimates have indicated. They are:

Here are the stats for those districts:

As you can see, it was just possible to make those two districts majority African American.

Here are close-ups of those two districts:

I found NoVA interesting too. In my ACS version of this map, which I don’t think I ever posted, VA-08 and VA-11 both fit entirely within the confines of Fairfax County and the closer-in localities, with a small amount of population left over. This ended up being true in the Census data as well.

What was different was VA-10. The ACS version took up the remainder of Fairfax County, along with all of Prince William, Loudoun, Manassas, and Manassas Park, and then also needed to go into Fauquier. The Census version not only doesn’t go into Fauquier, it takes in only about half of Loudoun (geographically.)

I also thought it was interesting that of the three NoVa districts, it was actually the exurban Prince William-Loudoun hybrid that was closest to being majority-minority.

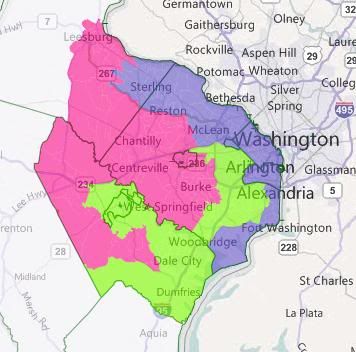
Here’s a map of a true majority-minority district in NoVa — which doesn’t go into either Arlington or Alexandria(!):

The lime green district has a VRA breakdown of

41 white/18 black/25 hispanic/12 asian/0 native/4 other

The other two districts are 60% white. Obama won all three districts, even with the Loudoun County bug.

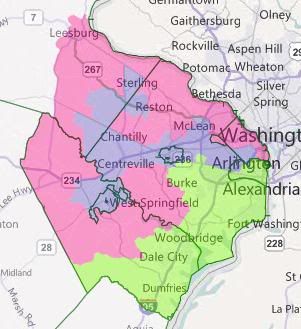
Here’s a map with two majority-minority districts:

VA-08 (blue) is 46/10/21/18/0/3. VA-11 (green) is 48/18/19/11/0/4. Pink is 69% white, with Asians as the next largest group at 12%. Obama won all three of these districts as well — interestingly, this is actual a better configuration for him. He won the pink district by about three points more in the 2 majority-minority configuration than in the single. This is primarily because much of Arlington ended up in the pink district.

Other configurations are certainly possible. I suspect, although I haven’t been able to construct it yet, that a majority-minority district where Asians are the second largest group after whites is possible. So far, the best I’ve done puts Hispanics five points ahead of Asians.

Coloring Inside the Lines: A Florida Fair Districts Map

This diary presents a 27-seat map for Florida using the new ACS data and the guidelines of the newly passed Fair Districts amendment. It goes very heavy on respecting local boundaries, sometimes to the detriment of minority districts; a couple of alternate area maps are presented at the end to rectify that. My hope is that this map represents the most extreme fidelity to local boundaries that’s possible, in order to serve as a baseline for other proposed maps. Please let me know if you think there’s someplace that fidelity can be enhanced.

Florida’s gaining two seats. It’s pretty easy to say that one is FL-19, based in Indian River, St. Lucie, and Martin Counties on the south central Atlantic coast. The second one is harder to discern; I think it’s best to say that the old FL-03 is gone and has been replaced by the new districts in Orlando and Jacksonville.

As drawn, the map renumbers all of the districts from northwest to southeast. Here’s an overview map.
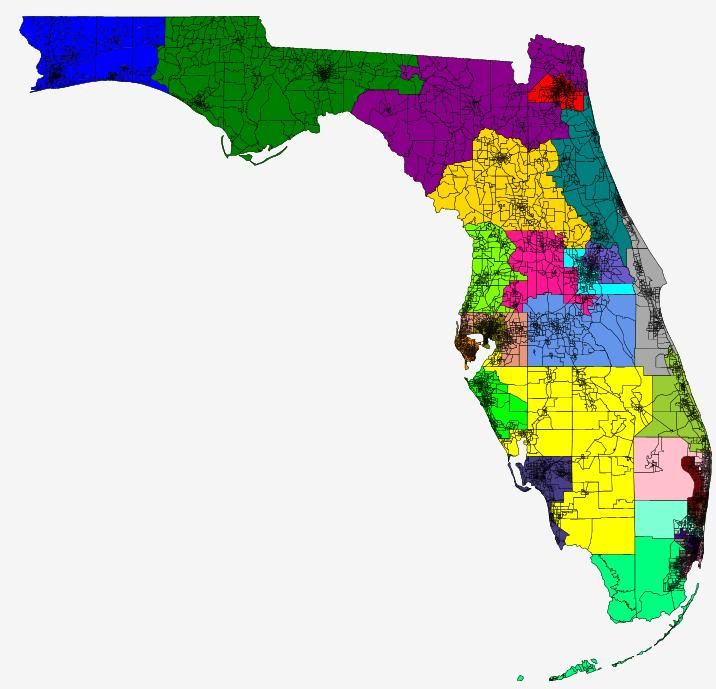
Fair Districts

For reference, here’s the ballot summary of the Fair Districts law:

Congressional districts or districting plans may not be drawn to favor or disfavor an incumbent or political party. Districts shall not be drawn to deny racial or language minorities the equal opportunity to participate in the political process and elect representatives of their choice. Districts must be contiguous. Unless otherwise required, districts must be compact, as equal in population as feasible, and where feasible must make use of existing city, county and geographical boundaries.

Not taking political ramifications into account was actually easy. Florida’s a pretty difficult state to get elections information for. So much so that even after drawing the map, I’m having a hard time assessing it. My comments are based on existing PVIs as listed on Wikipedia and the map from Inoljit’s recent diary on the 2010 governor’s race. Feedback from those with knowledge about Florida’s politics is greatly appreciated.

Following existing local boundaries has a pretty dramatic impact on the overall map. Currently, the 10th district in Pinellas County is the only district entirely within one county. Under this new map, there are nine districts that are wholly within a single county: two each in Miami-Dade and Broward and one each in Palm Beach, Pinellas, Hillsborough, Orange, and Duval. Overall, I’m happy with my map’s compactness and respectfulness of local lines, although I’d be happy to see other attempts. Note that the only boundaries I had references for are the county lines and the incorporated cities lines available in the old version of the App. I don’t even know if Florida has something equivalent to midwestern townships, so if it does, I wasn’t able to take them into account.

Protecting the opportunities of racial and language minorities was a more difficult aspect of this map. My lay understanding of the current state of VRA law runs something like this: minorities that can be given compact districts where they’re 50% or more of the population must be given them, but it’s unconstitutional to “gerrymander” together unwieldy districts for them — although considering that NC-01 apparently passes muster, I’m not quite sure how to tell what’s too unwieldy. There’s also, I suppose, the question of to what extent the Fair Districts language goes beyond what the VRA requires.

For my main map, I decided that both Brown’s and Hasting’s districts were too unwieldy to be maintained. Dismantling Hasting’s district is probably the worse call. While ugly, it could be drawn at more than 50% African American while staying entirely within two counties; anything similar to Brown’s current district wouldn’t pass the 50% mark and would require a whole lot of county-splitting. At the same time, however, breaking up Hasting’s district allows for four of the six districts wholly or partially in Broward and Palm Beach to be majority-minority (although three of those are white-plurality.) Constructing something similar to Hasting’s current district causes four of those six districts to become white majority.

The Decision Points

Putting that another way, I really consider myself to have made only three significant decisions on this map – everything else seemed more or less dictated by the geography and demographics. Now, that might not be an accurate self-perception, but that’s how I feel about it.

Two I’ve already covered:

1) Will the plurality African American district in north Florida be maintained?

2) Will the majority African American district in Palm Beach and Broward Counties be maintained?

And then there’s the previously unforeshadowed:

3) Polk and Osceola Counties together are 150k too many people for a district. Which 150k people are they and to which district are they being attached?

For my main map, the answers are “no”, “no”, and “Kissimmee and environs are going north to the western Orlando suburan/exurban district”. I’ll talk more about this third choice in the district-by-district descriptions.

At the end of the diary, I’ve included alternate versions that look at the other answers to those questions. The map that switches the first answer to a yes is based on powera’s diary from a few weeks ago, with a Jacksonville-Tallahassee majority-minority district. The map that switched the second answer to a yes is based on the existing FL-23, altered to better suit the Fair Districts requirements. And then the final map changes the answer to the third question to “Lakeland and environs are going north and west connecting to a district in Pasco County”.

District-by-district description is after the jump.

Monroe & Miami-Dade
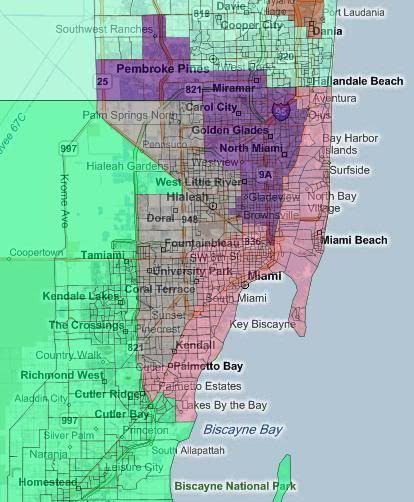
FL-24 – Indigo – North Miami/Miramar (VRA: B 54%, H 30%, W 13%)

FL-25 – PaleVioletRed – Miami/Miami Beach (VRA: H 61%, W 31%)

FL-26 – Gray – Hialeah (VRA: H 83%, W 12%)

FL-27 – SpringGreen – Monroe/Outer Miami-Dade (VRA: H 62%, W 24%, B 11%)

FL-27 takes in all of Monroe County and then enough of Miami-Dade to make up the balance. This roughly corresponds to the area west of the Turnpike and south of SW 216th St. The African-American blocks in northern Miami-Dade form the core of FL-24, spilling over into southern Broward. FL-25 takes in the rest of Miami proper that’s not in FL-24, and then snakes up and down the coast to hit population equality. FL-26 takes up the balance of the county.

Broadly speaking, New-27 is Old-25, New-26 is Old 21, New-25 is Old-18 and New-24 is Old-17.

To the best of my scanty ability to tell, I haven’t significantly changed the partisan of any district. MassGOP had a recent comment about how the area south of Miami is Demoractic-heavy and split up perfectly amongst the existing districts. This map (quite inadvertently) sustains that. I suppose that Ros-Lehtinen might face some trouble, since she’s picking up territory north of Miami Beach that I would assume is in Wasserman Schultz’s district for a reason. Diaz-Balart and Rivera won’t live in their districts, but they don’t now anyway. Wilson has a potential problem in that she would now have Hastings as a constituent (and therefore possible primary rival).

Broward and Palm Beach
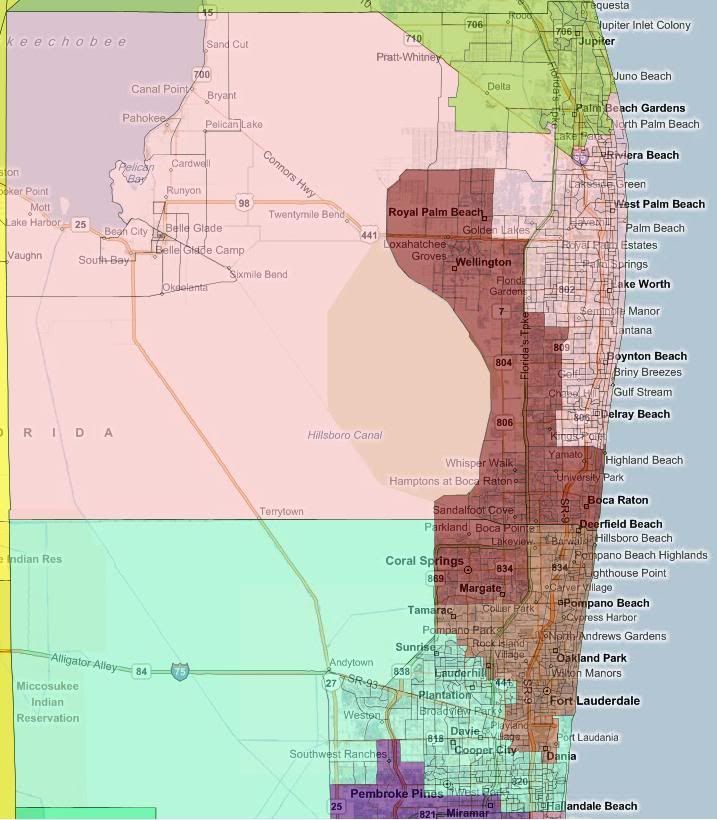
FL-20 – Pink – Delray Beach/Boynton Beach/West Palm Beach/Pahokee (VRA: w 49%, B 25%, H 23%)

FL-21 – Maroon – Coral Springs/Boca Raton/Wellington (VRA: W 73%, H 14%)

FL-22 – Sienna – Ft Lauderdale/Pompano Beach/Deerfield Beach (VRA: W 48%, B 33%, H 16%)

FL-23 – Aquamarine – Plantation/Davie/Hollywood (VRA: W 49%, H 28%, B 17%)

Starting at the extreme south, there’s the rest of FL-24, taking in Miramar and parts of Pembroke Pines. It took experimentation to figure out how to arrange the boundaries of the rest of the incorporated localties to best fit the congressional district size while keeping all three districts minority-majority. Eventually, I hit upon this arrangement of FL-23, which to the extent that the census blocks match municipal boundaries, doesn’t involve any boundary breaking. I couldn’t find a similar arrangement for FL-22, so it ended up picking up a few arbitrary blocks of Margate from FL-21. The arrangement between between FL-20 and FL-21 is to maximize the minority population of FL-20 while respecting local lines. After the creation of these four districts, there’s about 160k leftover population in Palm Beach Gardens/Jupiter that gets sent up to FL-19.

The districts in this area were previously so intertwined that I’d have a hard time mapping them onto the new ones, but if forced, I would say that New-23 is Old-20, New-22 is Old-23, New-21 is Old-19 and New-20 is Old-22.

I believe that all four of these districts would have PVIs of at least D+8, which is sad for West. Hastings has been drawn into FL-24 with Wilson. West has been drawn into FL-23 with Wasserman Schultz. I’m guessing that Hastings would seek to represent FL-22 if he tried to stay in office, but that’s just a guess – I suppose he could take on Wilson. About West, I have no clue. Deutch lives in FL-21. FL-20 is open.

Southwest Florida
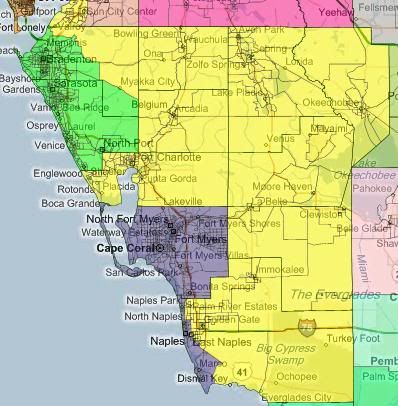
FL-16 – Lime – Manatee County/Sarasota County (VRA: W 81%, H 10%)

FL-17 – DarkSlateBlue – Lee County/Naples (VRA: W 74%, H 16%)

FL-18 – Yellow – the rest of southwest Florida (VRA: 69%, H 22%)

The ten counties that I’m calling Southwest Florida (Charlotte, Collier, DeSoto, Glades, Hardee, Highland, Lee, Manatee, Okeechobee, and Sarasota) have about 50k too few people for three districts. Hillsborough and Pinellas Counties together came up about 55k too many for three districts, so that’s where the disparity gets made up. Sarasota County and Manatee County together are about 4k over a district, so that’s where FL-16 comes from. Lee County, on the hand, is about 100k short of being a district. I couldn’t find a 100k subdivision of Charlotte County that didn’t break municipal lines, so Lee’s FL-17 ran down the coast of Collier County through Naples to Marco Island. FL-18 takes up the rest of Southwest Florida, plus about 50k in and around Sun City Center in Hillsborough County.

Roughly speaking, New-18 is Old-16, New-17 is Old-14, and New-16 is Old-13.

All three of these districts should continue to have Republican PVIs. FL-16 should be somewhat less Republican than it was previously, since it’s losing rural territory and gaining the minority-heavy parts of Brandenton. I’d expect FL-17 to be about the same, which FL-18 is probably more Republican than previously, since it’s no longer involved with St. Lucie County. Buchanan and Mack continue to live in their districts. Rooney lives in what’s essentially a new district in FL-19, so FL-16 is open.

Hillsborough Pinellas
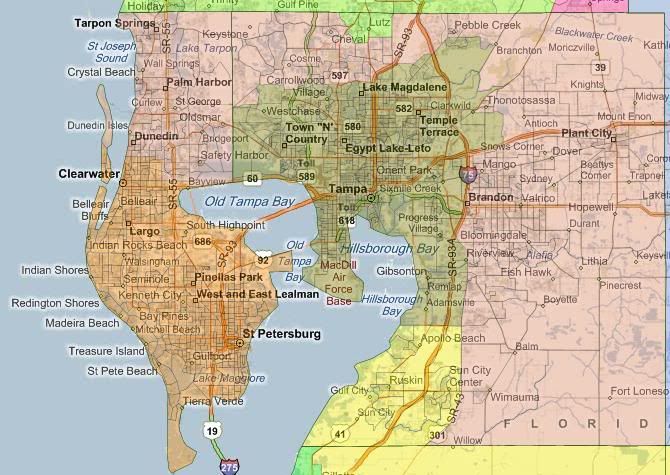
FL-13 – DarkSalmon – Outer Hillsborough/Pinellas (VRA: W 74%, H 14%)

FL-14 – Olive – Tampa/inner suburbs (VRA: W 49%, H 25%, B 21%)

FL-15 – DarkOrange –  St. Petersburg/Clearwater (VRA: 76%, B 12%)

FL-13 and FL-14 pretty much drew themselves. FL-13 starts at the southern tip of Pinellas County and works north, taking in most but not all of Clearwater, due to population equality concerns. FL-14 took in all but the very north reaches of Tampa (since those were needed to maintain contiguity for FL-15), and then focused on taking in as many minorities as possible to make FL-14 (just barely) minority-majority. Even after donating 50k people south to FL-18, the combined three districts are about 5k over populated. Those are donated northwards to FL-11. The exact blocks chosen for donation are entirely arbitrary – any group along the border between FL-11 and FL-13 that maintains population equality could be used.

Roughly speaking New-15 is Old-10, New-14 is Old-11, and New-13 is Old-9.

Bilirakis, Young, and Castor are all fine from a residency standpoint. I imagine, although I’m not sure, that all three Representatives have been hurt from PVI standpoint. Castor has lost the minority parts of Brandenton and St. Petersburg; Young has taken on all of St. Petersburg; and Bilirakis has lost all of his territory in Republican Pasco County. Castor and Bilirakis have some room to maneuver; but Young was already in an R+1 district. Another few points to the Democrats could flip the seat, especially if Young retires.

Central Florida

FL-08 – SlateBlue – Seminole County/Northeast Orlando suburbs (VRA: W 64%, H 20%, B 10%)

FL-09 – Cyan – Orlando (VRA W 44%, H 25%, B 25%)

FL-10 – DeepPink – Kissimmee/West Orlando suburbs/Lake County/Sumter County/western Pasco County (VRA: W 67%, H 20%)

FL-11 – Chartreuse – Citrus County/Hernando County/eastern Pasco County (VRA: W 85%)

FL-12 – CornflowerBlue – Polk County/Osceola County minus Kissimmee (VRA: W 66%, H 18%, B 13%)

Starting at the southern part of this region, Polk and Osceola together were almost 150k over populated for a single district. I briefly looked at separating them, but that resulted in far more ugliness than keeping them together entails. This resulted in the choice I referred to in my intro. There are two ways that I found to take 150k people out of the district in a way that respects local lines: attach Kissimmee and Celebration to an Orlando-based district or attach Lakeland to a Pasco-based district. I tried both and ultimately choose the first option because it better fit my subjective impression of “compactness”. The number of county splits ended up being the same either way, if I counted correctly. It was just a matter of where the county splits are. The main detriment (if it is one) is that the Disney Empire doesn’t end up in the same district as Orlando-proper.

After that, the rest of Central Florida fell into place. Coastal FL-12 takes up Citrus and Hernando Counties along with western Pasco County (roughly speaking, the area west of I-75). On the opposite side of the region, FL-09 picks up Orlando proper, along with minority-heavy areas to the east, west, and northwest – all within Orange County. Meanwhile FL-08 combines Seminole County with enough of the whiter suburbs to the east of Orlando in Orange County to make a district. It took some playing around to figure out how best to draw those while respecting local lines. In the end, the only infidelity that I know of is a couple of blocks that straddle Ocoee and Apopka. Finally, FL-10 picks up the leftover areas of the region: Kissimmee, Winter Garden-Ocoee, Sumter County, eastern Pasco County, and most of Lake County. (All of Lake County would have been 50k too many. I moved the northeast corner of the county up to FL-05.)

Roughly speaking, New-12 is Old-12, New-11 is Old-05, New-10 is Old-08, New-09 is one of the new districts, and New-08 is Old-24.

Politically, I suspect that all of these districts, except for the new majority-minority FL-09, are likely Republican. Ross and Nugent are okay from a residency standpoint. Mica now lives in the new FL-08. Webster and Adams are both listed as Orlando, so they’re both looking for new districts to run in – possibly the new open FL-10.

Atlantic Coast
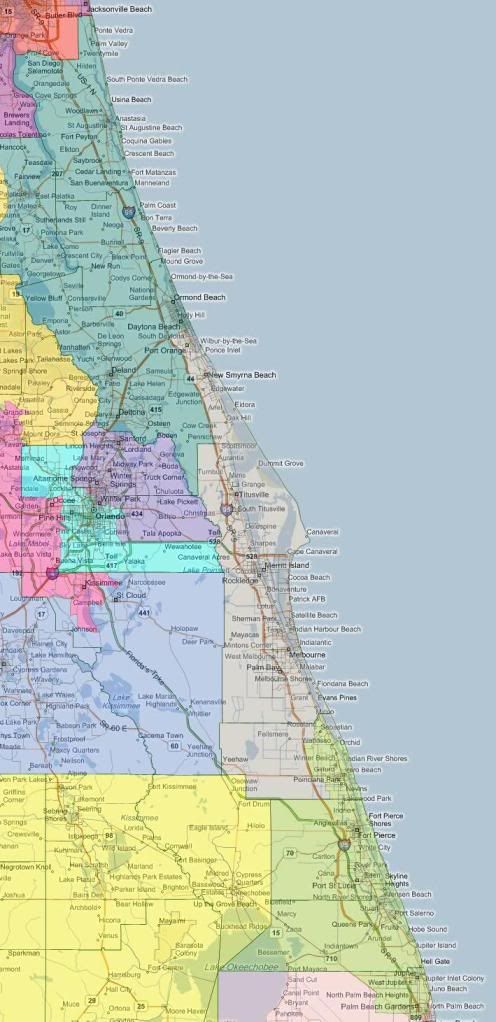
FL-06 – Teal – St. Johns County/Flagler County/eastern Putnam County/most of Volusia County (VRA: W 75%, B 13%)

FL-07 – DarkGray – Space Coast/New Smyrna Beach/Titusville/Melbourne (VRA: W 81%)

FL-19 – YellowGreen – Indian River County/St. Lucie County/Martin County (VRA: W 76%, H 11%, B 10%)

Three districts hug the Atlantic Coast. Starting with the new district on the south central coast: FL-19 takes in the rest of Palm Beach County, along with St. Lucie, Martin, and all but 9k people in Indian River (which are donated north to FL-07.) FL-07 takes in those 9k in Indian River, all of Brevard, and the strip of Volusia east of I-95 and south of Daytona Beach. FL-06 then takes in in the rest of Volusia, along with Flagler and St. Johns. At that point, it’s about 50k short, so it moves inland to take about the eastern half (by area, more like two-thirds by population) of Putnam County,

Roughly speaking, New-19 is a new district, New-07 is Old-15, and New-06 is Old-07.

Politically, I’m pretty sure that these are all safely Republican; I’m least certain of that with regards to FL-19. Rooney (in the new FL-19) and Posey (in the new FL-07) have districts to themselves. The new FL-06 is open.

North Florida
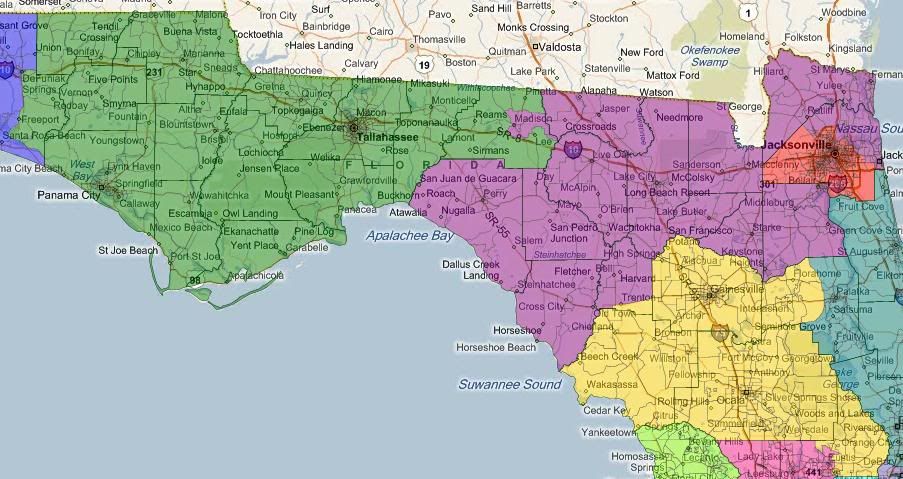
FL-01 – Blue – Western Panhandle/Pensacola (VRA: W 76%, B 14%)

FL-02 – Green – Eastern Pandhandle/Tallahasee/Panama City (VRA: W 68%, B 24%)

FL-03 – DarkMargenta – Suwanee River/Jacksonville suburbs (VRA: W 78%, B 13%)

FL-04 – Red – Jacksonville (VRA: W 55%, B 33%)

FL-05 – Gold -North central Florida/Ocala/Gainsville (VRA: W 75%, B 13%)

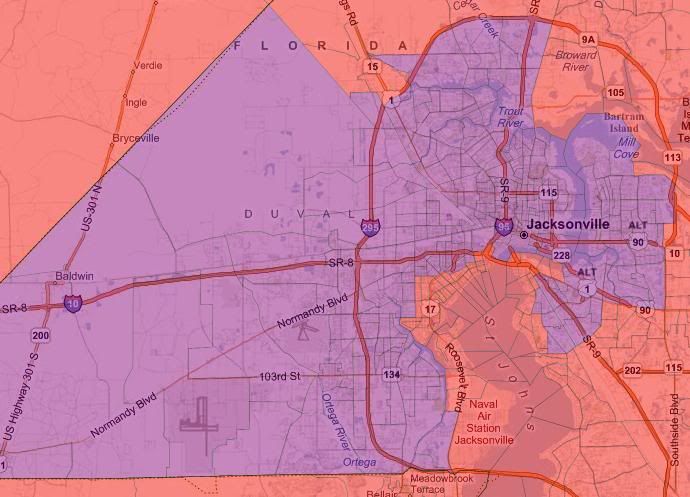
This time starting in the west. The Pensacola-based FL-01 shrinks by three counties, taking in only the westernmost three counties and about 42k of Walton’s 50k. FL-02 therefore also shifts west, losing all but 10k of its population east of Jefferson County. Skipping down to the southern part of the region, FL-05 takes in all of Levy, Marion, and Alachua Counties, plus the northeastern portion of Lake County. That leaves it about 3k short – I decided the southern block of Gilchrist makes the “compact” addition. FL-04 stays wholly within Duval County. This is probably the closest thing to a successor to the old FL-03, so in deference to that, I drew it as minority-heavy as possible. It’s still 55% white. The new FL-03 takes up the rest.

These are a bit more straightforward to map back onto the old districts: New-01 is Old-01, New-02 is Old-02, New-03 is Old-04, if New-04 is anything it’s Old-03, and Old-05 is New-06. All incumbents are fine from a residency standpoint. I’m much less sure about electorally. I would suspect that FL-02 has gotten more Democratic, since Leon County is a bigger proportion of its population. FL-03 is, of course, substantially more white that Brown’s current district. Duval as a whole is a Republican-leaning jurisdiction, so far as I can tell, but I’m not sure what it is once you’ve removed its whitest 170k worth of Census blocks.

Alternate Maps

Here are the three alternate scenarios I mentioned in the introduction: a majority-minority north Florida district, detaching Lakeland instead of Kissimmee from FL-12, and a majority-African-American Palm Beach-Broward district.

Minority-Majority North Florida
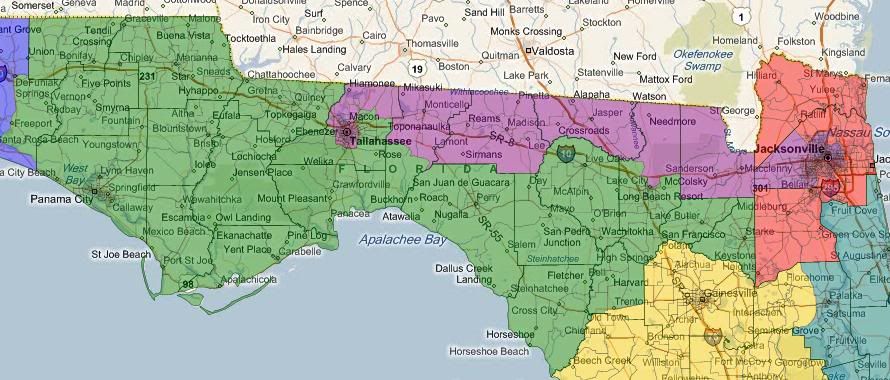
This involves shifting around the main map’s FL-02, FL-03, and FL-04 – everything else is unchanged.

ALT-02 – Green – Eastern Panhandle (VRA: W 74%, B 18%)

ALT-03 – DarkMagenta – Tallahassee to Jacksonville (VRA: W 49%, B 41%)

ALT-04 – Red – Jacksonville suburbs (VRA: W 77%, B 11%)

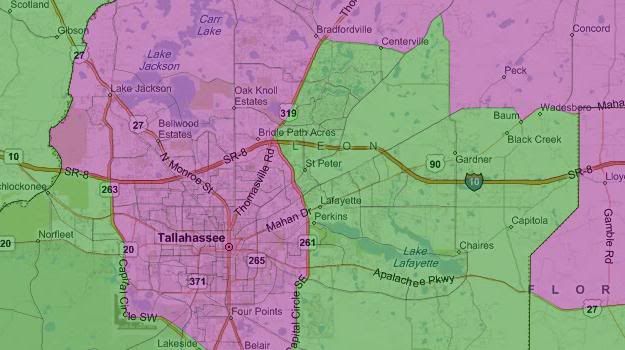
This is a bare-bones version of a north Florida majority-minority district, covering Tallahassee inside the Capital Circle highway, northern Leon County to connect eastward, all but the southernmost block of Jefferson County, all of Madison and Hamilton Counties, only the northernmost block of Columbia County to connect eastward, all of Baker County, and then much of interior Duval County, where I tried to strike a balance between compactness and minority-heaviness. ALT-02 takes in the area from Bradford County west. ALT-04 takes in the remainder.

ALT-03 could be made more minority; I just decided that the price wasn’t worth it. For example, Gadsden County, to the west of Tallahassee, is a 54% African American jurisdiction with a population of about 45k, but adding it would require sacrificing either the relatively clean lines in Leon County or the very clean line between Bradford and Clay Counties.

Here are closeups of Leon and Duval Counties.


Detaching Lakeland Instead of Kissimmee

It’s possible to detach Lakeland from Polk instead of Kissimmee from Osceola to make FL-12 work. This results to two subscenarios. Either way, the new ALT-12 has VRA stats of W 59%, H 25%, B 11%.

The simpler scenario is to just swap Lakeland and Kissimmee between FL-10 and FL-12.
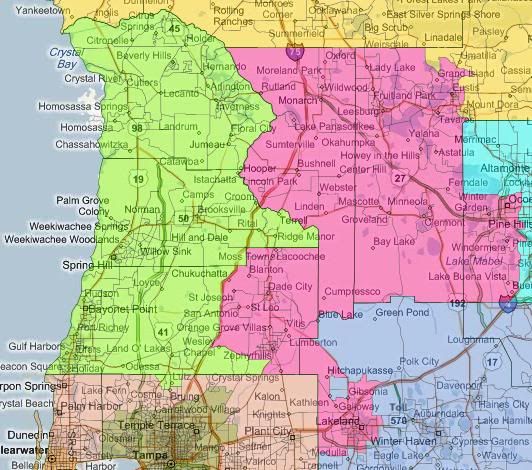
This results in an ALT-08A with VRA stats of W 73%, H 12%, B 11%.

Alternatively, from that point, you could choose other county splits between FL-10 and FL-11. For example, you could consolidate Pasco into one district, picking up Lakeland and that little bit of leftover Hillsborough, leaving you about 65k short of a district. Splitting Hernando now instead of Pasco to get that 65k results in this.
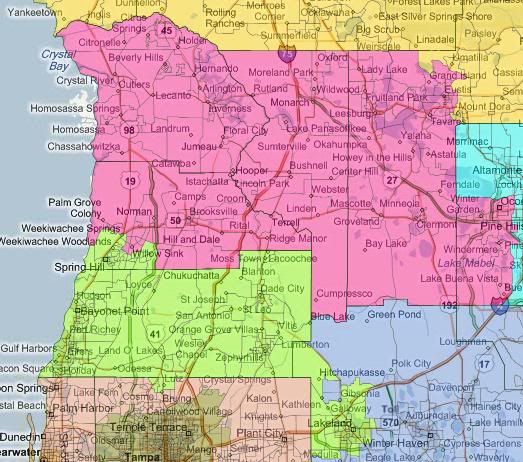
ALT-10B has VRA stats of  W 79%, H 10%. ALT-11B has VRA stats of W 80%, H 10%.

Choosing between any of these three scenarios (the main and the two sub scenarios) is essentially arbitrary from a demographic standpoint. Without partisan motivation, explicitly disallowed by the Fair Districts standpoint, I’m not sure why you’d choose one over the others. I also have no idea which one of the three scenarios would be most favorable to Democrats.

Majority African American Palm Beach-Broward

It looks like this:
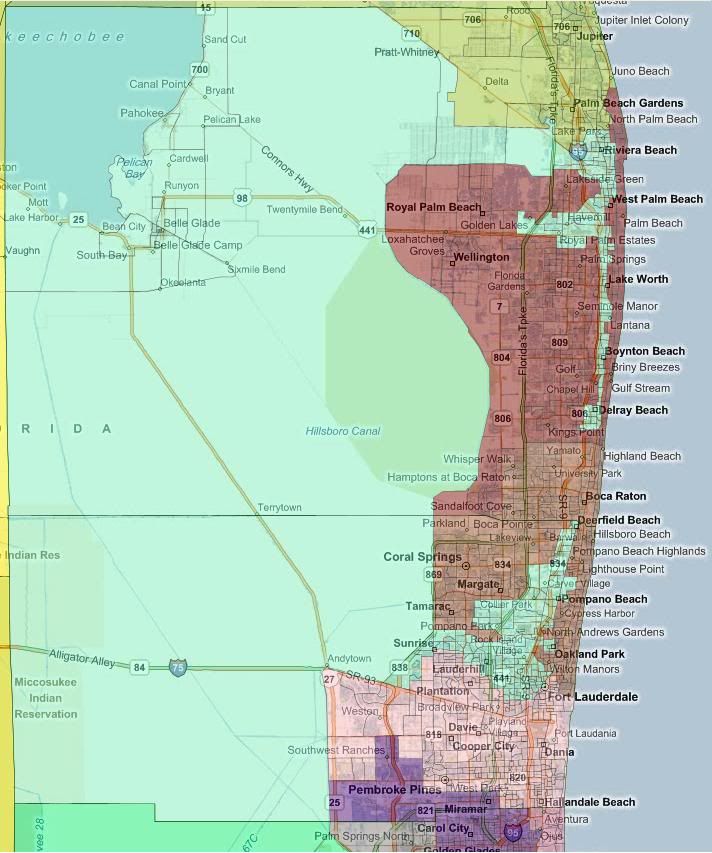
I swapped colors around for working purposes and forgot to put them back for display purposes, so for this map only ALT-20 is the light blue one and ALT-23 is the pink one. ALT-21 is the redder of the two browns; ALT-22 is the other district.

ALT-20 – VRA: B 51%, W 27%, H 19%

ALT-21 – VRA: W 67%, H 18%, B 11%

ALT-22 – VRA: W 72%, H 16%

ALT-23 – VRA: W 53%, H 28%, B 13%

Politically, I don’t think it matters. It mostly whether this district is legally required.

Summary

Since my grasp of Florida politics is not a firm as I’d like, this is pretty tentative. But the rough upshot is that I think that Fair Districts is worth about three districts to the Democrats: West’s, Young’s, and the new Orlando seat. Which I think is a pretty common view anyway.

The goal of this wasn’t to figure out the politics anyway. It was to try to figure out how few boundaries can be broken. Please let me know if you see anyway to improve the map on that score.
Just Whistling Dixie: Unlikely Pro-Democratic Maps for Four Southern States (AL, KY, LA, VA)

After the jump, I present a survey of maps that are demographically possible if political improbable. They are presented mostly for holiday slow-time discussion fodder. The states covered are Alabama, Kentucky, Louisiana, and Virginia. Republicans will control the process in Alabama; the Democrats control a single house of the legislature in the other three states. So the Democrats are unlikely to get maps as good as these. My redistricting instincts tend towards “good government” aesthetics, so these maps are about what’s possible with relatively compact districts.

Alabama

Top-line results: 5 R – 2 D. (Neutral year, open seat, quality candidates, my impression)

This map creates two majority-black districts in Alabama, while pushing the Huntsville-based 5th in slightly more Democratic direction.

The estimates in Dave’s App put Alabama at 4.66M people. The actual Census figure is 4.78M.

The 1st and 2nd engage in extensive territory swapping with the 2nd. The 1st gains gains the southeastern corner of the state; the 2nd gains much of Mobile proper. This roughly doubles the black percentage of the 2nd, taking it to 53% black, 43% white. Martha Roby should be in trouble. The 7th is very slightly diluted, dropping from 61% to 59% black. Making the 2nd majority black also let me shore up Mike Roger’s 3rd, which lost about 8 points off its black percentage.

In the north, the 5th needed to shrink. Glancing over the last decades worth of county-level results, the eastern side of the district seemed slightly more Democratic than the western side, so I lopped off Jackson County. Mo Brooks would probably still be fine here, but I’d rate this as the district most likely to flip to the Democrats outside of the majority-black ones.

I’m not entirely sure what the Republican will do with their control. The current 4th and 6th are R+26 and R+29 respectively, so a well-executed unpacking of those districts should end shoring up the other four GOP-held districts.

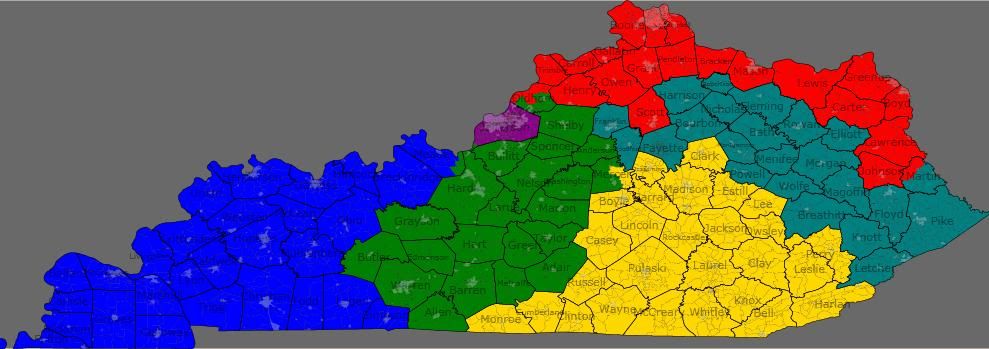
Kentucky

Top-line results: 3 R – 2 D – 1 S (Neutral year, open seat, quality candidates, my impression)

This map shores up Ben Chandler’s 6th district, while pushing the Paducah-based 1st into a potentially swingy seat. (I might be over-estimating Democratic chances there.)

The estimates in Dave’s App put Kentucky at 4.04M people. The actual Census figure is 4.34M.

Looking at recent governor and US senator races, I noticed that the geographically largest areas of Democratic support in Kentucky is in the central portion of western eastern half of the state. That support is currently cracked into parts of three districts. I consolidated that support into Chandler’s 6th (teal), which should go from swingy to solidly Democratic.

In doing so, I forced the 5th (yellow) to the west, eating up areas that are contributing to Republican margins in the 1st (blue). (The new 5th is very Republican — it’s the only district without a single county that went Democratic in either of the last two US Senate races.) This new 1st should be winnable for a Democrat under the right circumstances — for example, by eyeballing it, I estimate that Mongiardo probably won in the 2004 Senate race.

I actually think that my 6th might have a decent shot of being created if the state House Democrats can force incumbent-protection. It’s just that the first will need to be solidified for the Republicans by some territory swaps with the 2nd and 5th.

Louisiana

Top-line results: 3 R – 2 D – 1 S. (Neutral year, open seat, quality candidates, my impression)

This map creates two majority-black districts in Louisiana, while trying to make the Shreveport-based 4th as Democratic as possible.

The estimates in Dave’s App put Louisiana at 4.41M people. The actual Census figure is 4.53M.

The 2nd (green) and 6th (teal) are the intended majority black districts. The actual figures are more like 49.6% in each. The 4th (red) is 54% white, 41% black. I hope that’s enough to make the 4th competitive for the Democrats.

Most speculation I’ve seen indicated the Republicans will be trying to make a single Baton Rouge-to-New Orleans majority-black district. Given the recent rate of party switching in the Louisiana state legislature, I imagine they’ll probably succeed.

Virginia

Top-line results: 5 D – 4 R – 2 S (Neutral year, open seat, quality candidates, my impression)

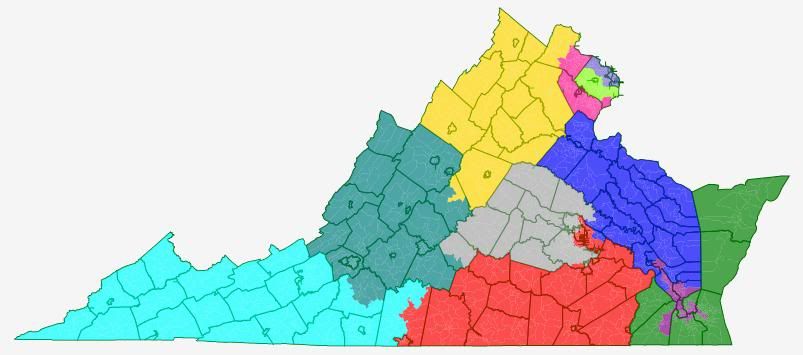
I originally presented this map in a comment in diary by drobertson. It fits the theme though, so I’m reposting it for consideration. This map is probably the most “good government” of these maps – each district basically corresponds to an existing political/cultural region of Virginia.

Its most notable feature is that presents two plurality black districts in the southeastern part of the state.

The estimates in Dave’s App put Virginia at 7.77M people. The actual Census figure is 8.00M.

1st (blue) – Peninsulas – Obama 46, McCain 54

2nd (green) – Suburban Hampton Roads – Obama 49, McCain 51

3rd (purple) – Urban Hampton Roads – Obama 69, McCain 31 — VRA: 49% black, 42% white

4th (red) – Richmond, Petersburg, and South Virginia – Obama 61, McCain 39 — VRA: 50% black, 44% white

5th (yellow) – Piedmont – Obama 47, McCain 53

6th (teal) – Shenandoah – Obama 43, McCain 57

7th (grey) – Richmond suburbs – Obama 42, McCain 58

8th (slate blue) – Arlington, Alexandria, north Fairfax- safe D

9th (cyan) – southwest Virginia – Obama 40, McCain 60

10th (magenta) – Prince William and Loudoun – Obama 56, McCain 44

11th (lime) — south Fairfax and Manassas – ???

The presidential percentages are back-of-the-envelope style. I used the 2008 figures to the nearest hundred and counted split cities/counties as if they were wholly within the district they were most in. I didn’t feel like delving into Fairfax precincts for the 8th/11th. The 8th should be just as safe as it is now, and I think, though I’m not 100% certain, that this version of the 11th is more Democratic than the current one. (Drobertson questioned this assertion at the time I made it, but agreed that this new district ought to be better for Gerry Connolly if not Generic D.)

The 2nd is more Republican than listed, but I don’t know how much more. I counted Isle of Wight and Suffolk as if they are wholly in it, but they are both donating their most heavily black precincts to the neighboring 4th and 3rd, respectively.
There’s a similar dynamic for the 4th and 7th, which are probably even more firmly in their respective parties’ control than it appears. I counted all of Richmond and Henrico in the 4th, but the majority white parts of each are actually in the 7th.

Notes on incumbents: Wittman, Scott, Cantor, Goodlatte, Moran, and Connolley are all fine. Rigell and Forbes would share the 2nd. Hurt lives in the new 4th. Griffith lives in the new 6th. Wolf lives in the new 8th. I assume all three of them would continue to run in the same districts anyway — all of them are in counties adjacent to their districts.

In the real world, the Virginia state senate Democrats should be able to force incumbent-protection, but seperating Richmond from Hampton Roads for two black opportunity districts won’t be happening.

Disincumbenting Illinois: A Democratic Redistricting Plan

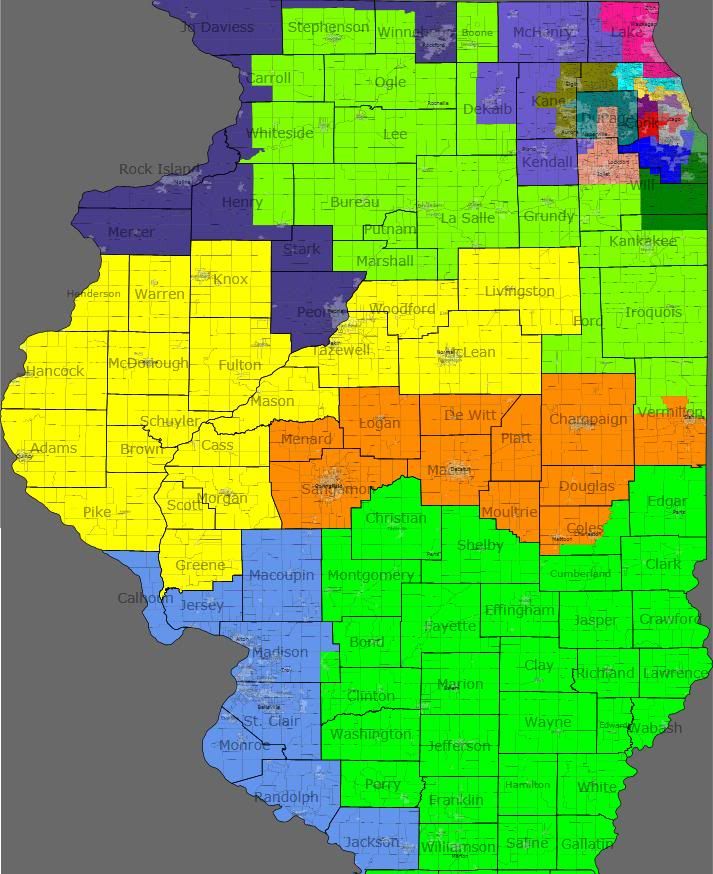
This diary presents an 18-seat map for Illinois. Illinois is a particularly difficult state for me to get my head around politically, so in this diary I am  going to highlight a particular strategic approach to redistricting. I’m calling it “disincumbenting” — I don’t think I’ve encountered an existing term of  art anywhere that covers quite the same ground.

The basic idea of disincumbenting is to make the new districts as unlike the current districts as possible. Doing so reduces the value of incumbency (hence  the name) by reducing the number of constituents who are familiar with the incumbent representative.

Illinois strikes me as a particularly fertile environment for the technique, because the party out of power on the state level has a large number of  contiguous seats. The Democrats have unified control over the line-drawing. In the most recent election, they lost four outstate districts, resulting in the Republicans controlling every non-Cook-County-based district except for Jerry Costello’s 12th district in the far southwest. (The Republicans also control  the Cook-County-based 9th.) With so much adjacent territory under the control of the opposition party, it is fairly easy to draw new lines that wreak havoc  on the political bases of each incumbent.

As I said above, I find it difficult to get my head around Illinois’ politics. This is because recent elections have been so very unrepresentative. 2010 was a Republican wave year. 2008 was a Democratic one, compounded by Obama’s favored son status. Blagojevich’s election numbers are impacted by the presence of a  significant Green candidacy. And so on. I tried to design the new districts so as to maximize the number of “Democratic opportunity” districts outside of  Cook County as best I could, but these districts aren’t as numbers-based as I would like. I welcome any feedback from those who know Illinois better.

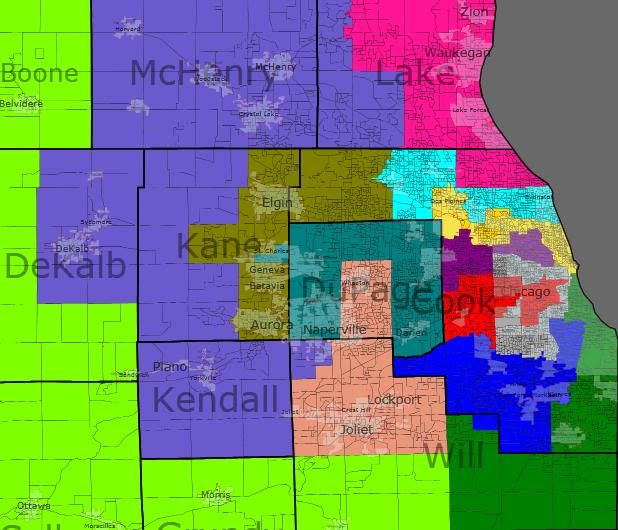
Aside from the goals of disincumbenting Republican incumbents and maximizing Democratic chances outstate, I had two other, inter-related goals: create a second Hispanic majority seat in cook County, thereby eliminating Lipinski’s district. In a previous diary, I had created a second Hispanic seat by (inadvertantly) messing with Quigley. Geoneb suggested that Lipinski should be the target instead, so here’s a plan that does that. These two goals have an unintended spillover effect of somewhat disincumbenting the Chicago Democratic representatives. If resistance from the Democratic incumbents proves too great, these two goals could be abandoned.

To demonstrate the disincumbenting strategy, in my district descriptions I’m making use of silverspring’s Territory Transfer Percentage (TTP), introduced here. TTP is the percentage of the new district’s population that was part of the old district. My impression is that Silverspring introduced it with the general intent of keeping TTPs relatively high. Because of the set of goals I applied to the creation of this map, I’m actually trying to keep TTPs low (at least in the Republican districts.)
Pictures and descriptions of the plan start after the jump.

Overview Map

Note that the 16th is (roughly speaking) the seat lost through reapportionment. I relocated it south to cover for the missing number 19.

Chicagoland Map

District-By-District

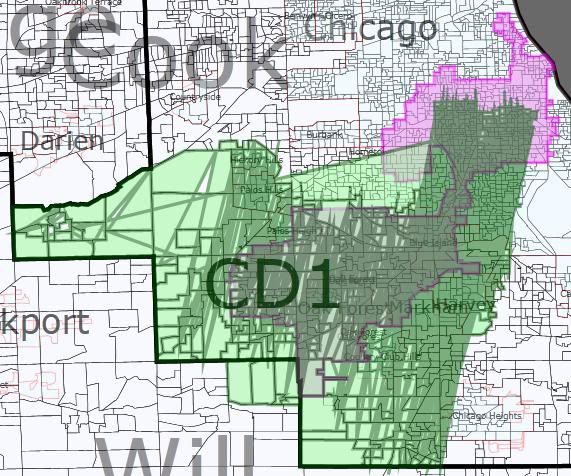
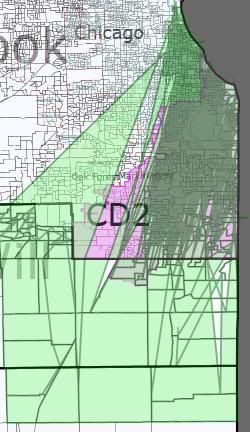
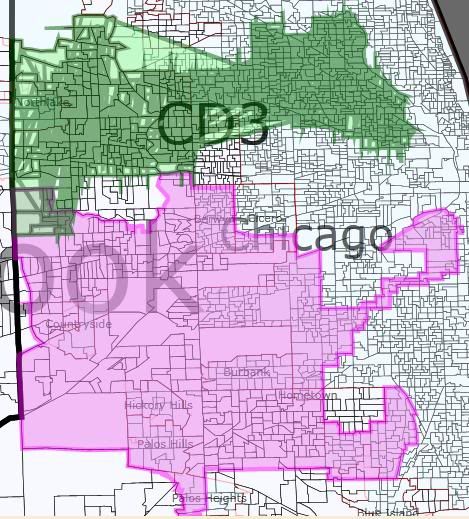
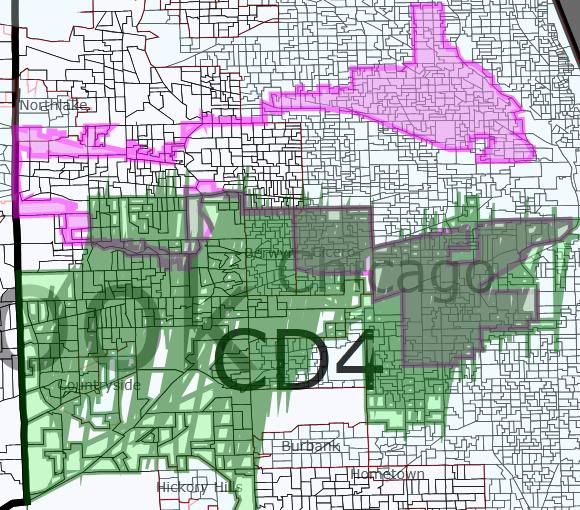
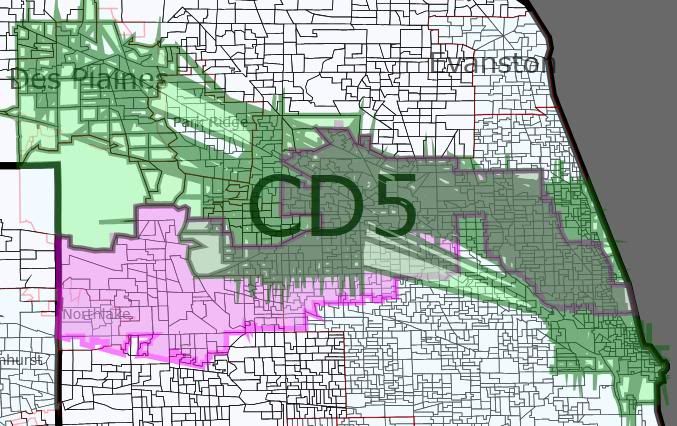
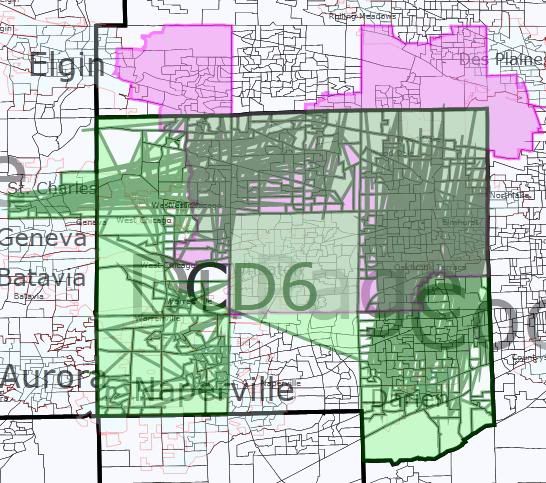
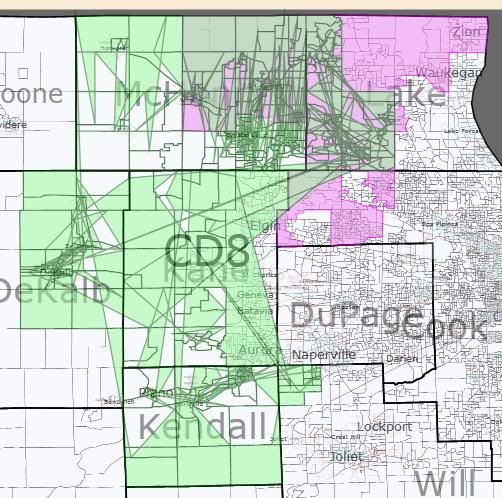
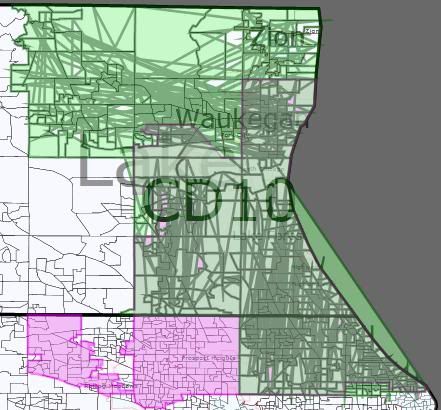
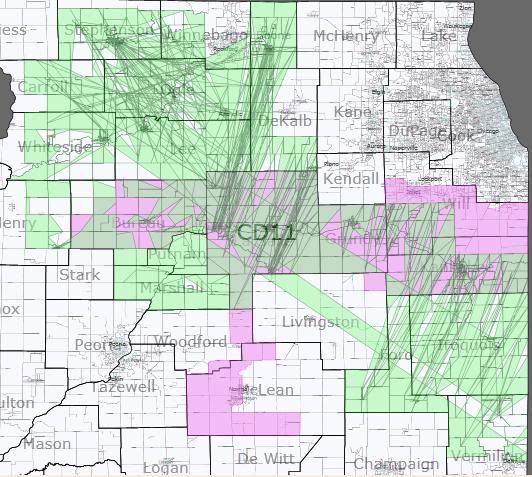
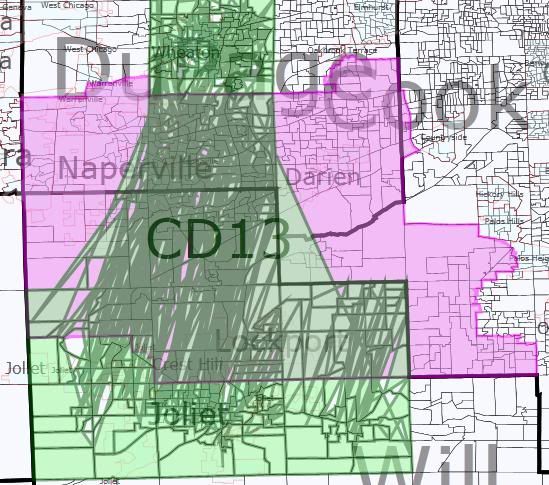
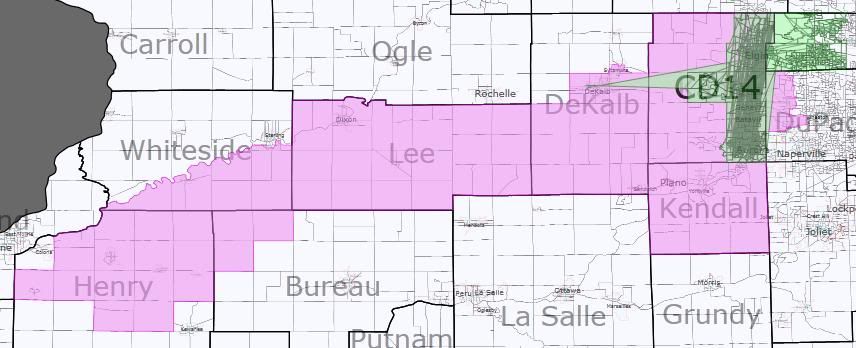
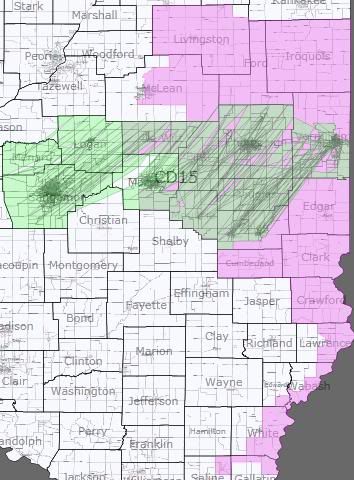
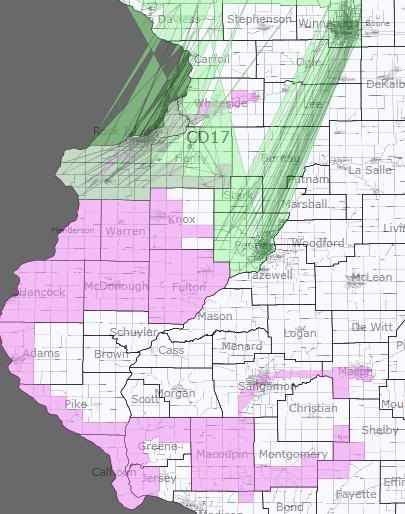
Given the strategy I’m following here, I’m presenting the old/new maps for each district. The pink outline is the old district. The green squiggles represent the new district.

Democratic Held Seats

My intention was that all of these seats would remain solidly Democratic. In the absence of sound numbers though, I’m slightly worried about the 9th. (And, I guess, the 12th — but I think I actually improved the 12th’s Democratic performance.)

District 1 — Bobby Rush (D)

VRA: B 53% W 35%

TTP: 49%

Rush’s district slides south somewhat, expanding into parts of what is currently the 2nd and 13th. I’m not sure if Rush still lives in this version of the district. Wikipedia says he used to represent the 2nd Ward. If he still lives there, it’s a relatively easy fix to swap some territory with the 2nd while keeping both majority African American.

District 2 — Jesse Jackson, Jr (D)

VRA: B 54% W 32% H 11%

TTP: 56%

Jackson’s district narrows slightly to expand significantly to the north and south. Again, I’m not sure if Jackson lives here, but his wife represents the 7th Ward, so I think he probably does.

District 3 — Open Seat (D)

VRA: H 52%, W 34%

TTP: 2%

[Update: Per sapelcovits in the comments, my description of the ethnic background for the 3rd and 4th are flipped. This is Guiterrez’s district. It’s the 4th that’s open.]

This was Lipinski’s district, now almost entirely relocated to become a second Hispanic majority district. (The old district is split roughly evenly between the new 4th and 7th, both of which are still majority-minority.) My understanding is that the Hispanic population here is largely Mexican, so voting participation rates might not be enough to elect a Hispanic representative.
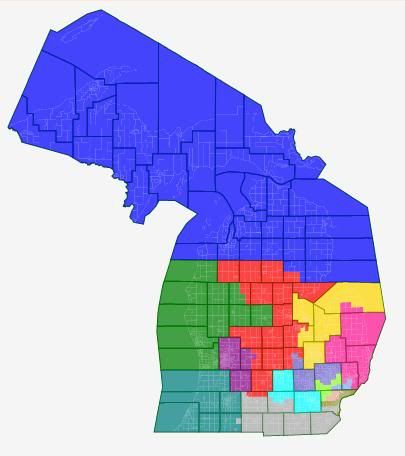
District 4 — Luis Guiterrez (D)

VRA: H 58%, W 35%

TTP: 51%

Guiterrez’s seat now takes in only the southern half of his old district (along with a good part of the old 3rd). My understanding is that the Hispanic population here is largely Puerto Rican (and therefore US citizens), so this district should pass VRA muster.
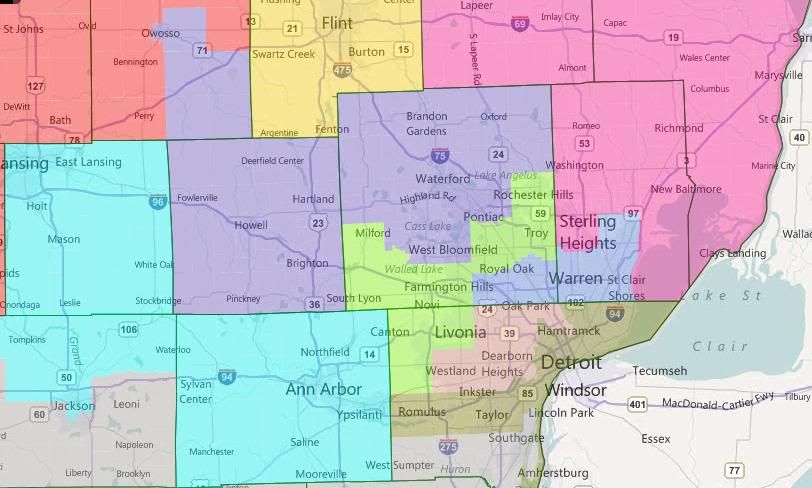
District 5 — Mike Quigley (D)

VRA: W 68%, H 15%

TTP: 53%

Quigley’s seat shifts northwest on its western end, now taking in Des Plaines instead of Northlake. I believe he should still live in the district; if not, the territory swap needed to make it happen shouldn’t be too difficult.

District 7 — Danny Davis (D)

VRA: B 50% W 34% H 11%

TTP: 50%

Sadly one of the less informative old/new maps. You might need to refer back to Chicagoland overview. Davis’s seat lurches south radically as part of the dismemberment of the old 3rd. The 29th Ward that he used to represent is still in the district, so I assume he is too. If 50% is too low an African-American percentage, some territory swaps with the 1st and/or 2nd could probably be arranged.

District 9 — Jan Schakowsky (D)

VRA: W 62% H 15% A 14%

TTP: 60%

Schakowsky’s district stretchs significantly further west now. This is the only Democratic-held district I’m concerned about whether I weakened it significantly. Perhaps she and Quigley could swap Elk Grove for Des Plaines? (Is that even an improvement for her?)

District 12 — Jerry Costello (D)

VRA: W 80%, B 15%

TTP: 71%

Costello’s district shifts north, and in doing so becomes more Democratic (I think.) One danger: I’ve technically drawn Shimkus into this district, but I’m assuming he’d run in what is now the neighboring 16th. I don’t think Shimkus is a problem (71% TTP for Costello!), but if he is, he could be drawn into the 16th properly. But I’m guessing that would require decreasing the 12th’s Democratic performance.

Republican Held Seats

Now the fun begins! Republicans, please met your new districts.

I have no firm idea what the Democrat’s chances in any of these districts are. I’m hoping that disincumbenting the Chicago suburban Republicans will make them vulnerable. Outstate from Chicagoland, I think I created two new districts that are at least competitive for the Democrats.
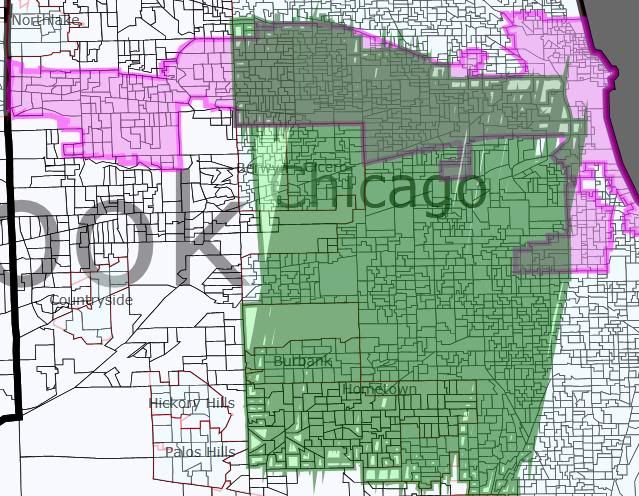
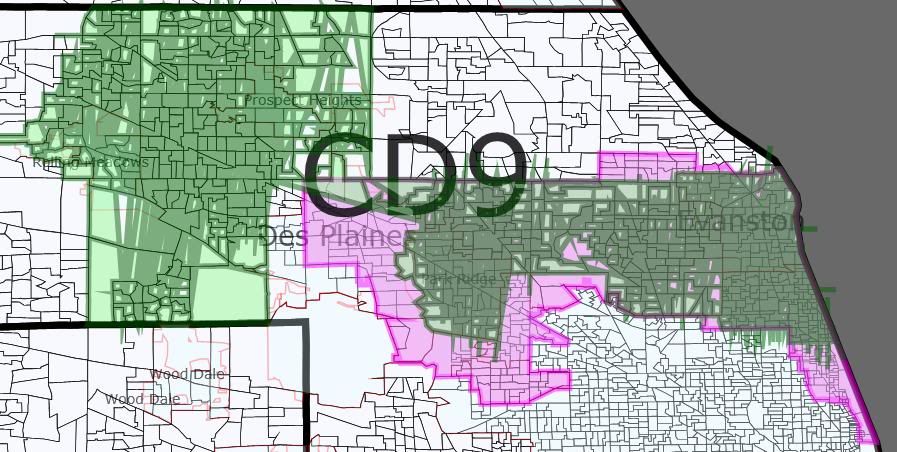
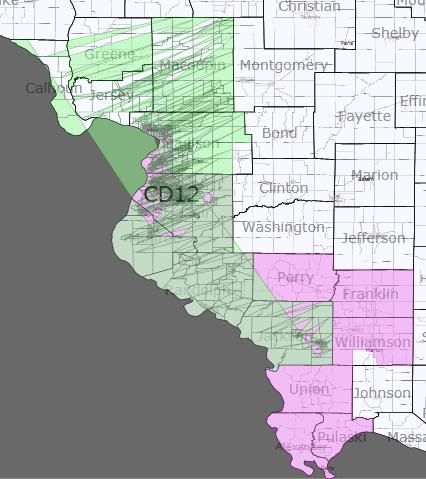
District 6 — Judy Biggert (R) vs Randy Hultgren (R)

VRA: W 71% H 14% A 10%

TTP: 55%

While remaining DuPage-based, the 6th now pairs the residences of two incumbent Republicans — neither of whom are the incumbent in the 6th! Its upside-down U-shape is to keep incumbent Peter Roskam’s hometown of Wheaton out of the district. The listed TTP is if Roskam ran here anyway. If Biggert ran here, her TTP would be 34%; for Hultgren, 11%.

District 8 — Joe Walsh (R)

VRA: W 82%, H 11%

TTP: 35%

No longer stretching to Lake Michigan, Walsh’s seat now heads south into eastern Dekalb, western Kane, and Kendall Counties. Sadly, I suspect that this territory as at least as favorable to Walsh as his current one. Walsh would have nearly the same TTP if he ran in the new 10th at 30%. Representatives Manzullo and Hultgren would be at 28% and 29%, respectively, if they ran here — despite, you know, not living here.

As a side note, I believe Bean lives in my new 14th.

District 10 — Bob Dold (R)

VRA: W 67%, H 19%

TTP: 68%

The GOP district I most failed to disrupt. Any suggestions on what I can do with this?

District 11 — Don Manzullo (R) vs Adam Kinzinger (R)

VRA: W 86%

TTP: 46%

Contains parts of no fewer than 6 current districts. The TTP listed is for Kinzinger, the incumbent by district number and by largest TTP. Manzullo’s TTP is 28%. I’m pretty sure that this is a Republican vote sink. I do feel like I’m wasting LaSalle County, though, which I understand to be a reliable source of Democrats votes. Maybe there’s a better way to draw this vis-a-vis the 8th?

District 13 — Peter Roskam (R)

VRA: W 68%, H 15%, B 10%

TTP: 50%

Biggert’s old district now stretches from Wheaton to Joliet. She no longer lives here (Roskam does), but the TTP listed is hers. If Roskam run here, his TTP would only be 17%; Kinzinger would have a TTP of 34%.

District 14 — Open Seat (R?)

VRA: W 62%, H 25%

TTP: 61%

Compacts immensely — no longer stretching out towards the Quad Cities, it is now limited to eastern Kane and far northwestern Cook. This is technically an open seat, since Hultgren lives in the neighboring 6th, although the TTP is his. I believe that both Foster and Bean live in this district. Walsh would have a TTP of 23%. It’s not as disincumbented as I was hoping for — any suggestions?

District 15 — Tim Johnson (R)

VRA: W 83%, B 10%

TTP: 54%

Switches orientations from north-south to east-west, dropping rural areas to pick up Decatur and Springfield. The Springfield area seems to be unusually Republican-friendly for a state capital, so I don’t think this hurts him as much as might be hoped. Nonetheless, this is one of the three districts outstate that I consider a potential D pick-up. Schock’s TTP is 22%, Schilling’s is 17%.

District 16 — Open Seat (R)

VRA: W 93%

TTP:  60%

Entirely relocated from the northwest to the southeast, where it takes over for the reapportioned-away 19th. (This also results in no old/new picture, since the number changes — you’ll have to scroll up to the overview.) Although technically an open seat, I assume that Shimkus would run here; the TTP is his. Johnson’s TTP is 21%; Costello’s is 14%. The second of the downstate Republican vote sinks.

District 17 — Aaron Schock (R) vs Bobby Schilling (R)

VRA: W 78%, B 11%

TTP: 45%

Of the Republican-held seats, this is the one I most strongly suspect would flip Democratic under my plan. A succesor in spirit, if not in form, to the current 17th. It strings together Rockford, the Quad Cities, and Peoria. The TTP listed is actually Manzullo’s, who doesn’t live in the district. Schock’s TTP is 26%; Schilling’s is 25%.

District 18 — Open Seat (R)

VRA: W 91%

TTP: 38%

Drops Peoria County and the northern suburbs of Springfield to pick up Bloomington-Normal. This is my third and last Republican vote sink. The listed TTP is Schock, the closest this district (which covers parts of five current ones) comes to an incumbent. Schilling’s TTP is 32%; Johnson’s is 15%; Kinzinger’s is 14%.

Summary

With the caveat again that Illinois is a hard state for me to judge, I think that this map averages around a 12-6 Democratic advantage. Best case scenario: 15-3. Worse case scenario: 8-10 (ie, the status quo, minus one Republican from reapportionment.)

Again, the goals for this map were to demonstrate two things: a possible way to disincumbent the Republicans by making their districts as different as possible from the current set-up and a possible way to swap out Lipinski for a new Hispanic representative. I remain curious about what people who actually understand Illinois think about my plan.