Michigan State House Redistricting, Part I

This is first in a series of diaries looking at redistricting in the Michigan State House. I’m not totally sure how many parts there will be yet. The current diary is focused on Wayne County, home of Detroit, and the county with the worst numerical net loss of population over the last ten years of any in the country — just short of a quarter million.

The upshot here is that Wayne County currently possesses 23 state house districts; with the population loss, it’s going to drop to 20. All three seats loss are Detroit-based.

Michigan has a 110-member state house. In 2010, the Republicans gained nineteen seats while losing none, to take control of the chamber by a 63-47 margin.

I haven’t done a full map yet, so I don’t know for sure where those seats are going, but I have to assume that the loss of three safe seats in Detroit is going to make the task of regaining the chamber even more difficult for the Democrats.

Maps and more after the jump.

Note: ideal district size is now 89,851 people. The allowed deviation is 5%, I believe, which translates to 4492 people.

Old Districts

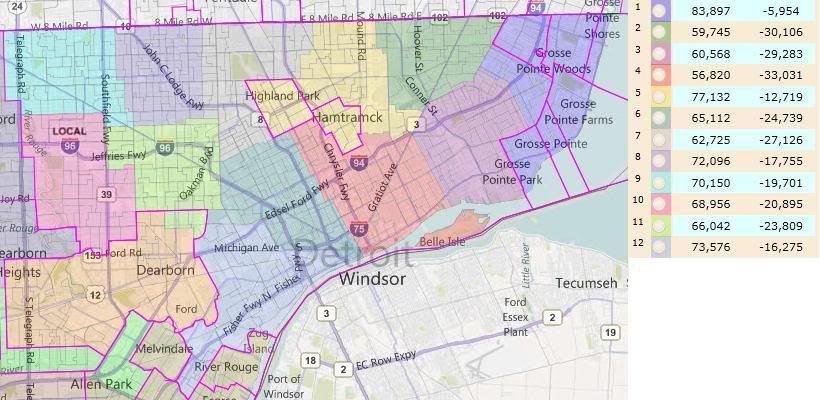
Here’s an approximation of the current districts based solely or partially in Detroit in Dave’s App:

Notice how under-populated the Detroit-based districts are. HD-01 (Grosse Pointes) is majority white; HD-12 (Southern Detroit) is majority Hispanic (total population, just short on VAP); the rest are majority African American. HD-01 is the only competive district, going 54-46 Democratic in 2010. The rest are safely Democratic.

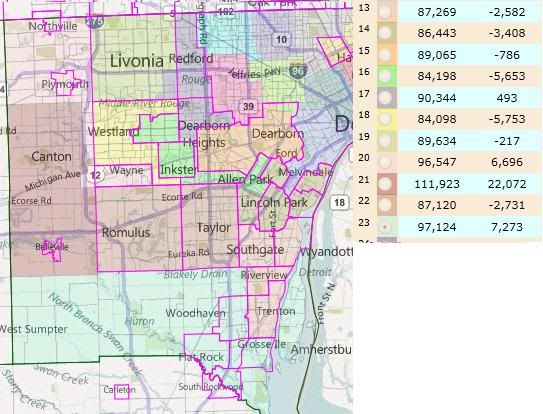
Here’s the approximation of the rest of the county’s districts:

I lightened the colors to make the locality boundaries stand out. This obscures, to my vision, one of the district boundaries. The boundary between HD-14 (Northern Downriver) and HD-22 (Romulus/Taylor) is the Taylor/Allen Park city line.

Surprisingly, to me, there are actually four districts that are overpopulated; three of which are outside the allowable deviation. HD-21 is going to have to be broken up — that’s a really significant positive deviation.

Republicans hold three of these seats: HD-19 (Livonia), HD-20 (Plymouth/Northville), and HD-23 (Southern townships). Of the remaining seats, only HD-21 is competitive. The Democrats held on in 2010 by 51%-49% – about 900 votes. All of these seats should be winnable by the right Democrat in the right environment — I’m pretty sure, for example, that Obama carried every Wayne County district. Also, I’m reasonably certain that HD-20 would have the most Republican PVI, and it was a 2010 pickup for them.

Collectively, the Wayne County districts are 246k underpopulated. The twelve Detroit-based districts account for all but .8k of that shortfall. (That is, the number of non-Detroit-based districts is the same. All of the districts lost in Wayne County will be Detroit-based.)

New Districts

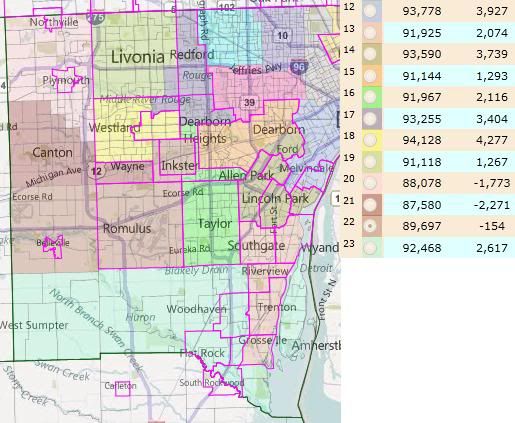
Michigan redistricting standards encourage linedrawers to maintain the integrity of localities where possible. This is the arrangement that I came to while redistributing the eleven non-Detroit-based districts within the limits of that guideline, while trying to protect the three Republican incumbents.

HD-23 (Southern townships) and HD-13 (Southern Downriver) are the only truly clean districts, with Gibraltar having been swapped from the former to the latter.

HD-21 needs to be broken up. Plymouth, Plymouth Twp, Northville, Northville Twp, Canton and Wayne combine to within 4k of the ideal for two districts. A real Republican plan would take into account how best to split Canton to their advantage; my selection of precincts to end up in HD-20 and HD-21 was arbitrary. HD-21, however, should end up more Republican than before: Van Buren Twp and Belleville together are both more Democratic and larger than Wayne.

Livonia and Dearborn are each slightly too large to be single district. I maintained Livonia’s current donation to HD-17, Dearborn ends up donating into HD-14 (Northern Downriver) instead of into Detroit. This is because HD-14 was too large with River Rouge (which therefore ends up in a Detroit-based district) but worked with the donation from Dearborn.

With Van Buren/Belleville bounded on the north by HD-21 and on the south by HD-23, the only place for them to go was into HD-22 to the east. This required Romulus and Taylor to split. I ended up combining Romulus/Van Buren/Belleville with Inkster and enough of Westland to connect them (the portion south of Garden City and east of Merriman Rd), thereby creating an African-American opportunity district. (It’s W 46.8, B 44.9 by total pop; W 50.7, B 42.4 by VAP.) Taylor then combines with the portion of Dearborn Heights south of Ford Road to make HD-16.

The final two districts are then HD-18 (Garden City and the portion of Westland west of Merriman Rd) and HD-17 (Redford, the part of Livonia not in HD-19, the part of Dearborn Heights not in HD-16, and the part of Westland not in HD-18 or HD-22).

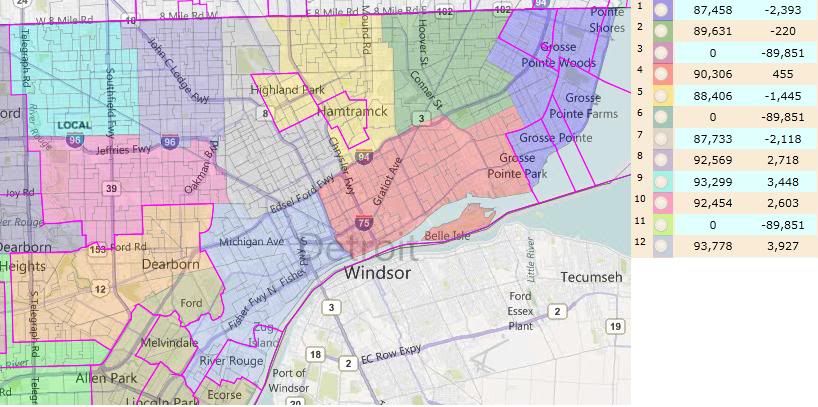
The Detroit-based district here are more representative than predictive. I don’t know enough about the incumbent representatives to know which the Republicans might favor or disfavor through redistricting. But you can see in general terms what Detroit looks like with three fewer districts than before.

HD-01 is still majority white, although slightly less so. (It should therefore become less competive for the Republicans.) HD-12 is no longer majority Hispanic. It previously contained every heavily-Hispanic precinct it could; its necessary growth diluted the Hispanic percentage down to 44.5% by total population and 39.2% plurality by VAP.

Conclusion

Republicans could potentially net as many as four state House seats in Wayne County from their control of the redistricting process: the three that are disappeared from Detroit (depending on where they end up) and HD-21, a competitive seat that will be somewhat less Democratic than before.

New York State Senate Redistricting: 43-19

After only two years of a slim 32-30 Democratic majority in the New York State Senate, Republicans in this past election barely took back the chamber that they had previously held continuously for more than forty years. People around the country endlessly ask the question: how is it possible that Republicans have a majority of state senators in a state as “blue” as New York?

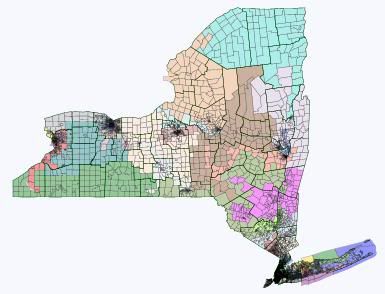
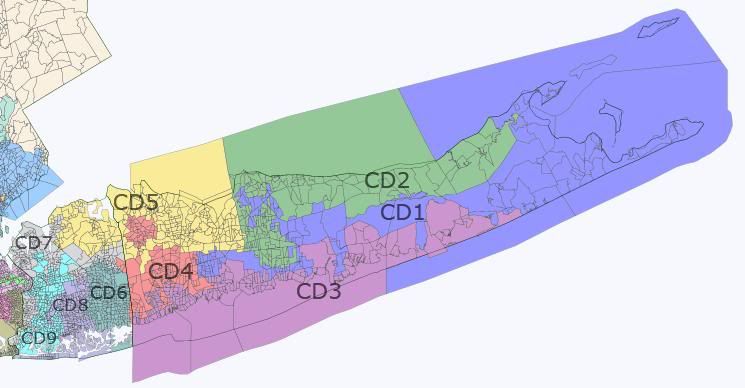
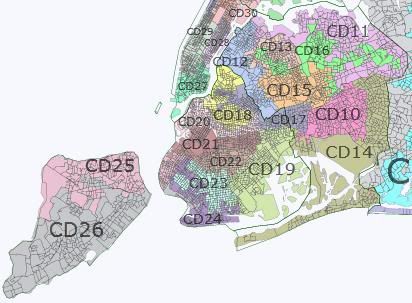
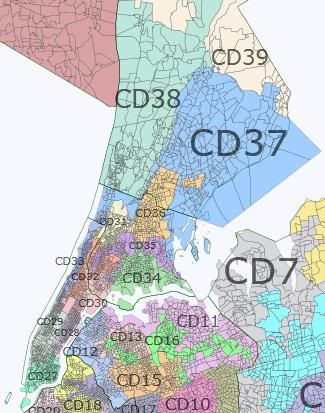
There is no simple answer to that question. Sufficed it to say, one of the most important factors is gerrymandering. Republicans did a masterful job of redistricting a very favorable map for themselves ten years ago. The current map is littered with Republican senators holding light blue Obama districts all over Long Island (9-0 Republican) and Upstate (21-4). With the great help of Daves Redistricting App 2.0, I set about in the task of redistricting New York's State Senate districts with three main goals in mind: 1.) connect Democratic towns and cities in Long Island, 2.) preserve majority-minority districts in New York City, and 3.) consolidate small cities Upstate. Much of the basis for my analysis comes from jeffmd's excellent post on the State Senate written in 2009 in which he looked at the numbers for the current districts. Inspecting the presidential toplines, it was determined that the cutoff between Republican and Democratic districts is about 58-60% Obama. My map uses that percentage as the benchmark. It would create 10 Democratic districts at over 58% in Upstate New York and another four at over 62% in Long Island. Combined with New York City, this would be more than enough to give Democrats a two-to-one majority in the State Senate. So without further ado, here is what I came up with:

New York 


District Pop. Center Pop. Wh% Bl% Asn% Hisp% Oth%
O% M%
D 1 Hamptons 318633 66 11 3 17 2
62 38
R 2 Brookhaven 318569 89 2 2 6 1
49 51
R 3 Lindenhurst 318229 89 2 1 6 1
47 53
D 4 Huntington 318189 60 17 3 18 2
63 36
R 5 Smithtown 318668 91 1 3 4 1
46 54
R 6 Massapequa 318525 90 0 3 5 1
44 56
D 7 Great Neck 318243 67 12 8 11 2
64 35
D 8 Hempstead 318681 51 26 3 18 2
69 31
R 9 Garden City 318620 86 1 5 7 1
43 56
D 10 Jamaica 317030 9 55 9 15 12 Black Majority 92 8
D 11 Bayside 317619 60 5 18 13 3
62 37
D 12 Astoria 315924 42 5 13 34 5
78 21
D 13 East Elmhurst 318053 15 9 16 57 3 Hispanic Majority 81 18
D 14 St. Albans 318613 22 55 4 13 5 Black Majority 82 17
D 15 Forest Hills 316488 59 5 15 17 5
63 36
D 16 Flushing 317432 24 3 48 21 4 Asian Plurality 68 31
D 17 Bushwick 317715 13 13 7 60 6 Hispanic Majority 87 12
D 18 Bedford-Stuyvesant 317273 26 51 2 17 4 Black Majority 90 9
D 19 Canarsie 317538 28 52 3 14 3 Black Majority 83 17
D 20 Brooklyn Heights 318797 25 51 3 18 3 Black Majority 93 6
D 21 Prospect 318898 19 51 5 22 3 Black Majority 92 7
D 22 East Flatbush 317890 21 56 6 12 5 Black Majority 85 14
R 23 Homecrest 316816 81 1 11 6 2
33 67
D 24 Brighton Beach 317711 56 6 21 13 3
55 44
D 25 North Shore 318201 49 13 10 24 4
66 34
R 26 Arden Heights 323582 84 1 6 7 1
37 62
D 27 East Village 311559 45 6 27 19 3
84 15
D 28 Upper East Side 309905 83 3 8 5 2
75 24
D 29 Upper West Side 310495 73 5 8 11 2
85 14
D 30 Spanish Harlem 309111 22 23 3 50 2 Hispanic Majority 91 8
D 31 Bedford Park 308720 12 19 5 61 3 Hispanic Majority 90 9
D 32 Harlem 309836 2 61 1 33 2 Black Majority 97 2
D 33 Washington Heights 309056 22 12 4 60 2 Hispanic Majority 90 9
D 34 Soundview 309592 10 28 3 55 3 Hispanic Majority 90 10
D 35 Belmont 308704 21 21 3 53 2 Hispanic Majority 84 16
D 36 Mount Vernon 309493 14 60 2 20 4 Black Majority 92 8
D 37 Harrison 309361 73 7 5 13 2
61 38
D 38 Yonkers 309287 56 14 5 21 3
64 35
D 39 Ossining 309454 76 7 3 13 1
59 40
D 40 Clarkstown 317946 72 10 5 10 2
53 47
R 41 Carmel 321768 88 3 2 6 1
46 53
D 42 Poughkeepsie 317728 71 12 2 13 2
58 41
D 43 Kingston 320216 85 6 1 6 2
60 38
D 44 Troy 317388 86 6 3 3 2
58 40
D 45 Plattsburgh 317612 94 2 1 2 2
58 40
D 46 Albany 315314 84 9 2 3 1
63 35
R 47 Moreau 317511 96 1 1 1 1
49 49
R 48 Rome 317470 91 4 1 3 1
44 54
D 49 Syracuse 317634 80 12 2 3 3
62 36
R 50 Utica 317412 91 4 1 2 1
54 45
R 51 Herkimer 316544 96 1 0 2 1
45 53
R 52 Blooming Grove 319845 90 3 1 4 1
46 52
D 53 Ithaca 318178 87 4 3 3 2
61 38
R 54 Penn Yan 317011 95 2 0 2 2
47 51
R 55 Perinton 316789 92 3 3 2 1
51 47
D 56 Rochester 318289 60 26 3 9 2
72 27
R 57 Corning 317311 95 1 1 1 2
42 56
D 58 Amherst 317906 80 14 2 2 1
61 38
R 59 Hamburg 318084 94 1 1 2 2
49 49
D 60 Buffalo 317816 67 23 1 6 3
69 29
R 61 Batavia 318545 94 2 0 2 1
41 57
R 62 Greece 318537 93 3 1 2 1
46 52

Note, also, that I broke the state into four regions for simplicity: Upstate, Westchester/Bronx/Manhattan, Brooklyn/Queens/Staten Island, and Long Island. Here is another table that breaks down the numbers by region:

Region County Population Districts (+/-) 316280 (+/-)
Long Island Suffolk 1516544


Nassau 1349555


2866099 9 0 318323 0.6
New York City Queens 2320449


Brooklyn 2588844


Staten Island 496246


5405539 17 1 317972 0.5

Manhattan 1646675


Bronx 1415056


Westchester 961565


4023296 13 1 309484 -2.1
Ustate New York Rockland 301308


Other 7010169


7311477 23 -2 317890 0.5

As you can see from the table, I redraw the map so that NYC gained two seats at the expense of Upstate New York, while Long Island remained the same at 9 districts. The population of each district in each region is very equal with the greatest deviation of -2.1% below the ideal population in the region of Westchester/Bronx/Manhattan. The rest of the seats compensate for this by being about .5% above the ideal. Before discussing the statewide changes that would occur under this redistricting plan, first let me go through the four regions themselves…

Long Island


District Pop. Center Pop. Wh% Bl% Asn% Hisp% Oth% O% M%

D 1 Hamptons 318633 66 11 3 17 2 62 38

R 2 Brookhaven 318569 89 2 2 6 1 49 51 Ken LaValle-1, Port Jefferson
R 3 Lindenhurst 318229 89 2 1 6 1 47 53 Lee Zeldin-3, Shirley Owen Johnson-4, West Babylon
D 4 Huntington 318189 60 17 3 18 2 63 36

R 5 Smithtown 318668 91 1 3 4 1 46 54 John Flanagan-2, East Northport Carl Marcellino-5, Syosset
R 6 Massapequa 318525 90 0 3 5 1 44 56

D 7 Great Neck 318243 67 12 8 11 2 64 35

D 8 Hempstead 318681 51 26 3 18 2 69 31 Charles Fuschillo-8, Merrick Dean Skelos-9, Rockville Centre
R 9 Garden City 318620 86 1 5 7 1 43 56 Kemp Hannon-6, Garden City Jack Martins-7, Mineola

(The table above is a portion derived from the table in the intoduction. However, included in this table and the three that are to follow it, the number for each district has a link to a picture of that district's new boundaries. Also, I included the incumbent senators in whichever district that they would live in if my map went into affect. Each senator's party is denoted by the font color, and the data entries include the number district that each senator currently represents in the State Senate, as well as where they live and a link to their official biographies.)

Long Island has been the province of Republicans in the New York State Senate for many decades. At the height of the Democratic wave in 2008, Long Island elected only two Democratic senators out of nine total. Both of them lost their seats in this last election, returning Long Island to its usual position of having only Republicans represent them in the State Senate. It's not as though Long Island is that conservative overall — indeed, all but one of the current nine senate districts in Nassau and Suffolk Counties was won by Obama. Republicans have been very effective in diluting Democratic votes, thereby allowing many independents who fear a complete Democratically-controlled Albany to elect Republican candidates for the State Senate.

Of the eight Obama-voting Long Island Senate districts, none of them were won by more than about 55%, which is a very managable percentage for incumbent GOP senators, including the new Majority Leader Dean Skelos, who hails from Rockville Centre in Nassau County. In this region, the goal was to be realistic about what could be achieved and very cautious in achieving it. I drew up four Democratic districts each at over 62% for Obama.

Three out of the four new Democratic districts that I created are left open for any Dem who wants them. The most Democratic district in the region — SD-8, based in Hempstead and Long Beach — is occupied by Skelos and Senator Charles Fuschillo. As the Black and Hispanic populations are spread throughout Long Island, each district retains their white majority.


Queens, Brooklyn, and Staten Island


District Pop. Center Pop. Wh% Bl% Asn% Hisp% Oth%
O% M%


D 10 Jamaica 317030 9 55 9 15 12 Black Majority 92 8 Shirley Huntley-10, Jamaica

D 11 Bayside 317619 60 5 18 13 3
62 37 Tony Avella-11, Whitestone

D 12 Astoria 315924 42 5 13 34 5
78 21 Michael Gianaris-12, Astoria

D 13 East Elmhurst 318053 15 9 16 57 3 Hispanic Majority 81 18

Jose Peralta-13, East Elmhurst


D 14 St. Albans 318613 22 55 4 13 5 Black Majority 82 17 Malcolm Smith-14, St. Albans

D 15 Forest Hills 316488 59 5 15 17 5
63 36


D 16 Flushing 317432 24 3 48 21 4 Asian Plurality 68 31 Toby Ann Stavisky-16, Flushing

D 17 Bushwick 317715 13 13 7 60 6 Hispanic Majority 87 12 Joseph Addabbo-15, Ozone Park Martin Malave Dilan-17, Bushwick
D 18 Bedford-Stuyvesant 317273 26 51 2 17 4 Black Majority 90 9


D 19 Canarsie 317538 28 52 3 14 3 Black Majority 83 17 John Sampson-19, Canarsie

D 20 Brooklyn Heights 318797 25 51 3 18 3 Black Majority 93 6 Valmanette Montgomery-18, Boerum Hills Eric Adams-20, Crown Heights Daniel Squadron-25, Brooklyn Heights
D 21 Prospect 318898 19 51 5 22 3 Black Majority 92 7 Kevin Parker-21, Flatbush

D 22 East Flatbush 317890 21 56 6 12 5 Black Majority 85 14


R 23 Homecrest 316816 81 1 11 6 2
33 67 Martin Golden-22, Bay Ridge

D 24 Brighton Beach 317711 56 6 21 13 3
55 44 Carl Kruger-27, Sheepshead Bay

D 25 North Shore 318201 49 13 10 24 4
66 34 Diane Savino-23, Staten Island

R 26 Arden Heights 323582 84 1 6 7 1
37 62 Andrew Lanza-24, Great Kills

While much of Staten Island remains a stubborn Republican bulwark, Queens and Brooklyn voted overwhelmingly for Barack Obama in 2008. They are home to most of New York City's black population, as well as significant Hispanic and Asian communities. Since this area of the state is so heavily Democratic, the overriding goal for this region was not to squeeze out more Democratic seats, but to strengthen a few shaky ones and create new Voting Rights Act (VRA) districts wherever possible. Under my plan, this region would gain one additional seat as a result of new population estimates given by the Census Bureau. 

This map preserves the two African-American majority districts in Queens and adds a fifth black majority district to the four that already exist in Brooklyn. One of the best things about this map is that it creates an Asian plurality district that is based in Flushing and spread throughout many parts of Queens. The 16th district is currently represented by Sen. Toby Ann Stavisky, but if the Asian community were able to unite around a consensus candidate, she could well be displaced in a primary. I found it impossible to make the 16th District any more heavily Asian than 48%, but the next largest racial community was 24% of the population, so if Stavisky were to retire, this would most likely go to an Asian candidate. It also preserves the two Hispanic majority districts in Queens and Brooklyn.

The recently-flipped 11th and 15th Districts would be strengthened for the Democrats. Carl Kruger's 27th district in southern Brooklyn would be radically changed into the 24th district, both strengthening our vote there and also allowing for a primary challenge to the less-than-venerable “Amigo.” At 55% for Obama, the 24th is one of two districts that I created below the magic 58% line that I still counted in the Democratic column — largely because presidential voting patterns in southern Brooklyn are volatile and not necessarily indicative of a broader ideological differentiation. What Republican-leaning communities that do exist here would be consolidated into two large McCain majority districts: the 23rd in southern Brooklyn and the 26th in southern Staten Island, both of which are currently represented by Republican Senators anyway.


Manhattan, Bronx, and Westchester County


District Pop. Center Pop. Wh% Bl% Asn% Hisp% Oth%
O% M%

D 27 East Village 311559 45 6 27 19 3
84 15

D 28 Upper East Side 309905 83 3 8 5 2
75 24 Liz Krueger-26, Upper East Side
D 29 Upper West Side 310495 73 5 8 11 2
85 14 Thomas Duane-29, Upper West Side
D 30 Spanish Harlem 309111 22 23 3 50 2 Hispanic Majority 91 8 Jose Serrano-28, Spanish Harlem
D 31 Bedford Park 308720 12 19 5 61 3 Hispanic Majority 90 9 Gustavo Rivera-33, Kingsbridge Heights
D 32 Harlem 309836 2 61 1 33 2 Black Majority 97 2 Bill Perkins-30, Harlem
D 33 Washington Heights 309056 22 12 4 60 2 Hispanic Majority 90 9 Adriano Espaillat-31, Washington Heights
D 34 Soundview 309592 10 28 3 55 3 Hispanic Majority 90 10 Ruben Diaz-32, Soundview Jeffrey Klein-34, Throgs Neck
D 35 Belmont 308704 21 21 3 53 2 Hispanic Majority 84 16

D 36 Mount Vernon 309493 14 60 2 20 4 Black Majority 92 8 Ruth Hassel-Thompson-36, Williamsbridge
D 37 Scarsdale 309361 73 7 5 13 2
61 38 Suzi Oppenheimer-37, Mamaroneck
D 38 Yonkers 309287 56 14 5 21 3
64 35 Andrea Stewart-Cousins-35, Yonkers
D 39 Ossining 309454 76 7 3 13 1
59 40

This region, encompassing Manhattan, Bronx, and Westchester County, is the most strongly Democratic area in one of the most Democratic-leaning states in the Union. It is home to the largest Hispanic communities in the Northeast United States — mostly Peurto Rican, but also Dominican, Mexican, and other Latin American heritages. The white communities here also tend to be much more liberal than their counterparts in Brooklyn, Queens, and Staten Island. That is especially the case in Manhattan and Westchester, which are home to many educated urban white professionals.

All twelve districts here are represented by Democrats in the State Senate. That would stay the same under my plan, except for the addition of a thirteenth Democratic district. This is the second distric that comes at the expense of Upstate New York — the other one being in Brooklyn.

Both majority African-American districts would remain intact. The map also adds another Hispanic-majority district to the four that currently exist.

Upstate New York


District Pop. Center Pop. Wh% Bl% Asn% Hisp% Oth% O% M%

D 40 Clarkstown 317946 72 10 5 10 2 53 47 David Carlucci-38, Clarkstown
R 41 Carmel 321768 88 3 2 6 1 46 53 Greg Ball-40, Patterson

D 42 Poughkeepsie 317728 71 12 2 13 2 58 41 Bill Larkin-39, New Windsor Stephen Saland-41, Poughkeepsie
D 43 Kingston 320216 85 6 1 6 2 60 38

D 44 Troy 317388 86 6 3 3 2 58 40 Hugh Farley-44, Schenectady
D 45 Plattsburgh 317612 94 2 1 2 2 58 40 Betty Little-45, Queensbury Patty Ritchie-48, Heuvelton
D 46 Albany 315314 84 9 2 3 1 63 35 Neil Breslin-46, Albany James Seward-51, Milford
R 47 Moreau 317511 96 1 1 1 1 49 49 Roy McDonald-43, Stillwater
R 48 Rome 317470 91 4 1 3 1 44 54 Joseph Griffo-47, Rome
D 49 Syracuse 317634 80 12 2 3 3 62 36 David Valesky-49, Oneida John DeFrancisco-50, Syracuse
R 50 Utica 317412 91 4 1 2 1 54 45

R 51 Herkimer 316544 96 1 0 2 1 45 53

R 52 Blooming Grove 319845 90 3 1 4 1 46 52 John Bonacic-42, Mount Hope
D 53 Ithaca 318178 87 4 3 3 2 61 38 Thomas Libous-52, Binghamton Michael Nozzollio-54, Fayette
R 54 Sodus 317011 95 2 0 2 2 47 51

R 55 Perinton 316789 92 3 3 2 1 51 47 James Alesi-55, East Rochester
D 56 Rochester 318289 60 26 3 9 2 72 27

R 57 Corning 317311 95 1 1 1 2 42 56 Thomas O'Mara-53, Big Flats Catharine Young-57, Olean
D 58 Amherst 317906 80 14 2 2 1 61 38 Tim Kennedy-58, Buffalo
R 59 Hamburg 318084 94 1 1 2 2 49 49 Pat Gallivan-59, Elma Mike Ranzenhofer-61, Clarence
D 60 Buffalo 317816 67 23 1 6 3 69 29 Mark Grisanti-60, Buffalo
R 61 Batavia 318545 94 2 0 2 1 41 57

R 62 Greece 318537 93 3 1 2 1 46 52 Joe Robach-56, Greece George Maziarz-62, Newfane

Here more than anywhere else in the state, Republicans dominate in local and state politics. Recently, Democrats lost five of their ten Upstate congressional districts. This is also where Republicans picked up two Senate seats and gained about a half-dozen Assembly seats last fall. Nevertheless, there are still many strongly Democratic areas of Upstate New York: mostly medium- and small-sized cities and liberal inner-suburbs that dot the landscape from the Hudson Valley to the Great Lakes. The goal was to consolidate those areas and churn out as many new Democratic districts as possible. Here again, as in Long Island, the minority ethnic populations are too spread out to create any VRA districts. Instead, this is where the great bulk of Republican Senate seats would hit the buzz-saw.

The region as a whole would lose two seats, mostly from the equalization of populations in each Senate district — which Republicans largely disregarded during the last redistricting ten years ago — as well as the much greater population growth downstate.

I was able to get about half of these 23 districts in the Democratic column. The 40th District, based in Rockland County, is the second of only two districts in this entire map (the other being in southern Brooklyn) that I counted as a Democratic district even though Obama's vote there was less than 58%. The reason is that this seat was one of very few elected offices around the country that Democrats actually gained from the Republicans in this last election. The seat would also bolster its Democratic vote through redistricting, so I figured, if David Carlucci could pick it up for the Dems in a year like 2010, odds are pretty good that he'll be able to hold it in a lot of other political environments.

I was able to get ten of these districts at over 58% for Obama. One of the most certain Democratic gains under this plan would be my native 56th Senate District, based in the City of Rochester and the Town of Brighton. Republican Senator Joe Robach has vexingly been able to hold onto this district for years despite the fact that it voted by a two-to-one margin for Barack Obama in 2008 (66%-33%). Under this plan, Robach's hometown of Greece would be removed from the 56th and replaced by the Democratic-leaning suburbs of Gates and Irondequoit.

The four seats that we do hold here would be strengthened. The 60th District, which is even more Democratic district than the 56th, voted out a Democratic incumbent last fall. This district would remain largely unchanged in the hope that a different Dem might likely be able to win it back from freshman Republican Senator Mark Grisanti.

As is convention when State Senate seats are redistricted in Upstate New York, I left every town intact. In addition, only two cities are divided between different districts: Buffalo and Tonawanda (just south of Niagra Falls). The self-imposed requirement that towns be left undivided was a major constraint, but it would probably help a plan like this to survive a court challenge.


Summary:

A major drawback of this map is that without realizing it, I redraw the lines with no attention paid to which district each senator lives in. Hence, a lot of Democratic primaries and games of musical chairs would happen in this plan that might otherwise have been avoided. But, by the time I realized it, it was too late. In any event, many more Republicans get stuck together than Democrats, so that serves to counter-balance this problem.

This map pays tribute to the Voting Rights Act by creating three new majority-minority district: a new Black-majority district in Brooklyn, an Asian-plurality district in Queens, and a fifth Hispanic-majority district in the Bronx.

My plan also evens out the population disparities between regions by making every seat within only a few thousands residents off from the ideal population of 316,280 people per district. In applying a fairer division among the state's population and using new population estimates given by the Census, Upstate New York lost two districts to New York City.

I am confident that if this plan went into affect at the next election, Democrats would hold a large 43-19 majority in the New York State Senate for many years to come. But alas, Republicans won back this chamber last year and thus, it is not to be. However, I'm still convinced that with new population estimates, it will be extremely difficult for Republicans to redistrict another map that would allow them to retain the majority. Their luck has simply run out. They may be able to preserve many incumbents in Upstate and Long Island, but remember that Democrats only need to gain one seat for them to retake the majority (a 31-31 tie would allow Democratic Lt. Gov. Bob Duffy to act as the tie-breaker). And as I've shown through this analysis, downstate will have to gain two seats for the next redistricting plan to be in compliance with the Census.

It took many practice tries, but I believe this map provides the strongest possible plan for a large Democratic majority in the Senate that not only respects existing VRA districts, but also creates three new ones. In short, this is the ideal Democratic redistricting plan for the New York State Senate.

California Redistricting Pick Six

Starting today at 9:30AM Pacific, the eight current members of the California Redistricting Commission will choose the six additional members (two of each party group) who will complete the panel. Your mission, should you choose to accept it, is to correctly guess who those six members will be.

The current eight are as follows:

Rose Report (http://rosereport.org/20101118/state-auditor-selects-first-8-members-of-ca-redistricting-commission/)

Democrats:

Cynthia Dai – Female, Asian-American, San Francisco, SF County

Elaine Kuo – Female, Asian-American, Mountain View, Santa Clara County

Jeanne Raya – Female, Latina, San Gabriel, LA County

Republicans:

Vincent Barabba – Male, Anglo, Capitola, Santa Cruz County (former director of U.S. Census Bureau)

Jodie Filkins Webber – Female, Asian-American, Norco, Riverside County

Peter Yao – Male, Asian-American, Claremont, LA County (city councilmember)

Other:

Stanley Forbes – Male, Anglo, Esparto, Yolo County

Connie Galambos Malloy – Female, African-American, Oakland, Alameda County

The lists of remaining members can be found at www.WeDrawtheLines.ca.gov

Here are my picks:

Gil Ontai, Rep, San Diego (only applicant left from San Diego)

Byrd Lochtie Other, Humboldt (only person from North of Sacramento)

Maria Blanco, Dem, Los Angeles (only applicant from LA City)

Teresa Espana, Other, Fresno (Central Valley)

James Vidal, Rep, Riverside

Gabino Aguirre, Dem, Ventura

And having gone through them, I doubt I’ll get more than two of them right. The combination of the leadership strikes and the lottery produced some disproportionalities that I couldn’t figure out how to overcome.

DLCC Essential Race: Can Dan “Death Threat” Manning Dominate Downballot?

We’re going way downballot, baby. As I like to say: SSPers do it downballot.  [and yes, I would buy a t-shirt that said that]

Wait, what is the DLCC and what are their essential races?

The Democratic Legislative Campaign Committee is the downballot counterpart to the attention-hogging DCCC (triage!) and DSCC (save the saucer!). They focus on state legislative races and are especially active this cycle with redistricting hanging in the balance. State legislatures, of course, are crucial players in the process, and swinging them our way will help prevent DeLaymanders. The DLCC party poohbahs, as it were, selected 40 races, mostly focused on redistricting and the most hotly-contested state houses. Party Picks 1-20. Party Picks 21-40. But then the DLCC did something that made me love them. Oh yes, love. The DLCC solicited right here on SSP, nominations for more of these Essential downballot races. And apparently, we nominated the hell out of our candidates, because the DLCC announced The Grassroots 15, instead of just 10. And frankly, looking at the grassroots nominees, we did good y’all.

Why should I care?

Besides being SSP’s bread and butter (well, Congressional races are probably the bread & butter…downballot is more like…the arugula?), I would posit that it is these sort of races that are truly the purest form of American democracy. The Founders, I think, both envisioned and practiced this sort of meet-your-neighbors campaigning. Downballot races are also much more dependent on candidates–almost never national forces sweep in and, say, donate $13 million to Sharron Angle when she’s running for the Nevada state legislature. But the great thing from the perspective of civic-minded citizens is that participating in races like these can yield bigger and more tangible results than say, giving Jack Conway $20 (not that there’s anything wrong with that). But when $20-$25k is enough for the entire race, even a small donation to Manning’s campaign can make a big difference. So why does the DLCC say this race matters?

Why this Race Matters: This campaign turned ugly for Democratic nominee Dan Manning a few weeks ago when he discovered a death threat laced with anti-gay slurs on his doorstep. Manning is a decorated West Point graduate who was discharged from the military because of Don’t Ask Don’t Tell. If Manning wins his race, factional divisions within the state Republican Party would give him considerably more influence in the Kansas House than the GOP’s wide chamber majority would suggest.

Plus, as our own James L. pointed out in a 2006 diary:

Democratic gains in state legislatures are crucial for building the “farm team” for higher offices.

That James L. link btw, enumerates the gains made in state legislatures in the 2006 election. And James, of course, is/was right–state Rep. Raj Goyle (KS-04) and state Rep. Bryan Lentz (PA-07), for example, are now in tight races for Congress, and were among those 268 net pickups in 2006 (that was in state Houses alone).

Well, in Dan Manning, Democrats may have a candidate who could eventually go far, far beyond the mostly middle-class neighborhoods of Wichita’s 91st District. Find out why, after the jump….

Dan Manning at ArtAid BenefitTHE CANDIDATE:

Dan “Death Threat” Manning … oh yeah, I’m making that his official nickname now.

Since we last checked in on him and his campaign, as well as other top state legislative races in Kansas, Dan “Death Threat” Manning has emerged as one of the Kansas Democratic Party’s most formidable new candidates.

He’s like the new Sean Tevis, except way, way different.

Georgia-born Dan Manning is a West Point grad (’04) and Mandarin-speaking military vet booted from the Army thanks to “Don’t Ask, Don’t Tell” (timely!).

If I have the story right, Manning actually “told” via press release upon announcing the formal creation of Knights Out, the pro-LGBT, anti-DADT West Point alumni group. Manning currently sits on the Knights Out board.

UPDATE: Yeah, I was totally wrong. He was outed and kicked out before they did the whole press release thing. Still, I’ve never come out via press release, and I don’t really know of many who have.

Btw, guess who Dan Manning recruited to be spokesperson and a co-founder of Knights Out? Dan Choi.

So yes, gays, you partially have Dan Manning to thank for Dan Choi becoming the badass LGBT activist he is today.

After all, Dan Choi probably wouldn’t have been on TV talking to Rachel Maddow if he wasn’t speaking for Knights Out at the time. And thus, no springboard to national fame.  

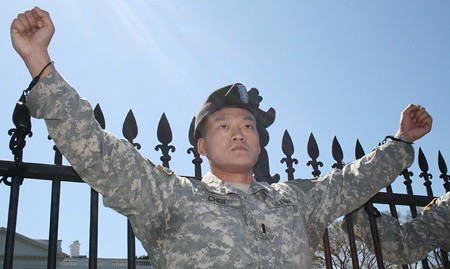
Dan Choi Chains Himself To White HouseNo seriously, thank you for Dan Choi.

After getting his honorable discharge from the US Army, Manning put his artillery battalion skills to use in electrical engineering and business management, oh, and picked up an MBA and started work on a PhD. After almost four years in the private sector, he currently serves as a production supervisor at AGCO, which manufactures tractors and all manner of farming-related “Serious Machinery” in Hesston, KS, a little ways north of Wichita.

I honestly couldn’t have written a better profile for the first openly-gay member of the state Legislature…and I’m, like, a really good writer. As a campaigner, the West Point discipline has him canvassing and campaigning with precision, and it also neutralizes much of the potential antipathy from the D by his name and the rainbow in his heart. He works at an actual factory (Labor) but as a managerial type (Business) who is soon to have a PhD (Education/Professionals). Sure, he’s gay (LGBT) but he was a soldier first (Military). Oh, and did I mention he manufactures tractors and farming equipment (Farmers).

Let’s see…Labor, Business, Professionals, LGBT, Military, and Farmers….that’s not just a Democratic coalition that can win in Kansas, that’s a Democratic coalition that can wipe the floor with its opponents in Kansas. Basically, Dan Manning has the Kansas version of the profile Harvey Milk wished he’d had. Look, I don’t invoke the de-facto Gay MLK lightly (well, he was a politician, so maybe Milk is the…Gay Obama?). But it’s true. Manning has the profile to do really, really well in politics. And dude’s just 30, and if he wins this year, as I think he probably will in the end, he could be … is… someone good.

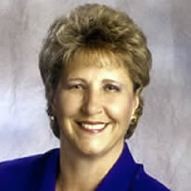
Brenda Landwehr - official photoTHE OPPONENT:

Dan Manning’s opponent is state Rep. Brenda Landwehr, who has been in the Legislature since 1995 and now serves as the Health & Human Services Chair. Her biggest donor? The KS Hospital Association, of course, followed immediately by Koch Industries, then the KS Bankers Association, rounded off by everyone’s favorite small business killer: Wal-Mart. Quite a Top 4, even for a hard-right Republican…

While she has a long anti-gay, anti-moderate, anti-anything-but-super-conservative record, Landwehr’s latest media buzz was as an attack dog against fellow state Rep. Raj Goyle, the well-funded Democrat making a strong bid to become Wichita’s Congressman. She made her forceful comments as a main backer of Mike Pompeo at a Republican legislator unity rally that turned out to be not-so-united when Pompeo’s primary rival, moderate state Sen. Jean Schodorf, was a no-show. Source: Wichita Eagle

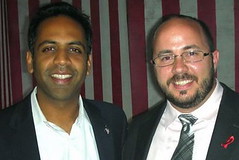
Raj Goyle & Dan ManningIf moderate Republicans don’t come home to Pompeo (and his ineffectual campaign doesn’t seem to be helping), Kansas could end up electing an Indian-American Democrat to a R+14 seat.

Yes, Pompeo may yet win the KS-04 seat thanks to its ruby red nature, but he is not particularly popular outside of the Koch set. The 91st, on the other hand, the one Brenda Landwehr actually has to run in, is decidedly swingy–purple, if you will.  Let’s explore it!

THE BATTLEFIELD:

Welcome to Wichita, Kansas, the biggest city in the state we all think of as “Home” (thanks Wizard of Oz!). In the 91st district, you’ve got partisan demographics that are pretty close to those statewide.

Partisan Makeup of Kansas: 43.5R/27D/28.6U

Partisan Makeup of the 91st District:  42R/31D/26.4U

As you can see on the District Map, the 91st is located in the northern reaches of the city of Wichita. Most of these areas are relatively new-ish and decidedly middle-class. They’re mostly the type of folks who are scrupulous with their yards, and picky with their political yard signs.

Finally, a note to Karl Rove wannabes: the death threat is not an effective political weapon. It will almost certainly backfire…especially when you try it on a West Point graduate who knows how to handle a gun.

Please help win this Essential Race for Kansas, America, rainbows, puppies, children, veterans and the American Way:

Donate to Dan Manning by clicking here.

Please help. Seriously. Please. Pretty please with a cherry on top. Please. Dan Manning actually has “first LGBT President of the United States” potential. Do it for America.

By what margin will Bob Shamansky win?

View Results

Loading ... Loading ...

Nominate your own Essential Race

As Crisitunity noted in this afternoon's Daily Digest, the DLCC recently unveiled the first wave of our “Essential Races” program – highlighting key legislative districts that we anticipate will show which way the political tide is turning this fall.

But the Essential Races program is a two-way street.

That's why we're so excited to announce that on October 13th, the DLCC will add 10 grassroots-nominated districts to the Essential Races list, determined by nominations from individuals like you.

Anyone can submit a nomination, and any state legislative campaign in 2010 is eligible.

Simply click here or visit www.dlcc.org/2010Races to nominate an Essential Race.

Back in 2008, the Essential Races chosen through public nominations included a lot of campaigns in battleground states, but they also included a few campaigns in states that weren't top targets, but where something about the district or the Democratic nominee made the race unique and deserving of special attention.

We might have overlooked some of those key races without help from supporters like you, and we'd be foolish not to ask for your help again this year.

Swing State Project is the place to go for information like that.  So if you know of a critical state legislative campaign that you think deserves special attention, please visit www.dlcc.org/2010Races to submit your nomination.

Sincerely,
The Democratic Legislative Campaign Committee

KS: Complete Kansas State Legislative Race Ratings 2010, Districts 41-80

In my last diary, I ran through KS House seats 1-40, so if you haven’t read that, I’d advise starting there. In this edition, I’ll examine seats 40-80, which include some in suburban Johnson County (heavily covered in the previous edition) as well as Topeka, Salina, and much of the eastern & central parts of the state, even reaching down to the Wichita exurbs.

KANSAS HOUSE OF REPRESENTATIVES – 125 seats

Current composition: 76 Republicans, 49 Democrats (or about 61%-39%)

HOW TO READ THE COMPETITIVE SEAT LISTINGS:

KS-HR-# <—this is the district’s number

43.5R/27D/28.6U   <—this is the voter affiliation breakdown, R is Republican, D is for Democrat, and U is unaffiliated voters. Statewide, as of June 2010, the state’s registration numbers were 43.5% Republican, 27.2% Democrat, and 28.6% Unaffiliated. Unless the tenth of a percent is a 4, 5 or 6, I rounded to the nearest full percentage point in most cases.

District Map    <—-this is the official map (pdf format) of this district from the Legislature’s website (opens in a new window). Maps from: KSLegislature.org.

MAIN SOURCES:

Candidate Guide + District PVIs from Capitol Strategies LLC [pdf]

Guide to every KS House seat’s past voting from OurCampaigns.com

Candidate Fundraising from Ethics.ks.gov

COMPETITIVE SEAT LISTINGS:

KS-HR-41: 32R/34.5D/32.5U : District Map : (D/Open) – With the retirement of Democrat Marti Crow, this still-competitive, but increasingly blue, seat is now open. In 2008, Crow smacked down Republican Jana Taylor Goodman 59-41, who, having won the Republican primary convincingly, is back for another try at the seat in 2010. Crow and other local Democrats are backing Nancy Bauder, the Exec. Dir. of the Community Development Corp. of Leavenworth, and a small business owner. Gov. Parkinson held a fundraiser for Bauder, whose high-quality website makes Goodman’s look outlandishly amateurish. Her economic development credentials are also flawless, and make Goodman’s non-existent ones even more pronounced. Rating: Lean Democrat

Connie O'Brien, Worst State Representative in KansasKS-HR-42: 41R/27D/31U :  District Map : (R) Connie O’Brien, a retired special education teacher, won her seat in 2008 with almost 60% of the vote against the underfunded Timothy Moran, but faces a challenge from James “Jim” Pittman, a military veteran, engineer, and Chairman of the Lansing Planning Commission. O’Brien, a mother of 11(!) and vice-chair of Leavenworth County Republicans, is a past President (1996) of Kansans for Life, the most powerful local anti-abortion group. As such, she’s aligned herself with the hardcore conservatives, both socially and fiscally. This could make her vulnerable to a strong challenge, though I’m unsure if Pittman can provide it (though he certainly has a good profile to do it). Rating: Likely Republican

On a personal note, having examined lots of local legislators’ websites, voting records, biographies, positions and electoral histories, I have concluded that Connie O’Brien is the single worst person in the entire Kansas Legislature. She is a hardcore, unthinking, dogmatic partisan who insults her fellow legislators (Democrats and Republicans alike) while distorting the work of the Legislature. While Connie’s Corner sounds like the type of place you might find knitting tips, with Connie O’Brien you’ll find intense partisan invective that you won’t find on nearly any other legislator’s website. And what the hell kind of grandmother votes against requiring people to wear seatbelts while voting to let them smoke in restaurants? She is a lying, egotistical, hypocritical bigot whose presence in the Legislature is a disgrace to the state, and especially to the people of Leavenworth County.

Kevin King of Kansas, District 43 Candidate"Big" Mike KiegerlBeard Fight!

KS-HR-43: 44R/22D/33.4U :  District Map : (R) Mike Kiegerl (at right) was first elected to this new district upon its creation in 2002. He’s faced a declining share of the vote as the area urbanizes (well, suburbanizes) and grows more moderate, taking only 53% of the vote in 2008 (thanks to a Libertarian eating a huge 12% of the vote). This cycle, he faces Democrat Kevin King (at left), an analyst at Sprint, who looks a bit like Kiegerl, actually. The area remains quite Republican-friendly and Kiegerl has been a low-profile conservative, but King’s been running a pretty strong campaign, racking up endorsements and showing up at community events.  Rating: Lean Republican

KS-HR-45: 35.6R/32D/32U :  District Map : (R) Tom Sloan – While the moderate Sloan has managed to hold this blue-tinted district since 1995, winning 53-47 over an untested Democrat in 2008, his luck may be about to run out as he faces two-term former Lawrence school board member (and former President) Linda Robinson. She also happens to be a longtime community leader (Governor’s Education Council, Lawrence Chamber of Commerce, Rotary Club, etc) while not being terribly old (I’d guess late 50s?) She’s about as top-tier as they come for a race like this. Rating: Tossup

KS-HR-47: 46R/25D/28.5U : District Map : (R) Lee Tafanelli – First elected in 2000, Tafanelli faced a somewhat close call in 2002, winning 56%. In 2004 & 2008, he was unopposed. He served in Iraq in 2005-2006, but got back in time to defeat the youthful bluegrass musician/student Jim Faris in 2006 with 65% of the vote. He will face Faris, now an Oskaloosa city councilman (pop. 1165), local journalist and paraeducator, again in 2010. It should be a closer race, now that the warm glow of military service has dissipated more fully from Tafanelli and Faris has some local political credibility. Also, Faris plays the upright bass in his family’s mildly successful bluegrass band, which is kinda awesome. And he’s a newlywed and expecting a baby this month, actually. Awww…  Rating: Likely Republican  

State Rep. Scott Schwab, Jerk-offKS-HR-49: 48R/21.5D/30U : District Map : (R) Scott Schwab – Aside from practicing his shiiteating grin, Schwab enjoys trying to throttle more representative democracy in its cradle. I first heard of incorrigible douchebag Schwab when he introduced legislation just after the 2008 cycle that became known as the “Sean Tevis Bill”. After Sean Tevis raised $108k from small donors in 2008, Schwab introduced a bill requiring donations under $50 have the same disclosure requirements as big donations–but only if the candidate got a lot of them. Tevis fought back, and with the Internet’s help, the bill got put on ice and Schwab crawled back under a rock. So if you like Sean Tevis–and I know you do because you’re on the Internet right now–consider a donation to Schwab’s opponent, the awesomely-named Keith Mace. Mace was an IT guy and a telecoms expert for the General Services Administration, even serving as Acting Director for the GSA FAST Program (fast acquisition of tech, basically). Also, Mace has a fine, upstanding mustache. Plus, Schwab only got 59% against a non-entity-type opponent in 2008, and uber-conservative Ben Hodge only got 55% here in 2006 (Hodge replaced Schwab when Schwab ran for Dennis Moore’s seat in 2006–and couldn’t even get past the primary). Keith Mace’s website: http://keith4kansas.com/   Rating: Lean Republican

KS-HR-52:  48.6R/27D/24U :  District Map : (R) Lana Gordon – Kyle Kessler is a reasonably strong opponent (he’d been mentioned as a possible candidate in the post-Laura Kelly days in KS-02 to take on Lynn Jenkins). Unfortunately, this district is probably too red for him to win, especially over the popular and fairly moderate Lana Gordon, who has regularly won with 70%+ of the vote since elected in 2000.  Rating: Likely Republican

KS-HR-54: 45R/30D/24U :  District Map : (R) Joe Patton – As he has since winning election in 2006 with 51.5% of the vote (he nabbed 57% in ’08), Patton will face a race this year, this time thanks to 26-year-old teacher Scott Seel (who needs to fill in some of the pages of his otherwise-nice website, www.seelforkansas.com) Topeka voters are notorious for dumping useless Republican incumbents (see: Ryun, Jim) and Patton has not been terribly impressive. Rating: Lean Republican

KS-HR-59: 47R/24D/28U: District Map : (R) William Prescott – Freshman Prescott, a former Osage County Commissioner, is running for a second term after winning his first with 54.3% of the vote. In 2006, Democrat Jim Irey held the then-incumbent to just 51.2%, prompting his retirement. Irey lost the 2008 follow-up race to Prescott. This year, Prescott will face the weaker Blossom Barth, who appears to be doing little in the way of campaigning. Rating: Likely Republican

KS-HR-60: 38.6R/29D/32U :  District Map :  (R) Don Hill –  Elected in 2002, the relatively popular and moderate (pro-choice and led the pro-school Republicans) Hill wasn’t even challenged by Democrats in 2008, despite the increasingly blue tint of his district. This cycle, Hill has a serious opponent in Mike Dorcey, who lost the County Clerk race in 2008, but at least has electoral experience. Additionally, Dorcey is Community Relations Director of the Emporia Unified School District, giving him education bonafides in a cycle where that’s a hot topic. Overall, Hill’s moderate profile should keep him safe. Rating: Likely Republican

State Rep. Steve LukertKS-HR-62: 53R/24D/22.6U : District Map : (D) Steve Lukert – A former Republican, Lukert lost a state Senate race in 2004, switched parties, and won his KS House seat in 2006 with 53% of the vote, and won re-election with 57%, despite the heavy Republican tilt of the district, making him Kansas’ answer to Chet Edwards. He will face Randy Garber, a Navy vet, heating/cooling specialist, and pastor of Trinity Church of the Brethren. Despite the partisan lean of the district, Garber seems a wee bit….hmm, how to say this in a nice Kansas way? Garber’s a few sandwiches short of a picnic. And that’s all I’m gonna say. Rating: Likely Democrat

KS-HR-65: 38R/33D/28U : District Map :  (R/Open) Incumbent Barbara “Barbie” Craft is retiring, leaving her Junction City seat open. Geary County Commissioner Larry Hicks is in the running for the Democrats, while Republicans had a Junction City Commissioner running, and passed him up for a guy named James Fawcett. With an open seat, a moderate, responsible already-elected official is exactly the sort of politician Kansans like to send to Topeka. Plus, popular Gov. Parkinson held a fundraiser for Hicks two weeks ago, so KS Dems are obviously pretty high on his chances. Even better, the Republican Craft showed up to that fundraiser and praised Hicks, although she’s technically supporting the Republican Fawcett. Link for that story. Rating: Lean Democrat

KS-HR-67: 47R/24.6D/28U : District Map : (D) Tom Hawk is a former Manhattan (KS) school superintendent and is going for his fourth term, after winning his third with 56%. It’s a tough district but the adamantly pro-education Hawk fits in well here. His opponent is opthamologist Dr. Susan Mosier, who would be a strong candidate thanks to her civic involvement, if it weren’t for her right-wing flirtations. Still, Republicans are high on her chances and the district is pretty tough.  Rating: Lean Democrat

Gerrett Morris, the new Deena Horst?KS-HR-69: 40R/25D/34U  : District Map :  (R/Open) The teabaggers strike! Elected in 1994, incumbent Deena Horst is a retired art teacher and frankly, she does seem like the nicest person ever, and I say that as someone disinclined to like Republicans–but she lost her primary to teabagging Salina City Commissioner Tom Arpke.  Meanwhile, Team Blue has an attractive young fellow named Gerrett Morris (at left), who, according to his campaign website is “serving as Chairman of both the Saline County Young Democrats and the Salina Tree Advisory Board.” Hear that, Arpke! Tree Advisory Board (this actually is important in central KS where there aren’t a lot of trees, btw). Who would you rather District 69 with now, eh Salina voters? Rating: Tossup

Horst Vs. Arpke – Salina Journal

KS-HR-71: 46.5R/23.5D/29U : District Map :  (R) Charles Roth survived a double teabagging in the Republican primary, and his moderate reputation will serve him well in the general election. In his two previous runs since his 2005 appointment, he scored 59.4% (2006) and 62.6% (2008). Still, Democrats have a credible opponent in Salina School Board member and Dean of Academic Affairs at Brown Mackie College Phil Black. Roth’s moderate reputation should be enough. Rating: Likely Republican

KS-HR-72: 45R/27D/28U :  District Map :  (R) Amy Schumacher faces off against incumbent Mark Rhoades, who won in 2008 by just 40 votes (after a similarly-skimpy win to defeat an incumbent Democrat in 2006), among the closest margins in the state. She’ll be helped by a new local campaign office and the strong Goyle campaign. Schumacher is definitely a-runnin’ and getting good local press: Source  Rating: Tossup

KS-HR-75: 46R/26D/27.4U : District Map :  (R) John Grange is in the hunt for a fourth term after winning his previous ones with around 54-55% of the vote. He’ll face Glenda Reynolds, whose husband is the vice-chair of the Butler County Democrats. She’s a solid candidate, with good community links, a solid website (http://www.reynolds4house.com/), a smart platform (ending tax breaks for non-KS companies, citing specific examples) and a lovely family. Grange is certainly favored, but Reynolds will make it a race, thanks to both institutional support from local Dems and being named after the good witch from The Wizard of Oz. Rating: Lean Republican

KS-HR-80: 47.5R/26.6D/25.5U :  District Map : (D) Vincent Wetta – Wetta, a retired railroad engineer, won in 2006 with 57% of the vote over incumbent Bill McCreary, went unchallenged in 2008, and faces the little-known Ellen Hathaway in 2010. Rating: Likely Democrat

Join me next week for the final installment of this series along with a final tally of seat projections and more insight into Kansas politics.

KS: Complete Kansas State Legislative Race Ratings 2010, Districts 1-40

One of the things I like best about SSP is finding out about interesting downballot races that would otherwise escape my notice. So in that spirit, I’ve put together a massively comprehensive guide to the state races in Kansas in 2010.

Where art thou, Sean Tevis?Wherefore art thou, Sean Tevis, oh star of the 2008 KS State House races?

While Kansas isn’t exactly high on anyone’s radar for this election cycle, there are plenty of competitive races (KS-03 & KS-04, plus nearly all the statewide offices this year) throughout the state. Join me, won’t you, for a look at what’s happening downballot in the Kansas state Legislature?

But before we get into an analysis of the various districts in play this cycle, there are a few things to keep in mind…one is that this diary wasn’t meant to be published so soon. It was also way too long, so I was going to publish it in parts, but I hadn’t decided on what those parts were. Apparently, I’ll be doing it in thirds, since I just did seats 1-40, the competitive ones, at any rate.

In 2010, only Kansas House of Representatives seats are up, with the exception of …

STATE SENATE:

KS-StSen-07: Moderate state Sen. David Wysong resigned, leading Republicans to choose state Rep. Terrie Huntington as his replacement. With a fairly moderate profile, she must now fend off challenges from the left and right in the only Senate seat being contested this cycle (the full Senate, including this seat, is up in 2012). Republican David Harvey is coming at her from the right, but she survived (barely) with 54% in the primary. Democrat Wayne E. Hodges awaits in the general. Possessing a master’s in public administration, Hodges is an adjunct professor at Park University and a sometime writer/reporter. We could do a lot worse, although Hodges starts at a distinct disadvantage over a battle-tested moderate Republican. Hodges bio

In 2004, Wysong won with 56% of the vote, and was re-elected with 54% in 2008. So it’s not a totally unwinnable district. If Hodges can’t win it in 2010, I’m betting state Rep. Mike Slattery (KS-HR-24) might try to move up in 2012. Of course, even if Hodges wins, Republicans will still dominate the upper chamber 30-10. Rating: Likely Republican

With that little appetizer out of the way, let’s get to the main course of this feast of local political analysis…

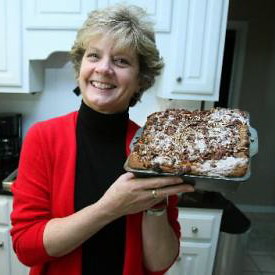
Stephene MooreDemocratic nominee Stephene Moore wields the power of delicious baked goods in her quest for KS-03.

KANSAS HOUSE OF REPRESENTATIVES – 125 seats

Current composition: 76 Republicans, 49 Democrats (or about 61%-39%)

HOW TO READ THE COMPETITIVE SEAT LISTINGS:

KS-HR-# <—this is the district’s number

43.5R/27D/28.6U   <—this is the voter affiliation breakdown, R is Republican, D is for Democrat, and U is unaffiliated voters. Statewide, as of June 2010, the state’s registration numbers were 43.5% Republican, 27.2% Democrat, and 28.6% Unaffiliated.  Out of the roughly 1.7 million registered voters, there are also about 10,000 registered Libertarians, along with 1,169 members of the Reform Party. Also, unless the tenth of a percent is a 4, 5 or 6, I rounded to the nearest full percentage point in most cases.

District Map    <—-this is the official map from the Legislature’s website KSLegislature.org.

MAIN SOURCES:

Candidate Guide + District PVIs from Capitol Strategies LLC [pdf]

Guide to every KS House seat’s past voting from OurCampaigns.com

Candidate Fundraising from Ethics.ks.gov

Before we start, I’d meant to put something in about how off-year elections are actually the better ones for KS Democrats. A smaller electorate is generally a more moderate and better-informed one in Kansas. Sure, the teabaggers may be out in force, but that’s nothing new in Kansas. And Democrats, as you’ll see, have a lot of competitive candidates up and down the ballot, not only Stephene Moore & Raj Goyle for Congress, not only the best statewide slate we’ve had in a long while (Holland, Kultala, Six, McKinney & Biggs), but even in many state legislative races, Democrats are now fielding pretty solid candidates who can compete and possibly win. So below, find the first chunk of contested districts, all the ones I’ve ranked as competitive that number between 1 & 40.

Among these, there are some that are either totally safe (thanks to PVI heavily favoring one party) or uncontested completely. In districts 1-40, those seats are:

Uncontested Democrats: 05, 08, 32, 33, 34, 37

Safe Dem:  01, 02, 03, 31, 35, 36

Uncontested or intraparty-only Republicans: 06, 07, 09, 11, 13 26, 27, 30

Safe Republican:  12, 21

Geographically, seats 1-40 are centered on the eastern edge of the state, hence the seemingly high quantity of competitive seats. (generally speaking, KS gets more conservative as you go West). Most of the competitive ones below are in suburban Johnson County, which has been going from rosy red to quite purple rather quickly. The exceptions in competitive seats in 1-40 are the rural, Fort Scott-based 4th, the 10th, which takes in the suburban/exurban/rural areas south of Lawrence, and the Fort Leavenworth-based 40th. The two Fort districts border Missouri, and Lawrence is just one county over from the state line (via Johnson or Wyandotte, aka-the Dot) from the state line.  

COMPETITIVE SEAT LISTINGS:

State Rep. Shirley PalmerKS-HR-04: 46R/27.4D/26U : District Map : (D) Shirley Palmer (good name, good pic at left) defeated incumbent Lynne Oharah (a man, surprisingly) in 2006 in this Fort Scott-centric district with 51.3% of the vote and won again in 2008 with 53% in a rematch. This year, she’ll face a new opponent in Caryn Tyson, whose father-in-law was a local state Senator and a woman with deep local ties. Tyson’s website, at least, is a careful balance–conservative but not too conservative. She’ll be a tough opponent, but Palmer’s been a solid representative, has excellent education credentials and her local ties are just as strong.  Rating: Lean Democrat

KS-HR-10: 37R/29D/33U : District Map : (D) Tony Brown –  Brown will face off against Terri Lois Gregory, who’s coming off a strong primary victory. Frankly, Gregory is a rather creepy lady staffer for state Rep. Mike Kiegerl (KS-HR-43) and a fairly hardcore conservative. Brown was elected in 2008 with just 49% of the vote (a Libertarian took 5% and the Republican got 45%). Interestingly, this is Dem gubernatorial nominee Tom Holland’s old legislative district, which I would expect to yield a big enough boost for Brown that he’ll pass the 50% mark this time, in addition to the sophomore swing and going up against a hardcore right-winger.  Rating: Lean Democrat

KS-HR-14: 43R/25D/31U : District Map : (R) Incumbent Lance Kinzer faces off against Elliott Lahn, a city planner for nearby Merriam. Kinzer’s gotten around 60% in his previous races, but Lahn’s got a good website, raised some money, and has snagged a few endorsements. Kinzer doesn’t have quite the conservative stink of other members of the JoCo delegation, but he also hasn’t faced very many competitive opponents. Rating: Lean Republican

Arlen Siegfreid, Dressed in Silver & FlamingKS-HR-15: 43R/24D/32U : District Map  : (R) Arlen Siegfreid – Archconservative Siegfreid, now Speaker Pro Tem (2nd in command of KS House Republicans), has essentially become too conservative for this district, which was once staunchly conservative. In 2002, Siegfried won the newly-formed seat with 60% of the vote, but it has blued rapidly, with Siegfried’s vote share declining steadily to a narrow 52-48% victory over Sean Tevis in 2008 (McCain got 60% here). If Sean Tevis were running here again, I’d rate it a Tossup, but I’m doubting the website-less and rather invisible Wright will do as well as Tevis. Look for Siegfried to use his influence to draw himself a redder seat after redistricting, or perhaps one in the state Senate. Rating: Likely Republican

KS-HR-16: 46R/25D/28U : District Map  : (D) Gene Rardin – Elected in 2006 by a hair after the moderate Republican incumbent went down in the primary, Rardin has survived two very close calls with less than 51% of the vote. This cycle, Rardin again faces a very conservative opponent in teabagger Amanda Grosserode, which should allow him to squeak to another term, despite representing one of the most heavily Republican districts in the county.  Rating: Tossup

State Rep. Jill Quigley, Republocrat?KS-HR-17: 46.5R/24D/28.5U : District Map  : (Open/R) Jill Quigley – The moderate Quigley faced a primary against teabagger Kelly Meigs as she tried to win her second full term after being appointed in 2007, but Meigs won 53-47 amid a decent turnout (for a primary). A moderate Republican can easily hold this seat–Quigley nabbed about 62% in her first try against modest opposition–but an anti-school teabagger would be considered a prime target. Waiting to swoop in and pick up the seat is Democrat Bryan Cox….now here’s where it gets interesting. Conservative blogs KansasProgress.com (intentional irony alert!) and KawandBorder.net are reporting that Cox is considering stepping aside and letting Quigley have his place on the ballot. She’d switch parties, of course, and run as a Democrat. Also, the $16k left in her campaign account would become useable again, an upgrade on Cox’s $200 haul. Why would Cox step aside? Well, he might if he’s the Bryan Cox that’s a high-level Democratic Party operative who’s now running Lisa Johnston’s Senate campaign and was recently (still?) the Riley County Field Coordinator. Once Cox bails, the 8 local precinct committee(wo)men choose a replacement–perhaps now-Democrat Jill Quigley? Stay tuned folks, because if Quigley switches sides, this will instantly become one of the hottest races around and a great pickup opportunity.

Rating: Tossup, for the sheer insanity of it all…. it’s Lean D with Quigley as a D, Lean or Likely Republican if it’s Meigs Vs. Cox

KS-HR-18: 44.6R/27D/27.8U : District Map : (D) Cindy Neighbor – Interesting career. First elected in 2002 to this seat as a moderate Republican, she lost the Republican primary in 2004, then returned to win the seat as a Democrat in 2006 with less than 50% of the vote, and got re-elected in 2008 with 52.5% of the vote against Republican John Rubin, an Army JAG officer who is back again in 2010. Rating: Lean Democrat

KS-HR-19: 43.6R/25.3D/30.5U : District Map : (D) Dolores Furtado – A former Johnson County Commissioner, she won this seat in 2008 with 51% of the vote, and faces a strong challenge from Jim Denning, the CEO of Discover Vision Centers, who won his primary with a convincing 77%. But Furtado’s a tough old bird and she’s not going down without a fight. Rating: Tossup

Rob Bruchman, Yoder Odor?KS-HR-20: 49R/24D/27U : District Map : (Open/R/Kevin Yoder) – The district where I was raised for 15 years. A swingier-than-it-looks surburban Overland Park seat whose Republicans are heavily moderate, being vacated by former moderate Kevin Yoder. Yoder protege Rob Bruchman won a stunning 70% victory in the primary against Stephanie Sawyer Clayton, who, despite Yoder’s supposed moderate reputation, ran to Bruchman’s left, favoring opening up liquor sales, keeping abortion legal, and not hating immigrants. With Bruchman squarely in the conservative camp, Dems do have a chance, especially because the candidate for the Ds is Rob McKnight, apparently (I couldn’t confirm this) a former GOP consultant turned Democrat and longtime local resident. He’s been a good fundraiser (including some notable local moderate Republican names) and scoring good endorsements, as well. McKnight is actively campaigning and has a website that, smartly, appeals to a sense of neighborliness against the carpetbagging Bruchman: Kansas20.org. Rating: Lean Republican

KS-HR-22: 34.6R/32D/32.5U : District Map : (D) Lisa Benlon –   Another former Republican state representative, Benlon returned to politics in 2008 as a Democrat, winning 53% to succeed Democrat Sue Storm, who rose to a seat on the state Board of Education. Benlon did draw a fairly strong opponent in Greg Smith, the father of the late Kelsey Smith. Still, the district’s blue tint, and Smith’s super-conservative profile, should be enough to save Benlon. Rating: Lean Democrat

KS-HR-23: 33.5R/32.2D/33.5U : District Map : (D) Milack Talia – After running twice before (once for a different state rep seat, the 29th), Talia captured 56% of the vote in his 2008 race. Helpfully for his electoral chances, he’ll defend the seat against “Conservative Constitutionalist”/teabagger Michael Foltz. Rating: Likely Democrat

KS-HR-24: 36R/32D/31.5U : District Map : (D) Mike Slattery – The scion of the apparent Slattery Democratic dynasty-in-the-making, Slattery scored a narrow Democratic primary victory in 2008 for one of the most Dem-leaning seats in the county, then went on to win the general fairly handily. Since only Talia’s and Benlon’s districts are more Democratic in Johnson County, Slattery stands a good chance of being re-elected. Rating: Likely Democrat

KS-HR-25: 45.5R/27D/26.6U : District Map : (R) Open/Barbara Bollier – Appointed to fill Terrie Huntington’s seat by local Republicans, this will be retired anathesiologist Barbara Bollier’s first race. Huntington got 57% in 2002 to win the seat, 56.5% in 2004, just 54.5% in 2006, and rebounded to 61% against a weak opponent in 2008. Bollier will face off against Shana Althouse, who is actively campaigning, quotes Gov. Sebelius, and is all about education–a good profile for this district.  Her website is good, too: www.shanaalthouse.com   Rating: Lean Republican

KS-HR-28: 57R/18D/24.5U : District Map : (R) Pat Colloton, generally identified as a moderate, is used to cruising to re-election, having no opponents in ’04 and ’06 and taking 75% against a token opponent in 2008. She’ll face the somewhat stronger Elise Chapline in 2010, who has self-funded $7k thus far, but I doubt Colloton’s sweating it much in her dark red seat. Rating: Likely Republican

KS-HR-29: 48.6R/21D/29.5U : District Map : (R) Sheryl Spalding – Two-term incumbent Spalding survived a right-flank primary challenge by 29 votes from the teabaggy Richard Downing and will face Democrat Doug Dowell (good name) in the general. Having survived her primary, the moderate Spalding will probably survive with solid numbers.  Rating: Likely Republican

State Rep. Arlen SiegfreidThe shadow of Siegfreid looms large across Olathe.

KS-HR-38: 45R/23.4D/31U : District Map : (R) Anthony Brown was elected in 2004 after wining the Republican primary (no Democrat filed that year). In 2006, he took 56% of the vote and in ’08 nabbed 57%. Brown is now fully identified with the conservative faction in the legislature, and faces off against JCCC professor and psychologist Roberta Eveslage, This fast-growing district contains the northwesternmost edges of Johnson County along with Eudora & the fringes of Lawrence in Douglas County. While Brown is from conservative Eudora, Eveslage is from moderate Lenexa. The battleground is booming DeSoto, where well-to-do parents are concerned about school funding battles because they need to expand their schools pretty rapidly to handle the population influx. Eveslage’s laser-like focus on the issue is smart, her website is decent (http://robertaforkansas.com/) and she’s actively campaigning. Rating: Lean Republican

KS-HR-39: 42R/26D/31.4U : District Map : (R) Owen Donohoe – Elected in 2006, Donohoe has proven to be a staunch conservative, not a great fit for this moderate district, as evinced by his weak victories, 52.3% in ’06 and 51.3% in ’08. Donohoe’s up against retired school principal Joe Novak, who ran in ’08 and nearly won. Now that he’s so clearly identified with conservatives, Donohoe is going to bleed moderate Republicans, probably enough to let Novak eke out a victory this time around. He’s also BFFs with Kansas’ worst legislator, Connie O’Brien, so he obviously sucks.  Rating: Tossup

KS-HR-40: 32R/35D/31.6U : District Map : (D) Melanie Meier – Our candidate here is awesome and profile-wise, fits her Fort Leavenworth-based district like a glove. Raised in a military family that eventually settled in Leavenworth, Melanie Meier was elected in 2008 (with 56%) but resigned her post to serve in Iraq. When she returned, KS Dems reappointed her to the seat she’d won. Active in her community, her husband’s also in the military, and she’s a Catholic, so it’s tough to imagine a better candidate for this district. She’d be an excellent candidate for higher office, too, perhaps the state Senate or even Congress against Lynn Jenkins. Rating: Likely Democrat

Next up, seats 40-80, including central and eastern Kansas (basically everything from Lawrence to Salina along I-70), some suburban Wichita seats, still a few more Johnson County seats, plus the Chet Edwards(es) of Kansas. Click here to read about the next 40 seats.

Photo credit for potentially the best photo ever of Arlen Siegfreid: the Olathe Republican Party.

Redistricting the Maryland General Assembly (Dem Gerrymander)

So yeah, I’ve been working on a map of the state legislature for a while. I had one ready months ago, but there were a few things I hated about it, so I didn’t post it. I finally came up with something that satisfies me about 80-90%.

My goals were as follows:

– As many Democrats as possible, with a focus on protecting incumbent Democrats.

-Make the Dem districts as liberal as possible to aid in getting some real liberal legislation through.

– As few county-crossings as possible, to avoid a potential court challenge. I also tried to be mindful of municipal and cultural boundaries, although in Maryland it’s really the counties that people focus on.

– The same or more majority-black districts.

So, without further ado, here we go.

Uploaded with ImageShack.us

Uploaded with ImageShack.us

Uploaded with ImageShack.us

Uploaded with ImageShack.us

Uploaded with ImageShack.us

Uploaded with ImageShack.us

Uploaded with ImageShack.us

District 1: Western Maryland: Garrett, Allegany, and Washington (part) Counties

New district: 93% white, 33% Obama (current 32% Obama)

1A – all of Garrett, part of Allegany: 98% white, 28% Obama (current 27% Obama)

1B – part of allegany: 89% white, 41% Obama (current 34% Obama)

1C – part of Allegany, part of Washington: 93% white, 34% Obama (current 36% Obama)

Current 1C was drawn to help former speaker Casper R. Taylor, but now that he’s gone we should put all of our effort into helping Kevin Kelly by tying Cumberland and Frostburg together.

District 2: Washington County

New district: 83% white, 44% Obama (current 44% Obama)

2A – Hagerstown periphery: 84% white, 42% Obama (current 39% Obama)

2B – Southern and Eastern Washington County: 84% white, 38% Obama (current 40% Obama)

2C – Hagerstown: 79% white, 57% Obama (current 55% Obama)

2A and 2C get more Democratic, maybe someday the Senate district and 2A could be within reach.

District 3: Frederick County (including city of Frederick)

New district: 70% white, 56% Obama (current 54% Obama)

I got rid of the subdistricts in order to consolidate Democratic support within the district. A Republican or 2 could possibly slip by for the time being, but by 2020 this should be firm Dem territory.

District 4: Frederick, Carroll, and Washington Counties (only a small part of Washington County)

New district: 92% white, 36% Obama (current 37% Obama)

4A – Frederick County (small part of Washington County) – 2 delegates – 92% white, 38% Obama (current 39% Obama)

4B – Carroll County (small part of Frederick County) – 1 delegate – 93% white, 32% Obama (current 33% Obama)

District 5: Carroll County

New district: 91% white, 33% Obama (current 33% Obama)

I moved the district completely into Carroll County (to make it more compact and to give Carroll County a whole district to call its own). Got rid of subdistricts, since Carroll County is pretty uniform, so they’d be pointless.

District 6: Baltimore County (southeastern)

New district: 79% white, 43%-46% Obama (somewhere in that range) (current 45% Obama)

This one I struggled with a lot. I ultimately decided to just keep it somewhat as is for a number of reasons. First, this district is blue-collar, and even making it 60% Obama would still give people that impression, so the reps are not likely to be liberals no matter what (and it’s thus better to shore up some surrounding districts). Second, the Republican bench is weak as hell here, and the district votes as much as 70-80% for local Democrats, so I still like our chances here. Third, this was where Glendenning’s plan was shot down in 2002, so I don’t want to mess with this district much. Fourth, adding a large part of the city could potentially mean the Dem nominee (or nominees) would be African-American, which could potentially lead to a loss in this district even if you make it 55-60% Obama-supporting. Thus, it’s better to just leave sort of as-is and just write it off if necessary.

District 7 – Baltimore and Carroll Counties

New district: 90% white, 35% Obama (current 39%)

Basically a combination of the old 7 and the old 5B.

District 8 – Baltimore County and Baltimore City

New district: 59% white, 71% Obama (current 48% Obama)

Finally, a real Baltimore liberal district. Todd Schuler currently represents the 8th (which voted for McCain), and he’s the only delegate in the Baltimore area who openly supports gay marriage. He’s not running for reelection, but he could def have his old seat back if he wants it.

District 9 – Howard County (eastern)

New district: 64% white, 61% Obama (current 43% Obama)

Completely moved from one side of Howard to another. Should add 3 new Dem delegates and one new Dem senator to the caucus, and even if not right away, Republicans will always be on defense here.

District 10 – West Baltimore County

New District: 53% black, 74% Obama (current 87% Obama)

I don’t like how the current district packs black votes (this may be a remnant of an earlier time when this was necessary), so I made a district that the current representatives would be very happy with, as it does not endanger them in any way and it gives black voters more of a voice in surrounding districts.

District 11: West and North Baltimore County

New District: 62% white, 64% Obama (current 66% Obama)

Similar to before, but covering a larger territory to make District 42 more Democratic

District 12: Southwest Baltimore County

New district: 58% white, 61% Obama (current 58% Obama)

No more swingy subdistricts, no more awkward gerrymandering for no reason. District is now more Democratic and completely within one county.

District 13: Howard and Montgomery Counties

New District: 64% white, 60% Obama (current 65% Obama)

Dem support here is growing, and all the incumbents can run here again, so no fears about the drop in performance.

District 14: Montgomery County (east)

New District: 58% white, 65% Obama (current 65% Obama)

District 15: Montgomery County (west)

New District: 68% white, 65% Obama (current 65% Obama)

District 16: Montgomery County (south central)

New district: 43% white, 74% Obama (current 76% Obama)

District 17: Montgomery County (Gaithersburg-Rockville)

New District: 48% white, 71% Obama (current 71% Obama)

District 18: Montgomery County (Bethesda)

New District: 78% white, 74% Obama (current 76% Obama)

District 19: Montgomery County (Olney)

New district: 52% white, 68% Obama (current 68% Obama)

District 20: Montgomery County (Silver Spring)

New district: 32% white, 85% Obama (current 85% Obama)

District 21: Prince George’s County (Laurel-College Park)

New district: 34% black, 78% Obama (current 75% Obama)

No longer stretches into Anne Arundel County. I wanted to make it majority-black, but it’s actually somewhat difficult to get all majority-black districts out of north PG without making the lines too crazy. However, since the district is not currently majority-black, I didn’t worry about it.

District 22 Prince George’s County (Greenbelt-Hyattsville)

New District: 53% black, 88% Obama (current 85% Obama)

District becomes majority-black, as it is not currently.

District 23 Prince George’s County (Bowie)

New district: 58% black, 83% Obama (current 81% Obama)

District is only barely majority-black now, so I made it moreso. Got rid of subdistricts because I don’t know what the point of them was.

District 24 Prince George’s County (Greater Upper Marlboro) and Anne Arundel County (southern rural parts)

New district: 55% black, 72% Obama (current 98% Obama)

I wanted to break up Southern PG County some because it was just insanely packed with black voters. In exchange for making this district less black, 22 is now majority black, and 47 and 23 are more black, so I don’t see how anyone could sue.

District 25 Prince George’s County (Capitol Heights, District Heights)

New District: 83% black, 96% Obama (current 96% Obama)

Did not want to pack this much, but had to.

District 26 Prince George’s County (National Harbor)

New District: 79% black, 93% Obama (current 94% Obama)

District 27 Prince Georges County (Upper Marlboro) and Calvert County

New district: 66% white, 62% Obama (current 71% Obama)

Got rid of sub-districts, took in all of Calvert county instead of just part.

District 28 Charles County (most)

New District: 53% white, 63% Obama (current 63% Obama)

District 29 St. Mary’s County and Charles County (part)

New district: 73% white, 47% Obama (current 44% Obama)

29A – Central and Northern St. Mary’s – 85% white, 39% Obama (current 39% Obama)

29B – Southern St. Mary’s County – 67% white, 48% Obama (current 47% Obama)

29C – West St. Mary’s and part of Charles – 68% white, 53% Obama (current 45% Obama)

No more Calvert County; both current Dem districts get some shoring up.

District 30: Anne Arundel County (Annapolis)

New district: 73% white, 55% Obama (current 52% Obama)

A little more Dem, but stays similar in shape.

District 31: Anne Arundel County (Glen Burnie)

New District: 60% white, 60% Obama (current 40% Obama)

Time for a bonafide liberal district out of AA County.

District 32 Anne Arundel County (Ft. Meade) and Howard County (North Laurel)

New district: 59% white, 62% Obama (current 54% Obama)

Yet another AA County liberal district, with help from Howard of course. Between 31 and 32 there’s more than enough love to go around between incumbent Dems.

District 33 Anne Arundel County (Severna Park)

New District: 87% white, 37% Obama (current 43% Obama)

Loses Dem areas and just becomes one big Rep vote sponge in north AA County. No more subdistricts.

District 34 Cecil and Harford Counties

New district: 88% white, 40% Obama (currently 48% Obama)

34A 1 delegate – Harford County – 86% white, 38% Obama (current 55% Obama)

34B 2 delegates – Cecil County – 89% white, 41% Obama (current 37% Obama)

I wanted liberal districts, so I had to throw this one to the wolves to make 46 more than just a swing district. It was bound to happen anyway though, as conservative Harford and Cecil Counties have had high growth and deserve an extra Rep district, plus the senator is already a Republican, so no big deal. I realigned the subdistricts so that Cecil gets 2 delegates and Harford gets 1 (due to population growth in Cecil). I decided not to divide Cecil further because Del. David Rudolph lives in Rising Sun, which is extremely conservative, so if anything keeping Elkton and Rising Sun together will only help him out (in fact, I moved his district 4 points more Democratic while the district moved 8 points more Republican – amazing).

District 35 Harford County (Bel Air)

New district: 92% white, 30% Obama (current 31%)

Damn, now thaaat’s conservative. Only subdistrict 1A is more conservative. No more subdistricts – they’re unnecessary.

District 36 Cecil, Kent, Queen Anne’s, and Caroline Counties.

New district: 89% white, 39% Obama (currently 41%)

36A – Cecil and Kent Counties – 86% white, 46% Obama

36B – Caroline and Queen Anne’s Counties – 81% white, 36% Obama

36C – Queen Anne’s County – 88% white, 35% Obama

Split into subdistricts because having one huge district doesn’t serve anybody. Plus, that Kent district could elect a Democrat possibly.

District 37: Talbot, Dorchester, part of Somerset, and part of Wicomico (Salisbury) Counties.

New district: 63% white, 49% Obama (currently 46% Obama)

37A – one delegate – Somerset and Wicomico – 50% black, 64% Obama (currently 65% Obama)

37B – two delegates – Somerset, Wicomico, Dorchester, and Talbot – 73% white, 45% Obama (currently 39%)

Yes it does split an extra county, Somerset, but this should be allowed, as it makes creating a majority-black district much easier, splitting fewer towns in the process. Also worth noting is that the subdistrict and senate district as a whole are now potentially winnable.

District 38: Somerset (part), Wicomico (part), and Worcester Counties

New district: 81% white, 40% Obama (currently 41% Obama)

38A – 1 delegate – Somerset and Wicomico – 82% white, 36% Obama (currently 45% Obama)

38B – 2 delegates – Somerset, Wicomico, and Worcester – 80% white, 43% Obama (currently 41% Obama)

This Senate district is sacrificed forever, but the 2 Dems in 38B get a district that’s 2 points safer. 38A becomes a wasteland.

District 39: Montgomery and Frederick Counties (Germantown-Urbana)

New district: 64% white, 63% Obama (currently 71% Obama)

Becomes less Democratic, and goes into Frederick County to pick up some high-growth areas (so as to not waste Dem votes). Remains safe Dem.

District 40: Baltimore City (Northwest)

New district: 64% black, 87% Obama (currently 93% Obama)

District 41: Baltimore City (Western)

New district: 65% black, 90% Obama (currently 87% Obama)

District 42: Baltimore County (Towson-Pikesville)

New District: 68% white, 60% Obama (currently 53% Obama)

Made the district more liberal by grabbing territory to the West. This district sorta hugs the inner beltway.

District 43: Baltimore City (central and Inner Harbor)

New district: 64% black, 86% Obama (currently 91% Obama)

District 44: Baltimore City and Anne Arundel County

New district: 55% black, 70% Obama (currently 92% Obama)

Yeah I have 2 districts that cross the city line, but both are justifiable due to population shifts. At 55% black (and with most Anne Arundel residents registered Republican) the district should be fine for the incumbents.

District 45: Baltimore City (Southeast)

New district: 59% black, 85% Obama (currently 90% Obama)

District 46: Harford County (Edgewood-Aberdeen) and Baltimore County (Middle River-Rossville)

New district: 65% white, 56% Obama (currently 72% Obama in Baltimore City)

This district of course had to be completely moved out of Baltimore City (this may be the last time the city loses a district, as growth is rebounding). Since Harford County has seen so much growth, I dare anyone to show me where it would make more sense for this district to go. Since District 8 has a good margin now, I decided to have the district head towards Rossville to pick up some liberal areas there that would be in 8. That brings the total up to 56% Obama, which should be safe for the 2 incumbents in 34A, plus a new Dem Delegate and a new Dem Senator. As an aside, I do not believe the district was majority black when in the city (as the Obama % is so low and it takes in many majority-white areas), so I don’t think there will be any trouble with VRA.

District 47 Prince George’s County (Cheverly-Glenarden)

New district: 61% black, 93% Obama (currently 92% Obama)

Was only like, 51% black, but the black percentage is shored up to prevent any ruckus over lowered (but still safe) black percentages elsewhere. Was going to create a plurality-hispanic district, but there would have been no point, as there are not enough registered Hispanic voters to make a difference.

So yeah, that’s it, the final breakdown is:

Obama over 60%:  94 Delegates 31 Senators

Obama 55-60%:     10 Delegates  3 Senators

Obama 50-55%:      1 Delegates  0 Senators

Obama 45-50%:      4 Delegates  2 Senators

Obama 40-45%:      9 Delegates  4 Senators

Obama under 40%: 23 Delegates  7 Senators

Obama won in 74% of the delegate seats (66% with over 60%) and 72% of Senate seats (65% with over 60%)

Let me know what you all think.

High-profile showdown coming in Iowa Senate district 37

Next year’s campaign in Iowa Senate district 37 will be closely watched statewide and may draw some national attention. Republican State Representative Kent Sorenson has decided to challenge first-term Senator Staci Appel instead of seeking re-election to Iowa House district 74. The socially conservative Sorenson made a splash this summer with his open letter imploring Senator Chuck Grassley to provide “principled and bold leadership” to advance the Republican Party platform. Appel is assistant Senate majority leader and chairs the State Government Committee. Her husband is one of the seven Iowa Supreme Court justices who unanimously struck down our Defense of Marriage Act in April.

Republican blogger Craig Robinson is upbeat about Sorenson’s chances.

My opinion on this matchup hasn’t changed since Robinson first discussed the prospect in May: Bring it on.

Here’s Robinson’s case for Sorenson as a strong challenger:

In 2008, Sorenson defeated State Representative Mark Davitt by 163 votes. Sorenson’s victory surprised many Republican insiders that year. Since his campaign wasn’t on their radar as a potential pick-up, Sorenson was left to himself to orchestrate a winning campaign. With the help of a dedicated volunteer base, Sorenson pulled off the upset of the night when he sent Rep. Davitt home after serving three terms in the Iowa House.

Sorenson will not be flying under the radar in his race against Staci Appel. This time around, he finds himself as one of the top recruits for Senate Republicans. Making things more intriguing is that the Sorenson-Appel match-up will be ground-zero for the gay marriage debate in Iowa. Sorenson is an unabashed supporter of traditional marriage. Appel is one of the most liberal members of the Senate and is also married to one of the Iowa Supreme Court Justices who ran roughshod over Iowa’s marriage laws.

Despite raising huge amounts of money for her campaign in 2006, Appel only won her seat by 772 votes. Her opponent in 2006 was relatively unknown and underfunded. Sorenson brings a number of attributes to the race. First, Sorenson already represents half of the district. The part of the district that he already represents is the most difficult for a Republican candidate to win. Second, Sorenson has shown that he has the determination to do what’s necessary to win. While some candidates look for help from the day they are recruited, Sorenson and his crew of volunteers work tirelessly at the grassroots level.

Another factor to consider is that Sorenson and Steve Deace, the afternoon drive radio host on WHO Radio, are good friends and share a similar worldview. While many Republican candidates are hesitant to go on Deace in the Afternoon, Sorenson has embraced it. Deace will have to offer Sen. Appel air time as Election Day nears, but there is no chance she would walk into that studio and sit across the table from Deace. Sorenson’s access to WHO Radio’s listeners will help him counter the fundraising edge that many people expect Appel to have.

Appel faced a “relatively unknown and underfunded” opponent in 2006 because her strong fundraising and hard work on the ground scared Republican incumbent Doug Shull out of seeking re-election. She won by “only” 772 votes at a time when Iowa Democrats did not have the large voter registration advantage over Republicans that they now enjoy. Four years ago, Appel was a community volunteer seeking elective office for the first time. Now she chairs a Senate committee and has plenty of achievements under her belt.

I give credit to Sorenson for his narrow victory in House district 74 last November. It shocked and disappointed Iowa Democrats and prevented us from passing some important bills during this year’s legislative session. But as Robinson himself acknowledges, Sorenson is not going to be an under-the-radar challenger next year.

He now has a public record that he lacked as a first-time candidate in 2008. Sorenson was an early endorser of Bob Vander Plaats for governor. As the GOP primary unfolds, more and more Iowans will learn about Vander Plaats’ unworkable plan to halt gay marriage as well as his other wacky policy ideas. Sorenson appears to be ignorant about the separation of powers, as his clerk in the Iowa House erroneously told the Warren County recorder that she did not need to comply with the Supreme Court’s ruling on same-sex marriage.

This summer, Sorenson criticized Chuck Grassley for not being staunchly conservative enough and not flatly ruling out a compromise over health care reform. That will put him out of step with many moderates. Grassley’s approval rating has fallen this year, and the Des Moines Register’s recent statewide poll showed that “52 percent of Iowans would rather see Grassley compromise with Democrats than walk away from the [health care reform] negotiations. Thirty-nine percent would rather see him drop out of the talks than support proposals he disagrees with.”

Sorenson is willing to take his message to voters’ doorsteps, but Appel’s a hard worker with years of experience canvassing this district.

I’m not convinced that Sorenson will benefit much from WHO drive-time host Steve Deace’s assistance. Deace tends to go on the warpath against insufficiently right-wing Republicans (like John McCain), and next fall the GOP nominee for governor may be on his hit list. Deace has a big audience, but I think his blessing will only emphasize how far Sorenson is outside the Iowa mainstream.

Finally, I doubt Sorenson will get much traction against Appel on the same-sex marriage issue. The Varnum v Brien decision was unanimous; it’s not as if Justice Brent Appel cast the deciding vote on the Supreme Court. A barrage of television ads highlighting gay marriage didn’t win the day for the Republican candidate in the Iowa House district 90 special election. The Register’s recent statewide poll indicates that Iowans are not eager to vote for a constitutional amendment to overturn marriage equality. If public opinion trends in Vermont and Massachusetts are any guide, Iowans are likely to be more tolerant of same-sex marriage a year from now than they are today.

Appel will have to work hard against Sorenson, but I am confident that she will be able to bring this race home, with the help of a strong coordinated campaign by the Iowa Democratic Party.

Sorenson’s decision to run against Appel improves Democratic prospects in the Iowa House next year. Republicans have just about zero chance of taking back the majority in the Iowa Senate (where they hold only 18 of the 50 seats), but the GOP has more realistic pickup opportunities in the House (where they hold 44 seats out of 100). Sorenson has just given Democrats an excellent chance of winning back House district 74, which would make the hill steeper to climb for Republicans. Mark Davitt will decide this fall whether to run for his old House seat again. According to Bleeding Heartland user MrScarletW, Democrat Scott Ourth is running in House district 74. Here’s a short bio on Ourth.

Incidentally, State Representative Jodi Tymeson of House district 73 (the more Republican-leaning half of Senate district 37) has announced that she will not seek re-election next year either. That’s another open seat for the GOP to defend and another sign that Republicans are not confident about their chances to win back the Iowa House.

Final note for political trivia buffs: I’ll wager that Iowa Senate district 37 will be the country’s only state legislative race next year in which both major-party candidates have six children.

Share any relevant thoughts in this thread.

Early look at Competitive 2010 Michigan State Senate Races Updated

We all know how important it is that Democrats re-capture the Michigan State Senate next year.  If they take the Senate and hold the Governorship, they will have complete control over the redistricting process. Bill Ballenger, editor of Inside Michigan Politics, says “Democrats look poised to pick up at least 3 seats” next year.  To take control, we only need to win 4 Republican seats.  Democrats have not controlled the State Senate since 1982.  Below I have all 38 Senate seats listed, with the name of its Senator, the party, whether or not it will be OPEN next year, and a brief description of the district.  I also give a brief preliminary paragraph handicapping the race.  

Then I give the 2008 Presidential Result in that District. Remember that the 2008 resutl is sort of a “High Water Mark” here.  Note that I didn’t calculate the Presidential Vote for the 5 Detroit districts because this would require going precinct by precinct which would have taken days.  They are all at least 80% Obama, many are more than 90% Obama.

I then included all of the announced candidates for the races, with links to their websites or sources.  I then list potential candidates for each race, usually State Representatives or other local officeholders.  Finally, I offer a Charlie Cook style rating: Safe, Likely, Leans or Tossup.  The Senator’s name links to their website, where you can find a map of his or her district.

I realize that this is a lot of text, so for those who don’t want to read the entire thing, I added all my ratings seperately at the bottom of the diary.

Updated to include the announced Candidacies of Fmr. Rep. John Stewart (D) in the 7th (h/t Sean Fitzpatrick) and Rep. Mary Valentine (D) in the 34th.

District 1Hansen Clarke (D) OPEN Easten Detroit; Downtown

Hansen Clarke (AKA “The man who kicked Ann Coulter’s Ass”) is term limited next year.  It’s a shame, because Clark has been one of my favorite Senators, and even one of my favorite politicians.  He recently donated his hair to a nine year old burn victim http://www.myfoxdetroit.com/dp… and is a tireless advocate for under-represented and underpriveledged Americans.  

Announced Candidates:

Potential Candidates:

Coleman Young II (D), State Rep. (2006- ) 2009 Candidate for Detroit Mayor

Fred Durhal, Jr. (D)  State Rep. (2002-2003, 2008-  )

Betty Cook Scott (D) State Rep. (2004-   )

Rating: Safe Democrat

District 2 Martha G. Scott (D) OPEN North Detroit, Hamtrack, Grosse Cities.  

Martha Scott, who was one of Carolyn Cheeks Kilpatrick’s 2008 primary challengers, is term limited.

Announced Candidates:

Potential Candidates:

LaMar Lemmons (D) State Rep. (2004-  )

Bill McConico (D) State Rep. (2000-2006), 2006 Candidate

Virgil Smith (D) State Rep. (2002-2008)

Bert Johnson (D) State Rep. (2006-  )

Rating: Safe Democrat

District 3 Irma Clark-Coleman (D) OPEN Central Detroit, Dearborn

This district includes Dearborn, so there is the potential for this district to elect an Arab-American to the Senate.

Announced Candidates:

Potential Candidates:

Morris Hood, Jr. State Rep. (2002-2008)

Keith Williams (D) Wayne County Commission (2003-  )

Rating: Safe Democrat

District 4 Buzz Thomas (D) OPEN North and Central Detroit

Another very good legislator who is term limited this year, although I’m keeping my fingers crossed that John Conyers will retire so that Thomas can replace him in Congress.

Announced Candidates:

Potential Candidates:

George Cushingberry (D) State Rep. (2004-  )

Virgil Smith (D) State Rep. (2002-2008)

Keith Williams (D) Wayne County Commission (2003-  )

Rating: Safe Democrat

District 5 Tupac Hunter (D) West Detroit, Dearborn Heights, Inkster

Hunter will be fine in this majority black district, however term limited State Rep. Gabe Leland may challenge Hunter.  Leland’s father, Burt, represented this district prior to Hunter for decades.  

Rating: Safe Democrat

District 6 Glenn Anderson (D) Livonia, Westland, Redford, Garden City

Senator Anderson won this historically Republican suburban Wayne County district in 2006, defeating Republican Sen. Laura Toy.  He is favored to win re election, but former Rep. John Pastor (R) of Livonia could make it competitive.

Presidential Results: 57.8 – 40.4 Obama

Rating: Likely Democrat

District 7 Bruce Patterson (R) OPEN Canton, Northville, Plymouth, Trenton

Republican Pruce Patterson barely held on in 2006 against Democrat Mark Slavens in 2006 in this L-shaped suburban Wayne County district.  Democrats now hold every State House District that is wholly or partially in this district.  Mark Slaven’s wife Dian won the last remaining Republican held district last year, and Obama won this district comfortably.  This district will be one of the most competitive and expensive districts in the state.  If Democrats want to retake the Senate, this is a district that they almost have to win.  Former Republican-turned Democrat State Representative John Stewart, who served was an R while serving in the State House from 2000-2006 and who switched parties in 2007, is running.  The fact that he represented a 3rd of this district, and was a Republican, makes him a top tier candidate. h/t Sean Fitzpatrick

Presidential Results: 54.7 – 43.7 Obama

Announced Candidates:

John Stewart (D) Former Republican State Rep. (2000-2006) bin/cfr/com_det.cgi?com_id=514363

Potential Candidates:

Marc Corriveau (D) State Rep. (2006-  )

Kathleen Law (D) State Rep. (2002-2008)

Mark Slavens (D) 2006 Candidate

Phillip LaJoy (R) State Rep. (2002-2008)

Rating: Tossup

District 8 Ray Basham (D) OPEN

Romulus, Taylor, Lincoln Park, Allen Park, Riverview, Wyandotte

The Democrat will be strongly favored in this suburban Wayne County district that is located south of Detroit.

Presidential Results: 64.6 – 33.4 Obama

Announced Candidates:

Potential Candidates:

Hoon Yung-Hopgood (D) State Rep. (2002-2008)

Barbarah Farrah (D) State Rep. (2002-2008)

Ed Clemente (D) State Rep. (2004-  )

Rating: Safe Dem

District 9 Dennis Olshove (D) OPEN  Warren, Eastpointe, Fraser, St. Clair Shores

This district is Democratic but mostly socially conservative one located in southern Macomb County.  It is, along with the 10th District, the home of the “Reagan Democrats,” who also voted strongly for Obama.  The Democrat is favored here.

Presidential Results: 58.3 – 39.6 Obama

Announced Candidates:

Potential Candidates: Lisa Wojno (D) State Rep. (2002-2008)

Frank Accavitti (D) State Rep. (2002-2008)

Jack Brandenburg (R) State Rep. (2002-2008)

Rating: Likely Dem

District 10 Mickey Switalksi (D) OPEN

Sterling Heights, Utica, Roseville, Clinton, Mount Clemens

Although slightly less Democratic than the 9th, this district still favors Democrats. And like the 9th, a conservative Democrat should have no problem winning this district.  Switalski announced earlier this year that he would challenge Rep. Sandy Levin in the 12th Congressional district.

Presidential Results: 55.5 – 42.7 Obama

Announced Candidates:

Potential Candidates:

Steve Bieda (D) State Rep. (2002-2008)

Fred Miller (D) State Rep. (2004-   )

Tory Rocca (R) State Rep. (2004-   )

Rating: Leans Democrat

District 11 Alan Sanborn (R) OPEN

Northern Macomb County

This district is very conservative, but if nutjob crazy Leon Drolet gets the Republican nomination, a Democrat would have a chance here. Still, the Republican should be favored.

Presidential Results: 50.6 – 47.7 McCain

Announced Candidates: Leon Drolet

Potential Candidates:

Kim Meltzer (R) State Rep. (2004-   )

Brian Palmer (R) State Rep. (2002-2008)

Rating: Likely Republican

District 12 Mike Bishop (R) OPEN

Pontiac, Rochester, Auburn Hills, North East Oakland County

Majority leader Bishop is term limited in this swing district in Oakland County.  Although President Obama won this district, I’m not extremely optimistic about picking this one up because Obama’s margin of victory was almost entirely from majority black Pontiac, where turnout won’t be as high next year.

Presidential Results: 52.5 – 46.0 Obama

Announced Candidates:

Potential Candidates:

Tim Melton (D) State Rep. (2006 –  )

Tom McMillan (R) State Rep. (2008-   )

Rating: Leans Republican

District 13 John Pappageorge (R)

Royal Oak, Madison Heights, Berkley, Troy, Bloomfield, Birmingham

In 2006, State Rep. John Pappageorge beat Andy Levin (son of Sandy Levin) by less than 1,000 votes.  Many Democrats blamed Levin’s loss on Kyle McBee, the Green Party candidate who took 3,129 votes, more than 3 times Pappageorge’s margin of victory.  Democrats will challenge Pappageorge again, although it isn’t clear whether Levin will try again, or a State Representative like Marie Donigan will give it a shot.

Presidential Results: 53.7 – 44.8 Obama

Announced Challengers:

Potential Challengers:

Andy Levin (D) 2006 nominee

Marie Donigan (D) State Rep. (2002-   )

Rating: Tossup

District 14 Gilda Jacobs (D) OPEN

Farmington Hills, Southfield, Huntington Woods, Oak Park, Ferndale

This district is probably the most liberal district in Michigan, although not the most Democratic.  Rep. Gilda Jacobs is term limited, and while the all three of the State Reps. in the district are freshmen, whoever wins the Dem nomination will win.

Presidential Results: 74.6 – 24.3 Obama

Announced Candidates:

Potential Candidates:

Rep. Ellen Cogen Lipton (D) (2008-   )

David Coulter (D) Oakland County Commission (2002-  )

Helaine Zack (D) Oakland County Commission (2002-  )

Rating: Safe Democrat

District 15 Nancy Cassis (R) OPEN

Novi, South Lyon, West Bloomfield Township, Northville

I was shocked when I calculated the results for this district.  A decade ago, this was at least one of, if not the most Republican area in Michigan.  Western Oakland County being so Republican is the reason that we have Thad McCotter and Craig DeRoche, and yet this district voted for Barack Obama.  Even the city of Novi voted for him.  And better yet, he won by more than 3,000 votes!  Still, locally we have a while to go before a Democrat can represent Western Oakland County in the State Legislature.  I’m not very keen on this district as a possible pickup in ’10.

Presidential Results: 50.3 – 48.2 Obama

Announced Candidates:

Potential Candidates:

Craig DeRoche (R) State Rep. (2000-2006)

David Law (R) State Rep. (2004-2008)

Rating: Likely Republican

District 16 Cameron Brown (R) OPEN, Lenawee, Branch, Hillsdale, and St. Joseph Counties

I doubt this district will be competitive, unless State Rep. Dudley Spade (D) runs, but even then a Republican like Bruce Caswell starts off with an advantage.

Presidential Results: 49.8 – 48.3 McCain

Announced Candidates:

Potential Candidates:

Dudley Spade (D) State Rep. (2004-  )

Bruce Caswell (R) State Rep. (2002-2008)

Rick Schaffer (R) State Rep. (2002-2008)

Rating: Likely Republican

District 17 Randy Richardville (R) Monroe County, South Washtenaw, East Jackson

Not only the most gerrymandered, but also one of the most closely divided districts in Michigan, this one will likely be home to another competitive race in 2010.  The Washtenaw County portion of this district favors Dems, while the Jackson county portion favors Republicans and Monroe county is a swing region.  In fact, the Presidential results here are almost exactly what President Obama got nationwide, giving it a 2008 PVI of EVEN.  Unfortunately, our bench in this district isn’t the greatest, with our strongest possible candidate running for Secretary of State.  Still, State Rep. Kate Ebli might be able to beat Richardville.

Presidential Results: 52.7 – 45.6 Obama

Announced Challengers:

Potential Challengers:

Kate Ebli (D) State Rep. (2005-   )

Rating: Leans Republican

District 18 Liz Brater (D) Open Washtenaw County, Ann Arbor

One of the most Democratic districts in Michigan and the home of the University of Michigan.  The Democratic bench in this district is quite deep.  Any Democrat is safe here.

Presidential Results: 73.7 – 26.2 Obama

Announced Candidates:

Potential Candidates:

John Hieftje (D) Mayor of Ann Arbor

Rebekah Warren (D) State Rep. (2006-  )

Pam Byrnes (D) State Rep. (2004-  )

Chris Kolb (D) State Rep. (2000-2006)

Rating: Safe Democrat

District 19 VACANT (D)  Calhoun County (Battle Creek) and most of Jackson County

This is the Senate seat that Mark Schauer left vacant when he moved up to Congress last year.  It is usually a swing district, although President Obama won it with votes to spare.  Because this seat is vacant, there will be a special election to fill it later this year.  The Primary will be August 4th and the General on November 9th.

The Democratic candidates are State Rep. Martin Griffin of Jackson, and Sharon Reiner, who ran for congress in 2006 and 2008, narrowly losing to Tim Walberg and then losing badly in the primary to Mark Schauer.  Griffin is backed by the State Democratic Party and should win the Primary.  The Republican candidates are State Rep. Mike Nofs of Battle Creek and Sandstone Township Supervisor C. James Wellman.  Nofs, who is a moderate and popular in the Battle Creek area, should win the primary.  

The fact that 1. Nofs is very moderate 2. He’s very well known and liked in the Battle Creek area and 3. This will be a low turnout special election makes this a tough race for us.  Both parties with certainly spend a lot of money here.  Martin Griffin is from the Jackson area, which is an advantage, as Mark Schauer lost Jackson County in 2002 when he first ran for the State Senate.  If we lose this race it will make it that much more difficult to retake the Senate, so in some ways, whether or not Democrats can gain the trifecta and control redistricting depends on this race.

Presidential Results: 52.7 – 45.6 Obama

Candidates:  

Martin Griffin (D) State Rep. (2006-  )

Sharon Reiner (D)

Mike Nofs (R) State Rep. (2002-2008)

C. James Wellman (R) Sandstone Township Board Memeber

Rating: Tossup

District 20 Thomas George (R) OPEN Kalamazoo County, part of Van Buren County

Tom George, who is running for Governor, will be vacating the 2nd most Democratic seat currently held by a Republican, going by Obama’s winning percentage.  The Republican field is already starting to shape up, with former State Rep. Lawrence Wenke, who’s district included part of Western Kalamazoo County, and current State Rep. Tonya Schuitamaker are both running.  Schuitamaker’s base is Van Buren County, which she represents.  This district only includes two townships in Van Buren, so she would probably be at a disadvantage against Wenke in the primary.  Still, Republicans would do well to nominate someone from the city of Kalamazoo or it’s suburbs, and both Wenke and Schuitamaker are from the rural parts of the district.

Democrats have a few good potential candidates.  Former state Rep. and 2006 candidate Alex Lipsey, State Rep. Robert Jones, or Kalamazoo County Commission Chairman David Buskirk.

Presidential Results: 58.6 – 39.7 Obama

Announced Candidates:

Lawrence Wenke (R) State Rep. (2002-2008)

Tonya Schuitamaker (R) State Rep. (2004-   )

Potential Candidates:

Alex Lipsey (D) State Rep. (2000-2006)

Robert Jones (D) State Rep. (2006-  )

David Buskirk (D) Kalamazoo County Commissioner; Chairman

Rating: Tossup

District 21 Ron Jelinek (R) OPEN Berrien, Cass and Van Buren Counties

A historically Republican area, President Obama did very well here.  This area is home to a lot of moderate Republicans (Fred Upton is from this area), and Berrien County is home to a lot of African-Americans.  Democrats have a very weak bench here, so don’t expect a win here.

Presidential Results: 52.1 – 46.3 Obama

Announced Candidates:

Potential Candidates:

Judy Truesdell (D) 2006 and 2008 Candidate for State House

John Proos (R) State Rep. (2002-   )

Rating: Leans Republican

District 22 Valde Garcia (R) OPEN Livingston, Shiawassee, and Southern Ingham Counties

Livingston County is one of the most Republican Counties in Michigan.  You can be sure that another conservative “family values” Republican will be elected to replace Senator Garcia.

Presidential Results: 52.4 – 45.8 McCain

Announced Candidates:

Potential Candidates:

Joe Hune (R) State Rep. (2002-2008)

Chris Ward (R) State Rep. (2002-2008)

Rating: Safe Republican

District 23 Gretchen Whitmer (D) Ingham County (Lansing)

Gretchen Whitmer will be safe if she runs for re-election.  If she runs for Attorney General, as many expect her to, there is a strong bench of Democrats in the lansing area to take her place.

Presidential Results: 67.2 – 31.3 Obama

Rating: Safe Democrat

District 24 Patricia Birkholz (R) OPEN Allegan, Barry, and Eaton Counties

Although Eaton county showed an impressive swing towards President Obama, the rest of this district, especially heavily Dutch Allegan, is still strongly Republican.

Presidential Results: 50.5 – 47.6 McCain

Announced Candidates:

Potential Candidates:

Brian Calley (R) State Rep. (2006-   )

Rick Jones (R) State Rep. (2004-   )

Fulton Sheen (R) State Rep. (2002-2008)

Rating: Safe Republican

District 25 Judson Gilbert (R) OPEN Lapeer and St. Clair Counties

Lapeer and St. Clair Counties are mostly suburban/exurban areas north of Detroit.  There is also quite a bit of rural farmland and the medium sized city of Port Huron.  A democrat could win here, expecially moderate like John Espinoza, although he doesn’t actually live in the district.  The Republicans have a deep bench here, and I’m not sure whether or not the State Democratic party will decide to put money here.

Presidential Results: 49.2 – 48.6

Announced Candidates:

Potential Candidates:

John Espinoza (D) State Rep. (2004-  )

Phillip Pavlov (R) State Rep. (2004-  )

John Stahl (R) State Rep. (2002-2008)

Rating: Leans Republican

District 26 Deb Cherry (D) OPEN North and East Genesee County, Central Oakland County, Waterford

I don’t know why, but for some reason Republicans gave this suburban Flint area district an arm that reaches into central Oakland County, and they actually used touch-point contiguity to connect it to Waterford Township.  Maybe it was to make this district more Republican, although Waterford voted easily for Obama.  This district was held by Lt. Gov. John Cherry, and is now held by his sister, Deb.  It’s comfortably Democratic, but rising star, moderate African-American Republican Paul Scott could concievably give a Democrat a run for their money.

Presidential Results: 55.8 – 42.4 Obama

Announced Candidates:

Potential Candidates:

Richard Hammel (D) State Rep. (2006-  )

Jim Slezak (D) State Rep. (2008-   )

Ted Hammon (D) State Rep. (2006-2008)

Fran Amos (R) State Rep. (2002-2008)

Paul Scott (R) State Rep. (2008-  )

Rating: Leans Democrat

District 27 John Gleason (D) Flint, South-West Genesee County

The other Genessee County District, this one is much more Democratic.  It includes the city of Flint and other very Democratic areas west of the city.  If Gleason primaries Dale Kildee, there is a big Democratic bench here.

Presidential Results: 68.8 – 29.7 Obama

Rating: Safe Democrat

District 28 Mark Jansen (R) Kent County, suburban Grand Rapids

The 28th District is very strangely shaped.  It skirts around the city of Grand Rapids but includes conservative suburbs like Wyoming.  Mark Jansen should have not trouble winning re-election.

Presidential Results: 55.9 – 42.5 McCain

Rating: Safe Republican

District 29 Bill Hardiman (R) OPEN Grand Rapids, Kentwood

This is another district that we almost must win if we want to retake the senate.  It is the most Democratic district currently held by a Republican, going by Barack Obama’s winning margin.  It is basically all of the city of Grand Rapids plus a few suburbs.  Both Republicans and Democrats have decent benches here, but Democrats have been making gains lately (we won a state house seat in 2006).  I think that at the end of the day, the Democrat will win this district.

Presidential Results: 59.1 – 39.3 Obama

Announced Candidates:

Potential Candidates:

Michael Sak (D) State Rep. (2002-2008)

David LaGrand (D) Grand Rapids City Commissioner and 2006 Candidate

George Heartwell (D) Grand Rapids Mayor

Carol Hennessy (D) Minority Vice-Chair, Kent County Commission

Dave Hildenbrand (R) State Rep. (2004-  )

Glenn Steil (R) State Rep. (2002-2008)

Justin Amash (R) State Rep. (2008-   )

Jerry Kooiman (R) State Rep. (2000-2006)

Rating: Tossup

District 30 Wayne Kuipers (R) OPEN Ottawa County

This district is home to Ottawa County, one of the fastest growing and most Republican counties in Michigan.  Although, like with the South, as the population grows, so does the Democratic performance.  I’d estimate we may start winning this district by the 2020’s, but until then it will remain safely in Republican hands.

Presidential Results: 61.0 – 37.4 McCain

Announced Candidates:

Potential Candidates:

David Agema (R) State Rep. (2006-  )

Arlan Meekhof (R) State Rep. (2006-  )

Rating: Safe Republican

District 31 James Barcia (D) OPEN Sanilac, Huron, Tuscola, Bay, and Arenac Counties

Former Congressman James Barcia is term limited in this big district which includes the “Thumb” region and wraps around Saginaw Bay, including Bay City.  It’s relatively Democratic, although not overwhelmingly.  Democrats have a good bench, and State Rep. Jeff Mayes would be a big improvement over the moderate to conservative Barcia.

Presidential Results: 51.8 – 46.3 Obama

Announced Candidates:

Potential Candidates:

Jeff Mayes (D) State Rep. (2004-  )

Terry Brown (D) State Rep. (2006-  )

John Espinoza (D) State Rep. (2004-  )

Rating: Leans Democrat

District 32 Roger Kahn (R) Saginaw and Gratiot Counties

In 2006, Roger Kahn (AKA Kaaahn!!) won this seat by only 450 votes.  He’s had sort of a rough first term, alledgedly getting into a physical altercation with a 72 year old female Senator Irma Clark-Coleman (D) of Detroit.  The incident was so bizarre that I think that I should post here excerpts from Clark-Coleman’s letter to Majority leader Bishop:

I submit this letter as a formal complaint against the State Senator

from the 32nd District who is a menace to the state legislature. He

perpetrated petulant and violent behavior toward me following a Senate

Appropriation committee meeting yesterday afternoon in the Capitol

building. I ask that you sanction him for conduct unbecoming of an

elected official. I am fearful that given the opportunity, this

legislator would continue to use physical intimidation to reinforce his

policy positions.

He accosted me inside of the main elevator. He rushed at me as if he

were going to strike me in the face after I expressed my great

displeasure with the committee’s approval of the Senate substitute for

HB 4436, which decimates Wayne County’s and Detroit’s ability to provide

mental and medical treatment for poor and uninsured residents…

The Senator from Saginaw charged at me like a bull while we were both

confined in a 6 x 6 elevator. His hysterical behavior startled

citizens who like me were simply trying to leave the Capitol building.

Everyone looked on in horror until the good Senator from the 13th

District blocked his advance to my side of the elevator car.

As the doors opened on the ground floor, the Senator from Troy took me

by the elbow and escorted me out of harm’s way. Despite my exit, the

legislator from the 32nd District continued his verbal assault. His

bellowing startled the Kentwood Senator and the state Budget Director

who were conversing at the visitor’s desk. Both gentlemen looked up in

utter amazement.

Never, in my twelve years as a state legislator, seven years as a member

of the Detroit Board of Education, and thirty years as a Wayne County

employee have I been attacked for my policy positions. I commend Troy’s

best for his quick action to shield me from my aggressor who had lost

control of his temper and his ability to reason.

Senator Kahn denies this, although it’s pretty crazy if true.  That, plus the Democratic nature of this district means he should be in for a tough race next year.

Presidential Results: 56.9 – 41.5 Obama

Announced Challengers:

Potential Challengers:

Andy Colouris (D) State Rep. (2006-   )

Carl Williams (D) State Rep. (2000-2006) and 2006 Candidate

Rating: Tossup

District 33 Alan Cropsey (R) OPEN Clinton, Montcalm, Isabella, and Ionia Counties

Cropsey, who has always been to conservative for his district, is term limited.  Based mostly on his strength in Isabella County (home to CMU), Barack Obama won this district.  We also picked up a State House seat within this district last year, and we will probably pick up another one next year.  Still, our bench is not very strong here.  Democratic turnout may not be a strong next year, either, so I’m cautious about this district.

Presidential Results: 50.7 – 47.4 Obama

Announced Candidates:

Potential Candidates:

Mike Huckleberry (D) State Rep. (2008-  ), 2004 and 2006 candidate for Congress

Bill Caul (R) State Rep. (2004-   )

Paul Opsommer (R) State Rep. (2006-  )

Rating: Leans Republican

District 34 Gerald VanWoerkom (R) OPEN Muskegon, Oceana, Newaygo, and Mason Counties

It’s difficult to tell this far out, but I think that if we win any seats next year, this is our best shot.  Moderate Muskegon Republican Gerald VanWoerkom is retiring, and the Republican candidate to replace him looks to be State Rep. Geoff Hansen, although former State Rep. David Farhat it “thinking about it.”

Either way, we start out with an advantage.  Unlike VanWoerkom, who represented Muskegon County in the House, Hansen hails from the rural Northern portion of the district.  David Farhat, on the other hand, represented the same district as VanWoerkom.  That is, until he was spanked in 2006 by Dem Mary Valentine (he lost 56-44).  Mary Valentine has announced that she is running. Her popularity in the more suburban and rural part of the district and the fact that Farhat is thought to be somewhat corrupt, and Hansen has no base in Muskegon tells me that this one looks like a pickup.

Presidential Results: 58.3 – 40.0 Obama

Announced Candidates:

Mary Valentine (D) State Rep. (2006-   )

Geoff Hansen (R) State Rep. (2004-   )

Potential Candidates:

Mary Valentine (D) State Rep. (2006-   )

Doug Bennett (D) State Rep. (2004-  )

Julie Dennis (D) State Rep. (1998-2004) and 2006 Candidate

David Farhat (R) State Rep. (2002-2006)

Rating: Leans Democrat

District 35 Michelle McManus (R) OPEN Leelanau, Benzie, Manistee, Kalkaska, Wexford, Missaukee, Roscommon, Lake, Osceola, Clare, and Mecosta Counties

I consider Michelle McManus to be Michigan’s version of Michelle Bachmann.  She’s crazy, loud, and extremely conservative.  Luckily, she’s term limited.  Unluckily, she’s running for Secretary of State.  I doubt, however, that she’ll make it out of the Primary.  Obama won her district, and we picked up a State House seat, but our bench is weak in the North-Western Lower Peninsula area.  

Presidential Results: 49.3 – 49.0 Obama

Announced Candidates:

Potential Candidates:

Darwin Booher (R) State Rep. (2004-   )

David Palsrok (R) State Rep. (2002-2008)

Rating: Leans Republican

District 36 Tony Stamas (R) OPEN Alpena, Alcona, Iosco, Ogemaw, Midland, Gladwin, Crawford, Montmorency, Oscoda, and Otsego Counties

Although Republican leaning nationally, this is a swing district in local in statewide races.  The southernmost county, Midland, favors Republicans.  In fact, the Republicans intetionally drew the Democratic northern Counties, especially Alpena, with Midland to create a Republican district.  In 2002, Alpena Democrat Andy Neumann ran against Midland Republican Tony Stamas, with Stamas prevailing narrowly.  Stamas in now term limited and Neumann, who is a State Representative, is “Strongly Leaning Towards running,” also likely to run is State Rep. Joel Sheltrown (D), who is more moderate than Neumann, and also not from the Alpena area, but Iosco County in the center of the district.  I think that Sheltrown would be a stronger candidate, but the primary will be nasty.  The Republican candidate will probably be former State Rep. John Moolenaar of Midland.

Presidential Results: 49.9 – 48.1 McCain

Announced Candidates:

Potential Candidates:

Andy Neumann (D) State Rep. (1998-2002, 2008-   )

Joel Sheltrown (D) State Rep. (2004-  )

John Moolenaar (R) State Rep. (2002-2008)

Rating: Tossup

District 37 Jason Allen (R) OPEN Grand Traverse, Antrim, Charlevoix, Emmett, Cheboygan, Presque Isle, Mackinac, and Chippewa Counties

This is the most Republican Northern Michigan District.  I starts at Traverse City, then jumps the Straits of Mackinac and takes in Mackinac and Chippewa Counties in the U.P., including Sault Ste. Marie.  The Traverse City area has quite a few Republicans to replace Senator Allen, but Emmett, Mackinac, and Chippewa Counties, also a Republican area, are represented by State Rep. Gary McDowell (D).  McDowell is term limited and I could concievably see him winning this district, although it would be an uphill climb.

Presidential Results: 50.8 – 47.5

Announced Candidates:

Potential Candidates:

Gary McDowell (D) State Rep. (2004-   )

Howard Walker (R) State Rep. (2002-2008)

Rating: Leans Republican

District 38 Mike Prusi (D) OPEN Keweenaw, Houghton, Ontonagon, Gogebic, Baraga, Iron, Dickinson, Marquette, Menominee, Delta, Alger, Schoolcraft, and Luce Counties.

My home district! I’ll be sad to see Prusi go, but it’s more important that we get a progressive Dem like him to take his place.  The Democratic bench is deep, the Republican one, not so much.  The Presidential results are a bit misleading, as the Democratic baseline here is far higher than President Obama’s total (which was still a comfortable win).  The most likely candidate is probably former State Rep. Tom Casperson, although the spanking he received at the Hands of Bart Stupak last year make keep him out of politics forever.  If he doesn’t run, it’s likely Dem.  If he does, it’s leans Dem.  Democrats hold every house seat in this district, and other than Casperson, we have for years, so we’ve got a very strong bench.  The two progressive Dems, Steve Lindberg and fmr. Rep. Steve Adamini are from Marquette, while the more conservative Reps are Mike Lahti of Houghton County and Judy Nerat of Menominee County.  

Presidential Results: 52.5 – 45.5

Announced Candidates:

Potential Candidates:

Steve Lindberg (D) State Rep. (2006-   )

Mike Lahti (D) State Rep. (2006-   )

Steve Adamini (D) State Rep. (2000-2006), 2008 Candidate for Marquette County Prosecutor, Northern Michigan University Board of Trustees

Judy Nerat (D) State Rep. (2008-   )

Tom Casperson (R) State Rep. (2002-2008) and 2008 Candidate for Congress

Joel Westrom (R) First District GOP chairman and 2006 Candidate for State House

Rating: Leans Democrat

And for those who skipped some of that, here’s my summary.  Republican seats are bold and italic

Safe Democrat Seats

District 1 (OPEN)

District 2 (OPEN)

District 3 (OPEN)

District 4 (OPEN)

District 5 Hunter

District 8 (OPEN)

District 14 (OPEN)

District 23 (OPEN)

District 27 Gleason

Likely Democrat Seats

District 6 Anderson

District 9 (OPEN)

Leans Democrat Seats

District 10 (OPEN)

District 26 (OPEN)

District 31 (OPEN)

District 34 (OPEN)

District 38 (OPEN)

Tossup Seats

District 7 (OPEN)

District 13 Pappageorge


District 19 VACANT

District 20 (OPEN)

District 29 (OPEN)

District 32 Kahn

District 36 (OPEN)

Lean Republican Seats

District 12 (OPEN)

District 17 Richardville

District 21 (OPEN)

District 25 (OPEN)

District 33 (OPEN)

District 35 (OPEN)

District 37 (OPEN)

Likely Republican Seats

District 11 (OPEN)

District 15 (OPEN)

District 16 (OPEN)

Safe Republican Seats

District 22 (OPEN)

District 24 (OPEN)

District 28 Jansen

District 30 (OPEN)