continuing through the alphabet
NY has 29 representatives: 23 Democrats and 6 Republicans (5 of whom are on the DCCC list
Filing deadline is July 17, primary is Sept 9
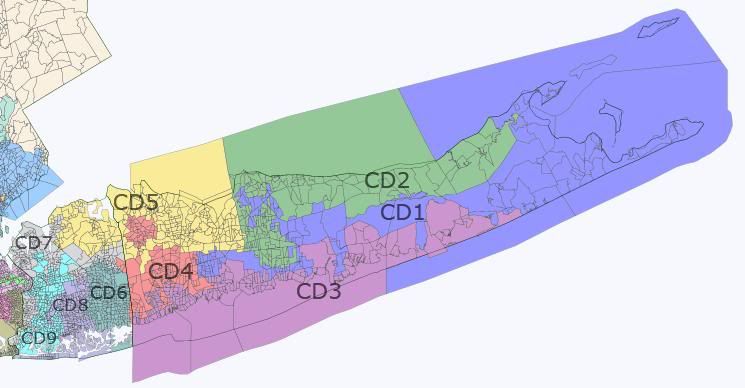
District: NY-01
Location Eastern Long Island
Representative Tim Bishop (D)
First elected 2002
2006 margin 62-38
2004 margin 56-44
Bush margin 2004 2,000 votes out of 300,000
Notes on opponents In 2004, William Manger raised $1.3 million to Bishop’s $1.9 million; in 2006, Italo Zinzi raised $300K to Bishop’s $1.1 million
Current opponents Lee Zeldin
Demographics 32nd highest income (median = $62K),
Assessment Safe
District: NY-02
Location Central Long Island
Representative Steve Israel (D)
First elected 2000
2006 margin 70-30
2004 margin 67-33
Bush margin 2004 45-53
Notes on opponents Neither raised much
Current opponents None declared
Demographics 11th highest income (median = $71K)
Assessment Safe
District: NY-03
Location More of central Long Island, especially the south shore
Representative Peter King (R)
First elected 1992
2006 margin 56-44
2004 margin 63-37
Bush margin 2004 52-47
Notes on opponents In 2004, Blair Mathies raised $200K to King’s $500K; in 2006, David Meijas raised $900K to King’s $2 million
Current opponents None declared
Demographics 12th highest income (median = $71K), 84th fewest Blacks (2.1%)
Assessment On the DCCC list , but we need a candidate!
District: NY-04
Location Western part of southern Long Island (i.e. close to NYC)
Representative Carolyn McCarthy (D)
First elected 1996
2006 margin 65-35
2004 margin 63-37
Bush margin 2004 44-55
Notes on opponents In 2004, James Garner raised $300K to McCarthy’s $1.7 million. In 2006, Martin Blessinger raised $100K to McCarthy’s $1.4 million
Current opponents None declared
Demographics 20th highest income (median = $67K)
Assessment Safe
District: NY-05
Location Northern part of western Long Island, and part of Queens
Representative Gary Ackerman (D)
First elected 1983
2006 margin unopposed
2004 margin 71-28
Bush margin 2004 36-63
Notes on opponents No money
Current opponents None declared
Demographics 22nd fewest veterans (6.7%), 7th most nonWhite, nonBlack, nonLatinos (mostly Asians, who are 24.5% of the population)
Assessment Safe
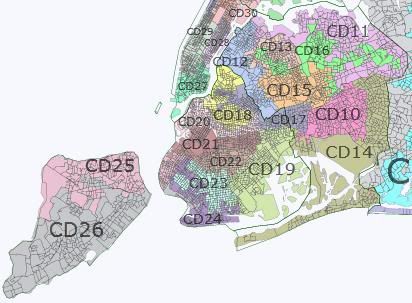
District: NY-06
Location Southeastern part of Queens, NYC
Representative Gregory Meeks (D)
First elected 1998
2006 margin unopposed
2004 margin unopposed
Bush margin 2004 15-84
Notes on opponents NA
Current opponents None declared
Demographics 17th fewest veterans (6.2%), 5th fewest Whites (12.8%), 12th most Blacks (52.1%), 26th most most nonWhite, nonBlack, nonLatinos (including 6.1% multiracial), 6th most Democratic
Assessment Safe
District: NY-07
Location Some of Queens, some of Bronx, NYC
Representative Joseph Crowley (D)
First elected 1998
2006 margin 84-16
2004 margin 81-19
Bush margin 2004 25-74
Notes on opponents Neither raised money
Current opponents None declared
Demographics 19th fewest veterans (6.4%), 38th fewest Whites (27.6%), 35th most Latinos (39.5%), 28th most most nonWhite, nonBlack, nonLatinos (12.8% Asian), 27th most Democratic (tie with NY08)
Assessment Safe
District: NY-08
Location West side of Manhattan, part of lower Manhattan, southern Brooklyn
Representative Jerrold Nadler (D)
First elected 1992
2006 margin 85-14
2004 margin 81-19
Bush margin 2004 27-72
Notes on opponents In 2004, Peter Hort raised $140K to Nadler’s $850K
Current opponents None declared
Demographics 9th fewest veterans (5.1%), 38th most nonWhite, nonBlack, nonLatinos (11% Asian)
Assessment Safe.
District: NY-09
Location Odd bits of Queens and Brooklyn, NYC
Representative Anthony Weiner (D)
First elected 1998
2006 margin unopposed
2004 margin 71-29
Bush margin 2004 44-56
Notes on opponents No money
Current opponents None declared
Demographics 28th fewest veterans (7.1%), 25th most nonWhite, nonBlack, nonLatinos (14% Asian)
Assessment Safe
District: NY-10
Location A V shaped portion of Brooklyn, NYC
Representative Edolphus Towns (D)
First elected 1982
2006 margin 92-6 (! and his opponent was a Republican!)
2004 margin 91-7 (!)
Bush margin 2004 13-86
Notes on opponents No money
Current opponents None declared, although there is a primary challenger
Demographics 27th lowest income (median = $30K), 11th fewest veterans (5.3%), 8th fewest Whites (16.2%), 9th most Blacks (60.2%), 3rd most Democratic
Assessment You’re kidding, right? He might lose a primary, though
District: NY-11
Location Central Brooklyn, NYC
Representative Yvette Clarke (D)
First elected 2006
2006 margin 90-8
2004 margin NA
Bush margin 2004 13-86
Notes on opponents No money
Current opponents None declared
Demographics 26th most in poverty (23.2%), 4th fewest veterans (4.1%), 25th fewest Whites (21.4%), 12th most Blacks (58.5%), 4th most Democratic
Assessment Safe
District: NY-12
Location Bits of Queens, Manhattan and Brooklyn (this one won a ‘contest’ for most convoluted map of a district)
Representative Nydia Velazquez (D)
First elected 1992
2006 margin 90-10
2004 margin 86-14
Bush margin 2004 19-80
Notes on opponents No money
Current opponents None declared
Demographics 19th lowest income (median = $29K), 3rd fewest veterans (4.0%), 25th fewest Whites (23.3%), 24th most Latinos (48.5%), 18th most nonWhite, nonBlack, nonLatino (15.9% Asian), 15th most Democratic
Assessment Safe
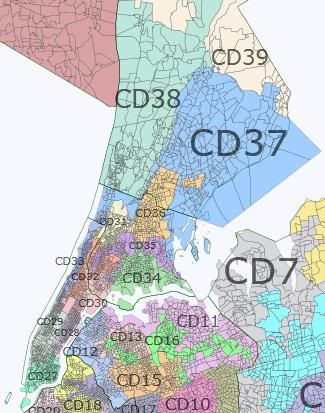
District: NY-13
Location Staten Island and a bit of Brooklyn, NYC
Representative Vito Fosella (R)
First elected 1997
2006 margin 57-43
2004 margin 59-41
Bush margin 2004 55-45
Notes on opponents In 2004, Frank Barbaro raised $400K to Fosella’s $1.1 million; in 2006, Stephen Harrison raised $100K to Fosella’s $1.6 million
Current opponents Steve Harrison , who ran in 2006; Domenic Recchia.
Demographics Not unusual on what I track
Assessment On the DCCC list . superribbie ranks this as the 34th most vulnerable Republican seat. We can win this one!
District: NY-14
Location East side of Manhattan, and western Queens
Representative Carolyn Maloney (D)
First elected 1992
2006 margin 84-16
2004 margin 81-19
Bush margin 2004 24-74
Notes on opponents neither raised much
Current opponents None declared
Demographics 15th fewest veterans (6.0%)
Assessment Safe
District: NY-15
Location Mostly Harlem, NYC, but also bits of Queens
Representative Charles Rangel (D)
First elected 1970
2006 margin 94-6 (! against a Republican)
2004 margin 91-7
Bush margin 2004 9-90
Notes on opponents No money
Current opponents None declared
Demographics 12th lowest income (median = $28K), 3rd most in poverty (30.5%), 6th fewest veterans (4.6%), 9th fewest Whites (16.4%), 37th most Blacks (30.5%), 25th most Latinos (47.9%), tied for most Democratic
Assessment Safe
District: NY-16
Location South Bronx, NYC
Representative Jose Serrano (D)
First elected 1990
2006 margin 95-5 (!)
2004 margin 95-5 (!)
Bush margin 2004 10-89
Notes on opponents The same guy ran twice, with no money
Current opponents None declared
Demographics Lowest income in the USA (median = $19K), most in poverty (42.2%), 2nd fewest veterans (3.9%), fewest Whites (2.9%), 45th most Blacks (30.3%), 15th most Latinos (62.8%), tied for most Democratic
Assessment Safe
District: NY-17
Location Northern Bronx, a bit of Westchester, but mostly Rockland county, the part of NY on the west side of the Hudson
Representative Elliot Engel (D)
First elected 1998
2006 margin 76-24
2004 margin 76-22
Bush margin 2004 33-67
Notes on opponents No money
Current opponents None declared
Demographics 44th most Blacks (30.4%)
Assessment Safe
District: NY-18
Location Southern Westchester (just north of NYC)
Representative Nita Lowey (D)
First elected 1988
2006 margin 71-29
2004 margin 70-30
Bush margin 2004 42-58
Notes on opponents Richard Hoffman ran in 2004 and 2006, and raised less than $100K each time; Lowey raised about $1.5 million each time
Current opponents None declared
Demographics 19th highest income (median = $69K).
Assessment Safe
District: NY-19
Location Northern suburbs and exurbs of NYC, bordering on NJ, a little of PA, and CT
Representative John Hall (D)
First elected 2006
2006 margin 51-49
2004 margin NA
Bush margin 2004 54-45
Notes on opponents In 2006, Hall ousted Sue Kelly, with $1.6 million to her $2.5 million
Current opponents Kieran Lalor
Demographics 24th highest income (median = $64K)
Assessment Somewhat vulnerable. On the DCCC list , superribbie ranks this as the 15th most vulnerable Democratic seat. However, Lalor looks like a nut job, so if there’s no better opponent….Several people have rule out running, see the WIKI
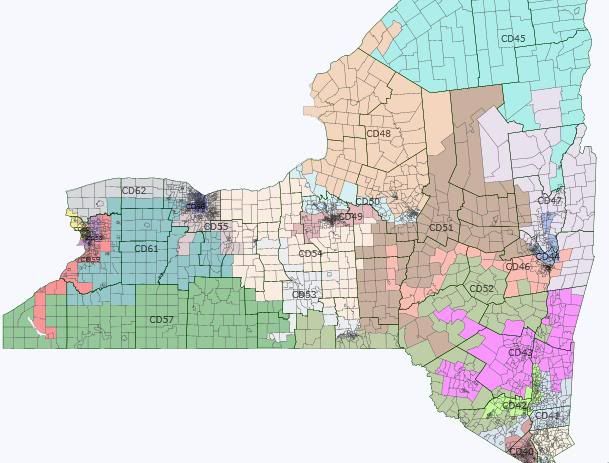
District: NY-20
Location Eastern part of northern NY, mostly around Albany
Representative Kirsten Gillibrand (D)
First elected 2006
2006 margin 53-47
2004 margin NA
Bush margin 2004 54-46
Notes on opponents In 2006, Gillibrand ousted John Sweeney, raising $2.5 million to his $3.5 million
Current opponents Sandy Treadwell, Richard Wager, John Wallace, Michael Rocque, possibly John Sweeney
Demographics 38th most Whites (93.4%)
Assessment Vulnerable. On the DCCC list , superribbie ranks this as the 8th most vulnerable Democratic seat.
District: NY-21
Location Albany, Troy, Schenectady and points west of there
Representative Michael McNulty (D) retiring
First elected 1988
2006 margin 72-20
2004 margin 71-29
Bush margin 2004 43-55
Notes on opponents No money
Current opponents The Democrat is Tracey Brooks ; (others, too, please see the Wiki page, which I just updated) no declared Republican
Demographics Not unusual on what I track
Assessment On the DCCC list , superribbie ranks this as the 41st most vulnerable Democratic seat. On the other hand, if no Republicans run, it’s safe
District: NY-22
Location If you picture where NY bends to the west, you’ll have the 22nd. Borders PA, includes Poughkeepsie (NYC exurb) in the east and Binghamton and Ithaca in the west
Representative Maurice Hinchey (D)
First elected 1992
2006 margin unopposed
2004 margin 67-33
Bush margin 2004 45-54
Notes on opponents No money
Current opponents George Phillips, Bruce Layman
Demographics Not unusual on what I track
Assessment Safe
District: NY-23
Location Northernmost NY, bordering Canada and VT
Representative John McHugh (R)
First elected 1992
2006 margin 63-37
2004 margin 71-29
Bush margin 2004 51-47
Notes on opponents In 2006, Robert Johnson raised $160K to McHugh’s $750K
Current opponents Mike Oot
Demographics 8th most rural (65.3%),
Assessment Long shot
District: NY-24
Location Rome, Utica, and Geneva, near Lake Ontario
Representative Michael Arcuri (D)
First elected 2006
2006 margin 54-45
2004 margin NA
Bush margin 2004 53-47
Notes on opponents In 2006, this was an open seat; Arcuri raised $2 million and his opponent $1.5 million
Current opponents None declared
Demographics Not unusual on what I track
Assessment Slightly vulnerable. On the DCCC list ; superribbie ranks this as the 38th most vulnerable Democratic seat. Of course, with no opponent, it’s safe
District: NY-25
Location From Lake Ontario east to Syracuse
Representative Jim Walsh (R) retiring
First elected 1988
2006 margin 51-49
2004 margin Unopposed by Democrats
Bush margin 2004 48-50
Notes on opponents In 2006, Dan Maffei raised $900K to $1.8 million for Walsh
Current opponents Dan Maffei is the Democrat, no announced Republicans
Demographics Not unusual on what I track
Assessment Highly vulnerable. On the DCCC list . superribbie ranks this as the second most vulnerable Republican seat. And, if no one runs….it’s a gimmee!
District: NY-26
Location Just south of Lake Ontario, east of Lake Erie
Representative Tom Reynolds retiring
First elected 1998
2006 margin 52-48
2004 margin 56-44
Bush margin 2004 55-43
Notes on opponents Jack Davis ran in 2004 and 2006. In 2006, he raised $2.4 million to Reynolds’ $5 million; in 2004, $1.4 million to $2.5 million
Current opponents Democrats: Jon Powers
Alice Kryzan . Reynolds just announced his retirement, and Davis is considering running again, as well
Demographics 55th most Whites (92.3%)
Assessment On the DCCC list ; superribbie ranks this as the 27th most vulnerable Republican seat
District: NY-27
Location South and east of Lake Erie, including Buffalo
Representative Brian Higgins (D)
First elected 2004
2006 margin 79-21
2004 margin 51-49
Bush margin 2004 45-54
Notes on opponents In 2004, this was an open seat and Higgins beat Nancy Naples, each raising about $1.5 million. In 2006, Michael McHale raised little
Current opponents None declared
Demographics Not unusual on what I track
Assessment Somewhat vulnerable. On the DCCC list . But, again, no opponent, so….
District: NY-28
Location The shores of Lake Ontario, a long, narrow strip
Representative Louise Slaughter (D)
First elected 1986
2006 margin 73-27
2004 margin 73-25
Bush margin 2004 36-63
Notes on opponents Neither raised money
Current opponents None declared
Demographics 48th lowest income (median = $32K)
Assessment Safe
District: NY-29
Location Most of the part of NY that borders PA
Representative Randy Kuhl (R)
First elected 2004
2006 margin 51-49
2004 margin 51-41
Bush margin 2004 56-42
Notes on opponents In 2006, Eric Massa raised about $1.5 million, as did Kuhl
Current opponents Eric Massa
Demographics 30th most Whites (92.5%), 51st fewest Latinos (1.4%)
Assessment Vulnerable. superribbie ranks this as the 14th most vulnerable Republican seat
