NY and ME: Population by CD

Today’s the last day of Census data releases, meaning we have the complete set of all 50 states now. The Census Bureau released some data summarizing the entire nation, including what you’d think was the single most important bit of all, considering the way they hyped the announcement: the new population center of the U.S., still in south-central Missouri, but moving 30 miles to the southwest, now near Plato, MO. Perhaps more interestingly, they summarized the country’s demographic change as a whole: that starts with the nation’s Hispanic population crossing the 50 million mark, now up to almost 17% of the nation’s population. Hispanics and Asians both grew at a 43% rate, and people checking “2 or more” races rose at a 32% rate. The non-Hispanic white share of the population fell from 69% to 64%. They also found a country that’s more urban than ever before, with 84% of the country living in metropolitan areas now.

I know you’re all champing at the bit to find out what happens in Maine, but there’s this other state called “New… Something” that we should probably get through first. New York is one of only two states to lose two seats, from 29 down to 27. (Ohio was the other one.) New York’s new target is 717,707, up from about 654K in 2000. Thanks to a few hundred votes in a couple of state Senate races that tipped that chamber’s balance, the GOP managed to hold on to one leg of the redistricting trifecta, meaning that instead of a shot at a 26-1 Dem map, there’s probably just going to be a shared-pain map instead with a GOP loss upstate and a Dem loss in the NYC metro area. That’s despite the fact that New York City itself actually grew a bit, to 8.175 million, still by far the nation’s largest city. (There are moves afoot toward an independent redistricting commission, but this doesn’t seem likely to happen.)

In general, the heaviest losses were in the western part of Upstate, with the state’s two biggest losers the Dem-held 27th (Buffalo) and 28th (Rochester). On the other hand, losses also popped up rather patchily in parts of the outer boroughs (especially the 11th in the black parts of Brooklyn… without much seniority, Yvette Clarke may wind up with the shortest straw among the NYC delegation) and Long Island (Peter King’s 3rd… which would be a prime target for the 2nd seat to evaporate, if only the Dems controlled the trifecta here). The big gainers were both urban (Jerry Nadler’s 8th, probably fueled not so much by growth in Manhattan as among Orthodox families in Borough Park in Brooklyn) and exurban (Nan Hayworth’s 19th, at the outermost reaches of the NYC metro area).

While none of the districts in New York seem to be undergoing the kind of rapid demographic transformation that threatens the red/blue balance in any place like we’ve seen in Texas or California, a few districts are worth looking at just as an indicator of what an interesting tapestry New York City is. Take the 5th for instance (another possibility for wipeout, given its strange position straddling Nassau County and Queens, and Gary Ackerman’s non-entity-ness): it’s moved from 44% non-Hispanic white, 5% non-Hispanic black, 24% non-Hispanic Asian, and 24% Hispanic, to 36% white, 4% black, 33% Asian, and 26% Hispanic, close to an Asian-plurality, thanks to growth in the Asian community in Flushing. A few districts in New York City are getting whiter, thanks to hipsters and gentrifiers: the 11th moved from 21% white and 58% black to 26% white and 53% black, while the 12th moved from 23% white and 49% Hispanic to 27% white and 45% Hispanic. The Harlem-based 15th went from 16% white, 30% black, and 48% Hispanic, to 21% white, 26% black, and 46% Hispanic, while the remarkably complex, Queens-based 7th went the other direction, from 28% white, 16% black, 13% Asian, and 40% Hispanic to 21% white, 16% black, 16% Asian, and 44% Hispanic.


District Rep. Population Deviation
NY-01 Bishop (D) 705,559 (12,148)
NY-02 Israel (D) 679,893 (37,814)
NY-03 King (R) 645,508 (72,199)
NY-04 McCarthy (D) 663,407 (54,300)
NY-05 Ackerman (D) 670,130 (47,577)
NY-06 Meeks (D) 651,764 (65,943)
NY-07 Crowley (D) 667,632 (50,075)
NY-08 Nadler (D) 713,512 (4,195)
NY-09 Weiner (D) 660,306 (57,401)
NY-10 Towns (D) 677,721 (39,986)
NY-11 Clarke (D) 632,408 (85,299)
NY-12 Velazquez (D) 672,358 (45,349)
NY-13 Grimm (R) 686,525 (31,182)
NY-14 Maloney (D) 652,681 (65,026)
NY-15 Rangel (D) 639,873 (77,834)
NY-16 Serrano (D) 693,819 (23,888)
NY-17 Engel (D) 678,558 (39,149)
NY-18 Lowey (D) 674,825 (42,882)
NY-19 Hayworth (R) 699,959 (17,748)
NY-20 Gibson (R) 683,198 (34,509)
NY-21 Tonko (D) 679,193 (38,514)
NY-22 Hinchey (D) 679,297 (38,410)
NY-23 Owens (D) 664,245 (53,462)
NY-24 Hanna (R) 657,222 (60,485)
NY-25 Buerkle (R) 668,869 (48,838)
NY-26 Vacant 674,804 (42,903)
NY-27 Higgins (D) 629,271 (88,436)
NY-28 Slaughter (D) 611,838 (105,869)
NY-29 Reed (R) 663,727 (53,980)
Total: 19,378,102

Now for the maine event! (Rim shot.) Maine’s a lot like Rhode Island and New Hampshire in that the long-standing boundary between its two districts rarely seems to budge much, and this year won’t be any different. Maine’s target is 664,181, up from 637K in 2000. The disparity of a little more than 4,000 people means things won’t change much; the Republicans control the redistricting process this year but there’s not a lot of fertile material here for them to try to make swingy ME-02 much redder.


District Rep. Population Deviation
ME-01 Pingree (D) 668,515 4,334
ME-02 Michaud (D) 659,846 (4,335)
Total: 1,328,361

SSP Daily Digest: 3/7

HI-Sen: I’m not sure where these rumors started – or if they’re just tradmed speculation – but Gov. Neil Abercrombie says he hasn’t tried to get retiring Sen. Dan Akaka to resign early in order to appoint a replacement (who could then run for a full term next year as an incumbent). Count me among those who thinks former Gov. Linda Lingle isn’t as intimidating in real life as she might seem on paper – particularly given the fact that Barack Obama is running for re-election, and that her exit poll approvals in 2010 were a sucky 41-56. So I’m not convinced there’d even really be any point in trying to push an Akaka resignation.

ME-Sen: As we wait for the Great Teabagger Hope to deliver our dreams, the Hotline has word of another possible challenger to Sen. Olympia Snowe: former state legislator Carol Weston, who is now the state director of the Maine branch of the David Koch front group Americans for Prosperity. That could mean access to serious resources – something Weston acknowledges is a key factor in deciding on a run. Anyhow, she’s not ruling out a run, but claims she isn’t really considering it yet. But she also says that as part of her job with AfP, she sometimes has to “reign in” Snowe – pretty denigrating words, if you ask me!

MI-Sen: We’ve mentioned him before, but now he’s making it official: Former juvenile court judge and all-around social conservative Randy Hekman says he’ll seek the GOP line to challenge Debbie Stabenow. Hekman sounds decidedly Some Dude-level, though.

NV-Sen: This time, the joke comes pre-written. The ultra-wealthy Sue Lowden still has hundreds of thousands in campaign debts and has now been sued by her former polling company, Denver-based Vitale & Associates, for unpaid bills. The pollster’s attorney said Lowden is “probably driving around in her Bentley with a load of chickens in the back as barter to settle her campaign debts.”

PA-Sen: Pretty sweet re-elects for Bob Casey (D) in this new Muhlenberg College poll of registered voters: 48% say yes, 24% no, and 25% are unsure. Against Generic R, Casey pulls 41 to 27, but Muhlenberg also allowed people to say “it depends on the candidate” (not sure that’s such a helpful choice), which scored 18. It’s not entirely clear what the sample looked like, though, since the Mule only gives the breakdowns for their larger “all adults” sample (36D, 36R, 11I). In 2008, it was 44D, 37R, 18I.

RI-Sen, RI-01: The head of the Rhode Island state police, Brendan Doherty, just unexpectedly announced that he would resign in April, and that’s leading to talk he might be considering a run for office as a Republican. Though Doherty had originally been appointed by Republican Gov. Don Carcieri, he was re-appointed only last week by the new governor, Lincoln Chafee. Anyhow, Doherty supposedly is choosing between a challenge to Sen. Sheldon Whitehouse or to freshman Rep. David Cicilline in the first district. He says he’ll announce his plans at the end of May.

VA-Sen, VA-11: Rep. Gerry Connolly (D) is opting out of a Senate run, saying instead he’ll seek re-election to a third term in the House. Like just about everyone else, he also declared that he wants to see Tim Kaine run. Speaking of which, Sen. Mark Warner said on the teevee this weekend that he thinks the odds of Kaine jumping in were “slim” but “are getting a lot better right now.” I have no idea if Warner has any special insight, or if maybe he’s just trying to pull a reverse-Inouye here (i.e., goad someone into running).

On a related note, PPP has a state-level report card out for VA politicians.

NV-Gov: Jon Ralston calls it “one of the most brazen schemes in Nevada history” (not just electoral history! and this is Nevada!), while Rory Reid says everything he did was “fully disclosed and complied with the law.” Ralston describes this “scheme” as the formation of “91 shell political action committees that were used to funnel three quarters of a million dollars into his campaign.” Ralston’s had wall-to-wall coverage at his site. Among other things, Reid’s legal advisor wrote a letter to the campaign saying he thought the use of these PACs was legal – and, in a point that Ralston is seriously disputing, also said he got sign-off from the Secretary of State. I don’t really think Reid had much of a future in NV politics anyway, but if Ralston’s reading of the situation is right, this could spell a lot of trouble for him. If not, then it’s just some sketchy politics-as-usual. Even Ralston himself acknowledges that “the point here is less whether it actually was legal… but whether it should be.”

CA-36: Finally some endorsements for Debra Bowen: She just announced the backing of state Sens. Alan Lowenthal and Fran Pavley, state Rep. Betsy Butler, and former state Sen. Sheila Kuehl.

MN-08: This is from a couple of weeks ago, but still relevant: Duluth-area state Sen. Roger Reinert says he won’t challenge freshman GOPer Chip Cravaack next year, adding his name to the list of Dems who have declined to run. Others who have said no: Duluth Mayor Don Ness; former state House Majority Leader Tony Sertich; state Rep. Tom Rukavina; and state Senate Minority Leader Tom Bakk (whom we’d previously mentioned). Man, that’s a lot of dudes named Tom! (UPDATE: Just two – it’s Tony, not Tom, Sertich.) That’s most of the heaviest hitters, but another possible candidate is Duluth City Councilman Jeff Anderson, who told FOX 21 that he is “very interested” (their words) in the race.

Milwaukee Co. Exec.: Huh – I’d managed to forget that Scott Walker didn’t just emerge fully-formed out of a rent in David Koch’s skull on January 1st, 2011. Until not that long ago, he was the Milwaukee County Executive, which means that his old seat is up in a special election next month. It should come as no surprise that Walker’s extremely unpopular attempts at union busting have become the issue in the race, and Republican state Rep. Jeff Stone is suffering badly for it. Stone voted for Walker’s budget bill, but now says he “would have preferred to leave the collective bargaining intact” – even though, as TPM notes, he voted against every Democratic amendment that would have done exactly that. Stone’s nominally independent but really Democratic opponent, philanthropist Chris Abele, has been hammering him on this front. The April 5th vote is actually a run-off; last month, Stone took 43% while Abele scored 25%, splitting the Democratic vote with the remaining candidates (all of whom were on the lefty side of the equation).

PA-AG: Columnist Jan Ting, who took 29% against Tom Carper in DE-Sen in 2006 but later left the GOP, says he has heard that former Rep. Patrick Murphy is considering a run for Pennsylvania Attorney General. A source also informs me that this is true. Note that most of PA’s statewide positions other than governor are up in 2012, so this race would be coming on soon. Note, too, that it will be an open seat: Newly-elected Gov. Tom Corbett was himself AG, and he appointed Pittsburgh-area prosecutor Linda Kelly to take his place. Kelly, however, has said she won’t run for the post next year.

Ohio Ballot: Though it’s gotten less attention than the fight in Wisconsin, Ohio is on the verge of passing legislation which strip collective bargaining rights from public workers. TPM reports that Ohio Dems are planning to put the law, known as SB 5, on the ballot (it’d take about 230,000 signatures), something which could happen either this November or next. This could wind up being a truly epic fight – though I’m also reminded of the last time Ohio Dems put up some lefty ballot measures in an odd-numbered year, and that didn’t turn out so well. (The 2005 effort was called Reform Ohio Now, and you can read all about it in the SSP Deep Archives.) Still, I think our chances would be a lot better this time.

KS Redistricting: In 2002, state lawmakers split the rather blue Douglas County (home to the city of Lawrence) between two congressional districts, the 2nd and 3rd. Now, though, thanks to growth in Johnson County, the third has to shed population (as we informed you last week), and one Democratic legislator is suggesting that Douglas could be reunited in a single CD. This seems unlikely, though, as it’s manifestly in the Republican Party’s interest to keep Lawrence cracked.

NE Redistricting: There’s a similar story playing out in neighboring Nebraska, where the now-famous 2nd CD (which gave Barack Obama a very narrow win – and a single electoral vote) also has to reduce its population. Light-blue Douglas County (no, I’m not losing it – different county, different state, same name as above) is currently entirely within the borders of NE-02, but it could potentially get cracked. The linked article discusses a number of different possible scenarios for the whole state, and even has some hypothetical maps.

NJ Redistricting: No surprise here: Democrats and Republicans couldn’t agree on a new map for New Jersey’s state legislative districts, so the Chief Judge of the Supreme Court, Stuart Rabner, appointed Rutgers Prof. Alan Rosenthal as tiebreaker (click here for a detailed profile). That wasn’t a surprise, either, as the 78-year-old Rosenthal performed the same duties during the last two rounds of redistricting for the U.S. House. Rosenthal is a Democrat but has a very non-partisan reputation. Last time, Democrats convinced the appointed tiebreaker, Larry Bartels, that their proposed gerrymander would improve minority representation. A similar outcome is probably not so likely this time.

OR Redistricting: As you can see from all the above links, now that redistricting data has been released, we’re starting to see a lot more redistricting-related stories with a little more meat to them. This piece outlines the issues facing Oregon and also explains some of the deadlines involved. If lawmakers don’t enact a state lege map by July 1 (or the governor vetoes it), then the task falls to Secretary of State Kate Brown, a Democrat. This is typically what’s happened in the past, though apparently there’s some hope that the evenly-divided state House (with its unusual dual Speakerships) will produce something both sides can agree on. Note that there is no similar deadline for congressional redistricting.

PA Redistricting: Pennsylvania’s congressional Republicans are headed to the state capital of Harrisburg this week, to discuss how best to gerrymander their map with their state legislative colleagues. Given that the GOP has absolute control over the redistricting process in PA, Democrats are going to get pretty fucked here, and PoliticsPA has a rundown of several possible scenarios that Republicans are supposedly considering.

New York: An issue which first came up nationwide last cycle is still percolating in New York. As we explained in September 2009, a new federal law (the MOVE Act) requires that absentee ballots be mailed to all overseas and military voters at least 45 days before the general election. That’s a problem in states with late primaries, like New York, where results can’t be certified and ballots can’t be printed in time to meet this deadline. A couple of states (I think just Vermont and Minnesota) moved their primaries up a bit to aide compliance, but others, like NY, had to get waivers from the Department of Justice that allowed them to send out ballots later. Despite getting such a waiver, many boards of election (including NYC’s) still failed to comply with even the later deadline – and now the DoJ (which had to sue NY last year) is unhappy with the state’s lack of further efforts to remedy these problems. An association of local election commissioners, at a meeting in January, voted to ask the state legislature to move the primary to June to avoid these issues altogether.

Dave’s Redistricting App: Dave has more data and more fixes, so that you can get your fix of data.

Republican Gerrymander of New York

This diary presents a theoretical Republican gerrymander of New York (27 representatives) that should, in the normal course of events, yield a 16D-11R delegation. Exactly how Republican a seat needs to be to be safe is a matter for debate, but in none of the projected Republican seats did Obama receive more than 47% of the vote which I feel should be safe most of the time. This map make makes quite a bit of use of water contiguity both around Long Island and Lake Ontario, however there is no touch point contiguity. Population deviations are all less than 1000 (within 0.15%).

Districts are numbered in reverse order to the current system, low numbered districts are upstate and high numbered are downstate.

NY-1 (Blue): More or less similar to the current 28th including the most Democratic parts of Buffalo, Niagara Falls, and the western Democratic parts of Rochester. Uses water contiguity on Lake Ontario instead of following the coastline which helps to push the PVI a little more Democratic. O 71% M 27%  

NY-2 (Green): Reasonably similar to the current 26th in that it includes parts of the Buffalo and Rochester suburbs and the areas in between. O 47% M 51%  

NY-3 (Dark Magenta): At this point upstate New York starts to take departures from reality and no longer resembles the current districts. The western parts of the southern tier, the south Buffalo suburbs, and wraps around Rochester to take in the eastern suburbs.  O 47% M 52%  

NY-4 (Red): Eastern and southern democratic leaning areas of Rochester, water contiguity to Oswego and a thin strip to metro Syracuse, tendrils to both Utica and Ithaca. O 64% M 35%  

NY-5 (Gold): The remainder of the southern tier, the territory between Syracuse (including its western suburbs) and Rochester, wraps around to southern Syracuse avoiding Ithaca. O 47% M 51%  

NY-6 (Teal): Northern Syracuse, northern Utica, Rome, north along the Lake Ontario coastline before turning east and then south, terminating short of Albany. O 47% M 52%  

NY-7 (Dark Grey): The Democratic leaning northernmost counties, a narrow strip running down the eastern state line, Saratoga Springs, Schenectady, and Albany. O 62% M 36%  

NY-8 (Slate Blue): Otsego County centred, with arms running off in every direction sucking in Republican leaning districts. O 47% M 51%

NY-9 (Cyan): Both the east and west state lines with convoluted lines grabbing the most Republican parts of Rockford County O 46% M 52%  

NY-10 (Deep Pink): Binghampton, Middletown, Peekskill, Newburgh, Poughkeepsie, Kingston, and the land connecting them. O 60% M 39%  

NY-11 (Chartreuse): The Democratic parts of Rockland and parts of Westchester, down the Hudson river coastline a little. O 66% M 33%

NY-12 (Cornflower Blue): More of Democratic Westchester, including New Rochelle and Mount Vernon, plus some of the northern Bronx. O 85% M 14%  

NY-13 (Dark Salmon): Southern Bronx, much like the current 16th. O 93% M 7%  

NY-14 (Olive): Northern Manhattan, much like the current 15th. O 92% M 7%  

NY-15 (Dark Orange): Southern Manhattan. O 82% M 17%  

NY-16 (Lime): Little bits of Kings, Queens, the Bronx, and Manhattan. O 79% M 20%  

NY-17 (Dark Slate Blue): Mostly Queens. O 81% M 19%

NY-18 (Yellow): North-eastern Kings. O 95% M 5%  

NY-19 (Yellow Green): North-western Kings and the northern shore of Staten Island. O 90% M 9%

NY-20 (Pink): South-western Kings and Staten Island minus its north shore. O 47% M 53%

NY-21 (Maroon): South Eastern Kings, and connected by water contiguity, the entire south coast of Long Island from Long Beach to Montauk.

O 46% M 53%

NY-22 (Sienna): Mostly Queens. O 71% M 29%

NY-23 (Aquamarine): Horrendously tortuous district picking up everything republican in southern Westchester, Bronx County, Queens, and Nassau and using repeated water contiguity over Eastchester Bay and the Long Island Sound to do it. O 47% M 52%

NY-24 (Indigo): Republican areas north of Jamaica bay in Queens, as well as southern Nassau, and a little south-western Suffolk.  O 47% M 52%

NY-25 (Pale Violet Red): The most Democratic parts of central and southern Queens and Nassau. O 90% M 10%

NY-26 (Grey): The republican parts of Eastern Long Island O 47% M 53%

NY-27 (Spring Green): The Democratic parts of Eastern long island, in four sections, each connected by water contiguity along the Long Island Sound. O 63% M 37%

Bipartisan Upstate NY Map – 6D, 5R

Here is my take on what will happen in redistricting in upstate New York.  Some ground rules…

1.  I went in with the assumption two seats are going to be eliminated, one Republican, and one Democrat.  

2.  The Republican, most likely, will be Ann Marie Buerkle of NY 25.  There are several reasons for this.  First, she won a D+3 district in an upset, and she lives in the most Democratic part of the district (Syracuse), meaning giving her a much better district would be difficult.  Second, she is considered too conservative for her district.  Both mean she’s probably the most untenable incumbent.  Finally, Bill Owens is going to need some Democrats to shore up his seat, and Syracuse is the best place to poach them.

3.  The downstate district eliminated is not pictured on the map, but it is likely a NYC-based district not considered a VRA seat.

I didn’t redistrict the sixteen downstate districts for a number of reasons.  First, racial demographics play a much larger role downstate in drawing districts than partisan data.  We don’t have up-to-date racial data with the voting districts, and given the rapid shifts in NYC neighborhoods, it’s really needed.  Second, I don’t know very distinctly the residences of existing reps.  I can say I think the Democrats should have 2-3 majority-black districts (one in Queens, 1-2 in Brooklyn), and 3 majority Latino districts (2 in Bronx, one in Brooklyn and Queens).  

I should also note that in keeping with NY law, I in all cases but one did not split up townships or cities.  the exception was Rockland County.  This was partially because Rockland County has huge “towns” similar to Long Island which were split under the old map.  It’s also because within the towns there are huge ideological ranges, with Hasidic areas which were 90% McCain next to black areas which were 90% Obama.  

Anyway, all of these seats should be reasonably safe for the incumbents.

Away we go…in descending order.

NY-27:

Incumbent: Brian Higgins

D+10

One of the four upstate districts which keeps its old number.  Draws in tightly to Buffalo and becomes far more Democratic.

NY-26:

Incumbent: Tom Reed

R+7

Tom Reed gets a more compact district which hews closely to the southern tier, while taking in some narrowly Republican suburbs south of Buffalo.  A bit more Republican than his old seat.  

NY-25:

Incumbent: Chris Lee

R+9

The district is essentially NY-26.  It gets smoothed out a bit, but still maintains itself as being mainly Republican suburbs of Buffalo and Rochester, with some rural areas in-between.  Is more Republican than the old seat.  

NY-24:

Incumbent: Louise Slaughter

D+10

The earmuffs are gone!  Instead, the district takes in the more Democratic suburbs of Rochester, then makes a beeline Southeast to take in Icatha.  This is a little less Democratic than the old seat, which was D+15, but it’s still quite safe.  

NY-23:

Incumbent: Bill Owens

D+6

The second Upstate district which doesn’t change numbers.  Bill Owens keeps the four most Democratic counties in North Country.  He gets added to his district Syracuse, the most Democratic-leaning suburbs of it, and a salient connecting the two.  A bit of a ugly gerrymander, but what can you do?  

NY-22:

Incumbent: Richard Hanna

R+5

The district is broadly similar to the old NY-24, in that it still forms a U around Syracuse, although the U is much tighter.  The district is marginally better than the old R+2.  

NY-21:

Incumbent: Paul Tonko

D+6

Another district not switching numbers.  It changes quite a bit, although it remains Albany-focused, shedding some of the more Republican areas to the west, but adding some Democratic-leaning areas in the mid-Hudson region.  The PVI is essentially unchanged.  

NY-20:

Incumbent: Chris Gibson

R+6

This district transforms quite a bit.  It loses all of Duchess and most of Columbia counties, and swaps them for conservative areas mostly swiped from NY-23.  Significantly better than the old PVI of R+2

NY-19:

Incumbent: Maurice Hinchey

D+5

This is more or less the old NY-22.  It is more compact, having lost Icatha, but gained  Poughkipsie.  The PVI declined by one from the old PVI (D+5), but it should still be a solid seat for the Democrats.  

NY-18:

Incumbent: Nan Hayworth

R+7

A major improvement from the old district, which had a PVI of R+3.  Admittedly, the heavy gerrymandering of Rockland County helped a lot.  I’m guessing that if I followed village lines I would have been less questionable here, but I think even with that the PVI shouldn’t have declined much.  

NY-17:

Incumbent: Nita Lowey

D+9

Basically NY-18.  Still Westchester based, with a bit of Orange.  PVI is identical to the old district.  

At the end, I was left with a sliver of Westchester County at the bottom of the map – Mount Vernon, Pelham, and the southern portions of New Rochelle and Yonkers.  I could have gone two ways with this, either keeping Elliot Engle’s seat, but making it more compact (containing these regions and the non-Latino sections of the Bronx), or if I chose to eliminate his seat, splitting the region between several NYC-based districts.  I think the former would have been easier.  

Anyway, love to hear thoughts.  I think in retrospect I could have done better with NY-19, and I’m unsure if NY-18 is legal under New York law, but besides that I think this is a pretty good map.  

“Start spreading the blues…I want to be a part of it, New York, New York.”

In a perfect world, with New York losing a seat in the 2010 reapportionment, we could create 28 districts that would, more-or-less, give the Democrats a shot at winning 27 of them, some more easily than others. To do this, I had to ignored political reality, as you will see in the way districts were shaped (e.g. the sole GOP district or Staten Island’s bifurcation). As a corollary to ignoring political reality, I also did not attempt to make as many completely safe Dem seats as possible; otherwise, it would have been difficult to create 27 legitimately lean-Dem or better seats. However, I believe I did a fairly good job of creating favorable numbers for New York Democrats, at least in the sense that President Obama only won three of the 27 Democratic districts by less than 10% in 2008.

Note: I actually did this back in November ’10 but only now am I posting my efforts. It’s possible that updates have occurred to New York’s data since then. Also, I’m aware that New York ended up losing two seats in reapportionment, not just one as I originally thought while drawing this up.

Given that the great majority of Republican vote in New York lies Up State, I started out with the 28th district and sought out the most Republican voting districts. What I ended up creating was essentially a large U. How perfect for “Up State,” don’t you think?

Here’s how the northern part of New York turned out:

Photobucket

And here is the data for the eight most easily seen districts here, 20 through 28. Note that “Dev.” is deviation from the ideal population for each district. I believe the rest of the data is self-explanatory.

Photobucket

Unsurprisingly, the least diverse district in the state is the U-district, 28, with a stunning 95% white percentage, something one only sees in Utah. Or Wyoming. Clearly, this district would get struck down in any court outside of North Carolina or Florida. But I think people in Batavia, Elmira, Little Falls, and Johnstown actually have a lot in common and would enjoy having a common Member of Congress to represent their roughly 225-mile long district.

Among the Dem-tilting districts, District 22 is the only one to have an under D+10 net based on the 2008 election as the east coast of Lake Ontario is not the most liberal place in the state.

As we move further south in the direction of the city, we find Districts 18 and 19, both exurban and suburban.

Photobucket

And their info:

Photobucket

Just below these two is CD-17, and its image allows us to see the little part of CD-18 that stretches down below the previous shot of it (around White Plains, and Rye below that).

Photobucket

And CD-17’s info:

Photobucket

Now we get into the bluest part of the city, specifically the Bronx and upper Manhattan:

Photobucket

Here are the nice numbers:

Photobucket

Moving down the peninsula and east, we see Lower Manhattan and western Queens:

Photobucket

Numbers:

Photobucket

Getting a little out of order in CD numbers (I don’t feel like re-numbering), we’ll move down to Brooklyn and Staten Island. Clearly, in real life Staten Island would be very difficult to divide politically. However, for the sake of creating Dem-leaning or safe districts, it is absolutely vital to split up the Staten Island vote. And that is what I have done here, creating two Brooklyn-Staten Island districts. Additionally, the backward-S Brooklyn-based CD-6 and almost completely Brooklyn-based backward-C CD-9 can be seen here:

Photobucket

And the info for those four districts:

Photobucket

Moving back up into Queens, we find CD-10 which slightly abridges the Kings and Queens County border to cut into northern Brooklyn.

Photobucket

And CD-10’s numbers:

Photobucket

Next, CD-11 stretches across northern Queens and into northwestern Nassau. Since it’s an awkward district to get a picture of with Dave’s App, this picture will serve as kind of an update on where we are at this point:

Photobucket

Photobucket

Now we’ve reached the challenge of Long Island. Honestly, creating the U-district was easy compared to all the time I spent adjusting the borders of these districts in an attempt to get the most Dem-leaning districts possible.

First, CDs 4 and 5. CD-4 crosses southern Queens, Nassau, and even has one voting district from Suffolk County in its boundaries. Meanwhile, CD-5 does the same, stretching from the Queens’ coast to even deeper into Suffolk.

Photobucket

And the info for these two districts:

Photobucket

CD-3 also crosses from Queens to Suffolk, clearly to get more Dem votes to make up for the Republican lean of some of the Long Island areas this district crosses.

Photobucket

CD-2 covers the southern and eastern coast of much of Long Island (“Strong Island” to quote a former roommate of mine from there). It is tied with CD-19 as the least Democratic district besides CD-28. Meanwhile, CD-1 covers the remaining northern half but reaches into some Democratic stretches of Nassau to gain votes.

CD-2:

Photobucket

And a somewhat better shot of CD-1:

Photobucket

Finally, the info for CDs 1, 2, and 3:

Photobucket

In sum, here’s a table of all the districts and their statistics:

Photobucket

Thanks for reading my first diary.

New York State Senate Redistricting: 43-19

After only two years of a slim 32-30 Democratic majority in the New York State Senate, Republicans in this past election barely took back the chamber that they had previously held continuously for more than forty years. People around the country endlessly ask the question: how is it possible that Republicans have a majority of state senators in a state as “blue” as New York?

There is no simple answer to that question. Sufficed it to say, one of the most important factors is gerrymandering. Republicans did a masterful job of redistricting a very favorable map for themselves ten years ago. The current map is littered with Republican senators holding light blue Obama districts all over Long Island (9-0 Republican) and Upstate (21-4). With the great help of Daves Redistricting App 2.0, I set about in the task of redistricting New York's State Senate districts with three main goals in mind: 1.) connect Democratic towns and cities in Long Island, 2.) preserve majority-minority districts in New York City, and 3.) consolidate small cities Upstate. Much of the basis for my analysis comes from jeffmd's excellent post on the State Senate written in 2009 in which he looked at the numbers for the current districts. Inspecting the presidential toplines, it was determined that the cutoff between Republican and Democratic districts is about 58-60% Obama. My map uses that percentage as the benchmark. It would create 10 Democratic districts at over 58% in Upstate New York and another four at over 62% in Long Island. Combined with New York City, this would be more than enough to give Democrats a two-to-one majority in the State Senate. So without further ado, here is what I came up with:

New York 


District Pop. Center Pop. Wh% Bl% Asn% Hisp% Oth%
O% M%
D 1 Hamptons 318633 66 11 3 17 2
62 38
R 2 Brookhaven 318569 89 2 2 6 1
49 51
R 3 Lindenhurst 318229 89 2 1 6 1
47 53
D 4 Huntington 318189 60 17 3 18 2
63 36
R 5 Smithtown 318668 91 1 3 4 1
46 54
R 6 Massapequa 318525 90 0 3 5 1
44 56
D 7 Great Neck 318243 67 12 8 11 2
64 35
D 8 Hempstead 318681 51 26 3 18 2
69 31
R 9 Garden City 318620 86 1 5 7 1
43 56
D 10 Jamaica 317030 9 55 9 15 12 Black Majority 92 8
D 11 Bayside 317619 60 5 18 13 3
62 37
D 12 Astoria 315924 42 5 13 34 5
78 21
D 13 East Elmhurst 318053 15 9 16 57 3 Hispanic Majority 81 18
D 14 St. Albans 318613 22 55 4 13 5 Black Majority 82 17
D 15 Forest Hills 316488 59 5 15 17 5
63 36
D 16 Flushing 317432 24 3 48 21 4 Asian Plurality 68 31
D 17 Bushwick 317715 13 13 7 60 6 Hispanic Majority 87 12
D 18 Bedford-Stuyvesant 317273 26 51 2 17 4 Black Majority 90 9
D 19 Canarsie 317538 28 52 3 14 3 Black Majority 83 17
D 20 Brooklyn Heights 318797 25 51 3 18 3 Black Majority 93 6
D 21 Prospect 318898 19 51 5 22 3 Black Majority 92 7
D 22 East Flatbush 317890 21 56 6 12 5 Black Majority 85 14
R 23 Homecrest 316816 81 1 11 6 2
33 67
D 24 Brighton Beach 317711 56 6 21 13 3
55 44
D 25 North Shore 318201 49 13 10 24 4
66 34
R 26 Arden Heights 323582 84 1 6 7 1
37 62
D 27 East Village 311559 45 6 27 19 3
84 15
D 28 Upper East Side 309905 83 3 8 5 2
75 24
D 29 Upper West Side 310495 73 5 8 11 2
85 14
D 30 Spanish Harlem 309111 22 23 3 50 2 Hispanic Majority 91 8
D 31 Bedford Park 308720 12 19 5 61 3 Hispanic Majority 90 9
D 32 Harlem 309836 2 61 1 33 2 Black Majority 97 2
D 33 Washington Heights 309056 22 12 4 60 2 Hispanic Majority 90 9
D 34 Soundview 309592 10 28 3 55 3 Hispanic Majority 90 10
D 35 Belmont 308704 21 21 3 53 2 Hispanic Majority 84 16
D 36 Mount Vernon 309493 14 60 2 20 4 Black Majority 92 8
D 37 Harrison 309361 73 7 5 13 2
61 38
D 38 Yonkers 309287 56 14 5 21 3
64 35
D 39 Ossining 309454 76 7 3 13 1
59 40
D 40 Clarkstown 317946 72 10 5 10 2
53 47
R 41 Carmel 321768 88 3 2 6 1
46 53
D 42 Poughkeepsie 317728 71 12 2 13 2
58 41
D 43 Kingston 320216 85 6 1 6 2
60 38
D 44 Troy 317388 86 6 3 3 2
58 40
D 45 Plattsburgh 317612 94 2 1 2 2
58 40
D 46 Albany 315314 84 9 2 3 1
63 35
R 47 Moreau 317511 96 1 1 1 1
49 49
R 48 Rome 317470 91 4 1 3 1
44 54
D 49 Syracuse 317634 80 12 2 3 3
62 36
R 50 Utica 317412 91 4 1 2 1
54 45
R 51 Herkimer 316544 96 1 0 2 1
45 53
R 52 Blooming Grove 319845 90 3 1 4 1
46 52
D 53 Ithaca 318178 87 4 3 3 2
61 38
R 54 Penn Yan 317011 95 2 0 2 2
47 51
R 55 Perinton 316789 92 3 3 2 1
51 47
D 56 Rochester 318289 60 26 3 9 2
72 27
R 57 Corning 317311 95 1 1 1 2
42 56
D 58 Amherst 317906 80 14 2 2 1
61 38
R 59 Hamburg 318084 94 1 1 2 2
49 49
D 60 Buffalo 317816 67 23 1 6 3
69 29
R 61 Batavia 318545 94 2 0 2 1
41 57
R 62 Greece 318537 93 3 1 2 1
46 52

Note, also, that I broke the state into four regions for simplicity: Upstate, Westchester/Bronx/Manhattan, Brooklyn/Queens/Staten Island, and Long Island. Here is another table that breaks down the numbers by region:

Region County Population Districts (+/-) 316280 (+/-)
Long Island Suffolk 1516544


Nassau 1349555


2866099 9 0 318323 0.6
New York City Queens 2320449


Brooklyn 2588844


Staten Island 496246


5405539 17 1 317972 0.5

Manhattan 1646675


Bronx 1415056


Westchester 961565


4023296 13 1 309484 -2.1
Ustate New York Rockland 301308


Other 7010169


7311477 23 -2 317890 0.5

As you can see from the table, I redraw the map so that NYC gained two seats at the expense of Upstate New York, while Long Island remained the same at 9 districts. The population of each district in each region is very equal with the greatest deviation of -2.1% below the ideal population in the region of Westchester/Bronx/Manhattan. The rest of the seats compensate for this by being about .5% above the ideal. Before discussing the statewide changes that would occur under this redistricting plan, first let me go through the four regions themselves…

Long Island


District Pop. Center Pop. Wh% Bl% Asn% Hisp% Oth% O% M%

D 1 Hamptons 318633 66 11 3 17 2 62 38

R 2 Brookhaven 318569 89 2 2 6 1 49 51 Ken LaValle-1, Port Jefferson
R 3 Lindenhurst 318229 89 2 1 6 1 47 53 Lee Zeldin-3, Shirley Owen Johnson-4, West Babylon
D 4 Huntington 318189 60 17 3 18 2 63 36

R 5 Smithtown 318668 91 1 3 4 1 46 54 John Flanagan-2, East Northport Carl Marcellino-5, Syosset
R 6 Massapequa 318525 90 0 3 5 1 44 56

D 7 Great Neck 318243 67 12 8 11 2 64 35

D 8 Hempstead 318681 51 26 3 18 2 69 31 Charles Fuschillo-8, Merrick Dean Skelos-9, Rockville Centre
R 9 Garden City 318620 86 1 5 7 1 43 56 Kemp Hannon-6, Garden City Jack Martins-7, Mineola

(The table above is a portion derived from the table in the intoduction. However, included in this table and the three that are to follow it, the number for each district has a link to a picture of that district's new boundaries. Also, I included the incumbent senators in whichever district that they would live in if my map went into affect. Each senator's party is denoted by the font color, and the data entries include the number district that each senator currently represents in the State Senate, as well as where they live and a link to their official biographies.)

Long Island has been the province of Republicans in the New York State Senate for many decades. At the height of the Democratic wave in 2008, Long Island elected only two Democratic senators out of nine total. Both of them lost their seats in this last election, returning Long Island to its usual position of having only Republicans represent them in the State Senate. It's not as though Long Island is that conservative overall — indeed, all but one of the current nine senate districts in Nassau and Suffolk Counties was won by Obama. Republicans have been very effective in diluting Democratic votes, thereby allowing many independents who fear a complete Democratically-controlled Albany to elect Republican candidates for the State Senate.

Of the eight Obama-voting Long Island Senate districts, none of them were won by more than about 55%, which is a very managable percentage for incumbent GOP senators, including the new Majority Leader Dean Skelos, who hails from Rockville Centre in Nassau County. In this region, the goal was to be realistic about what could be achieved and very cautious in achieving it. I drew up four Democratic districts each at over 62% for Obama.

Three out of the four new Democratic districts that I created are left open for any Dem who wants them. The most Democratic district in the region — SD-8, based in Hempstead and Long Beach — is occupied by Skelos and Senator Charles Fuschillo. As the Black and Hispanic populations are spread throughout Long Island, each district retains their white majority.


Queens, Brooklyn, and Staten Island


District Pop. Center Pop. Wh% Bl% Asn% Hisp% Oth%
O% M%


D 10 Jamaica 317030 9 55 9 15 12 Black Majority 92 8 Shirley Huntley-10, Jamaica

D 11 Bayside 317619 60 5 18 13 3
62 37 Tony Avella-11, Whitestone

D 12 Astoria 315924 42 5 13 34 5
78 21 Michael Gianaris-12, Astoria

D 13 East Elmhurst 318053 15 9 16 57 3 Hispanic Majority 81 18

Jose Peralta-13, East Elmhurst


D 14 St. Albans 318613 22 55 4 13 5 Black Majority 82 17 Malcolm Smith-14, St. Albans

D 15 Forest Hills 316488 59 5 15 17 5
63 36


D 16 Flushing 317432 24 3 48 21 4 Asian Plurality 68 31 Toby Ann Stavisky-16, Flushing

D 17 Bushwick 317715 13 13 7 60 6 Hispanic Majority 87 12 Joseph Addabbo-15, Ozone Park Martin Malave Dilan-17, Bushwick
D 18 Bedford-Stuyvesant 317273 26 51 2 17 4 Black Majority 90 9


D 19 Canarsie 317538 28 52 3 14 3 Black Majority 83 17 John Sampson-19, Canarsie

D 20 Brooklyn Heights 318797 25 51 3 18 3 Black Majority 93 6 Valmanette Montgomery-18, Boerum Hills Eric Adams-20, Crown Heights Daniel Squadron-25, Brooklyn Heights
D 21 Prospect 318898 19 51 5 22 3 Black Majority 92 7 Kevin Parker-21, Flatbush

D 22 East Flatbush 317890 21 56 6 12 5 Black Majority 85 14


R 23 Homecrest 316816 81 1 11 6 2
33 67 Martin Golden-22, Bay Ridge

D 24 Brighton Beach 317711 56 6 21 13 3
55 44 Carl Kruger-27, Sheepshead Bay

D 25 North Shore 318201 49 13 10 24 4
66 34 Diane Savino-23, Staten Island

R 26 Arden Heights 323582 84 1 6 7 1
37 62 Andrew Lanza-24, Great Kills

While much of Staten Island remains a stubborn Republican bulwark, Queens and Brooklyn voted overwhelmingly for Barack Obama in 2008. They are home to most of New York City's black population, as well as significant Hispanic and Asian communities. Since this area of the state is so heavily Democratic, the overriding goal for this region was not to squeeze out more Democratic seats, but to strengthen a few shaky ones and create new Voting Rights Act (VRA) districts wherever possible. Under my plan, this region would gain one additional seat as a result of new population estimates given by the Census Bureau. 

This map preserves the two African-American majority districts in Queens and adds a fifth black majority district to the four that already exist in Brooklyn. One of the best things about this map is that it creates an Asian plurality district that is based in Flushing and spread throughout many parts of Queens. The 16th district is currently represented by Sen. Toby Ann Stavisky, but if the Asian community were able to unite around a consensus candidate, she could well be displaced in a primary. I found it impossible to make the 16th District any more heavily Asian than 48%, but the next largest racial community was 24% of the population, so if Stavisky were to retire, this would most likely go to an Asian candidate. It also preserves the two Hispanic majority districts in Queens and Brooklyn.

The recently-flipped 11th and 15th Districts would be strengthened for the Democrats. Carl Kruger's 27th district in southern Brooklyn would be radically changed into the 24th district, both strengthening our vote there and also allowing for a primary challenge to the less-than-venerable “Amigo.” At 55% for Obama, the 24th is one of two districts that I created below the magic 58% line that I still counted in the Democratic column — largely because presidential voting patterns in southern Brooklyn are volatile and not necessarily indicative of a broader ideological differentiation. What Republican-leaning communities that do exist here would be consolidated into two large McCain majority districts: the 23rd in southern Brooklyn and the 26th in southern Staten Island, both of which are currently represented by Republican Senators anyway.


Manhattan, Bronx, and Westchester County


District Pop. Center Pop. Wh% Bl% Asn% Hisp% Oth%
O% M%

D 27 East Village 311559 45 6 27 19 3
84 15

D 28 Upper East Side 309905 83 3 8 5 2
75 24 Liz Krueger-26, Upper East Side
D 29 Upper West Side 310495 73 5 8 11 2
85 14 Thomas Duane-29, Upper West Side
D 30 Spanish Harlem 309111 22 23 3 50 2 Hispanic Majority 91 8 Jose Serrano-28, Spanish Harlem
D 31 Bedford Park 308720 12 19 5 61 3 Hispanic Majority 90 9 Gustavo Rivera-33, Kingsbridge Heights
D 32 Harlem 309836 2 61 1 33 2 Black Majority 97 2 Bill Perkins-30, Harlem
D 33 Washington Heights 309056 22 12 4 60 2 Hispanic Majority 90 9 Adriano Espaillat-31, Washington Heights
D 34 Soundview 309592 10 28 3 55 3 Hispanic Majority 90 10 Ruben Diaz-32, Soundview Jeffrey Klein-34, Throgs Neck
D 35 Belmont 308704 21 21 3 53 2 Hispanic Majority 84 16

D 36 Mount Vernon 309493 14 60 2 20 4 Black Majority 92 8 Ruth Hassel-Thompson-36, Williamsbridge
D 37 Scarsdale 309361 73 7 5 13 2
61 38 Suzi Oppenheimer-37, Mamaroneck
D 38 Yonkers 309287 56 14 5 21 3
64 35 Andrea Stewart-Cousins-35, Yonkers
D 39 Ossining 309454 76 7 3 13 1
59 40

This region, encompassing Manhattan, Bronx, and Westchester County, is the most strongly Democratic area in one of the most Democratic-leaning states in the Union. It is home to the largest Hispanic communities in the Northeast United States — mostly Peurto Rican, but also Dominican, Mexican, and other Latin American heritages. The white communities here also tend to be much more liberal than their counterparts in Brooklyn, Queens, and Staten Island. That is especially the case in Manhattan and Westchester, which are home to many educated urban white professionals.

All twelve districts here are represented by Democrats in the State Senate. That would stay the same under my plan, except for the addition of a thirteenth Democratic district. This is the second distric that comes at the expense of Upstate New York — the other one being in Brooklyn.

Both majority African-American districts would remain intact. The map also adds another Hispanic-majority district to the four that currently exist.

Upstate New York


District Pop. Center Pop. Wh% Bl% Asn% Hisp% Oth% O% M%

D 40 Clarkstown 317946 72 10 5 10 2 53 47 David Carlucci-38, Clarkstown
R 41 Carmel 321768 88 3 2 6 1 46 53 Greg Ball-40, Patterson

D 42 Poughkeepsie 317728 71 12 2 13 2 58 41 Bill Larkin-39, New Windsor Stephen Saland-41, Poughkeepsie
D 43 Kingston 320216 85 6 1 6 2 60 38

D 44 Troy 317388 86 6 3 3 2 58 40 Hugh Farley-44, Schenectady
D 45 Plattsburgh 317612 94 2 1 2 2 58 40 Betty Little-45, Queensbury Patty Ritchie-48, Heuvelton
D 46 Albany 315314 84 9 2 3 1 63 35 Neil Breslin-46, Albany James Seward-51, Milford
R 47 Moreau 317511 96 1 1 1 1 49 49 Roy McDonald-43, Stillwater
R 48 Rome 317470 91 4 1 3 1 44 54 Joseph Griffo-47, Rome
D 49 Syracuse 317634 80 12 2 3 3 62 36 David Valesky-49, Oneida John DeFrancisco-50, Syracuse
R 50 Utica 317412 91 4 1 2 1 54 45

R 51 Herkimer 316544 96 1 0 2 1 45 53

R 52 Blooming Grove 319845 90 3 1 4 1 46 52 John Bonacic-42, Mount Hope
D 53 Ithaca 318178 87 4 3 3 2 61 38 Thomas Libous-52, Binghamton Michael Nozzollio-54, Fayette
R 54 Sodus 317011 95 2 0 2 2 47 51

R 55 Perinton 316789 92 3 3 2 1 51 47 James Alesi-55, East Rochester
D 56 Rochester 318289 60 26 3 9 2 72 27

R 57 Corning 317311 95 1 1 1 2 42 56 Thomas O'Mara-53, Big Flats Catharine Young-57, Olean
D 58 Amherst 317906 80 14 2 2 1 61 38 Tim Kennedy-58, Buffalo
R 59 Hamburg 318084 94 1 1 2 2 49 49 Pat Gallivan-59, Elma Mike Ranzenhofer-61, Clarence
D 60 Buffalo 317816 67 23 1 6 3 69 29 Mark Grisanti-60, Buffalo
R 61 Batavia 318545 94 2 0 2 1 41 57

R 62 Greece 318537 93 3 1 2 1 46 52 Joe Robach-56, Greece George Maziarz-62, Newfane

Here more than anywhere else in the state, Republicans dominate in local and state politics. Recently, Democrats lost five of their ten Upstate congressional districts. This is also where Republicans picked up two Senate seats and gained about a half-dozen Assembly seats last fall. Nevertheless, there are still many strongly Democratic areas of Upstate New York: mostly medium- and small-sized cities and liberal inner-suburbs that dot the landscape from the Hudson Valley to the Great Lakes. The goal was to consolidate those areas and churn out as many new Democratic districts as possible. Here again, as in Long Island, the minority ethnic populations are too spread out to create any VRA districts. Instead, this is where the great bulk of Republican Senate seats would hit the buzz-saw.

The region as a whole would lose two seats, mostly from the equalization of populations in each Senate district — which Republicans largely disregarded during the last redistricting ten years ago — as well as the much greater population growth downstate.

I was able to get about half of these 23 districts in the Democratic column. The 40th District, based in Rockland County, is the second of only two districts in this entire map (the other being in southern Brooklyn) that I counted as a Democratic district even though Obama's vote there was less than 58%. The reason is that this seat was one of very few elected offices around the country that Democrats actually gained from the Republicans in this last election. The seat would also bolster its Democratic vote through redistricting, so I figured, if David Carlucci could pick it up for the Dems in a year like 2010, odds are pretty good that he'll be able to hold it in a lot of other political environments.

I was able to get ten of these districts at over 58% for Obama. One of the most certain Democratic gains under this plan would be my native 56th Senate District, based in the City of Rochester and the Town of Brighton. Republican Senator Joe Robach has vexingly been able to hold onto this district for years despite the fact that it voted by a two-to-one margin for Barack Obama in 2008 (66%-33%). Under this plan, Robach's hometown of Greece would be removed from the 56th and replaced by the Democratic-leaning suburbs of Gates and Irondequoit.

The four seats that we do hold here would be strengthened. The 60th District, which is even more Democratic district than the 56th, voted out a Democratic incumbent last fall. This district would remain largely unchanged in the hope that a different Dem might likely be able to win it back from freshman Republican Senator Mark Grisanti.

As is convention when State Senate seats are redistricted in Upstate New York, I left every town intact. In addition, only two cities are divided between different districts: Buffalo and Tonawanda (just south of Niagra Falls). The self-imposed requirement that towns be left undivided was a major constraint, but it would probably help a plan like this to survive a court challenge.


Summary:

A major drawback of this map is that without realizing it, I redraw the lines with no attention paid to which district each senator lives in. Hence, a lot of Democratic primaries and games of musical chairs would happen in this plan that might otherwise have been avoided. But, by the time I realized it, it was too late. In any event, many more Republicans get stuck together than Democrats, so that serves to counter-balance this problem.

This map pays tribute to the Voting Rights Act by creating three new majority-minority district: a new Black-majority district in Brooklyn, an Asian-plurality district in Queens, and a fifth Hispanic-majority district in the Bronx.

My plan also evens out the population disparities between regions by making every seat within only a few thousands residents off from the ideal population of 316,280 people per district. In applying a fairer division among the state's population and using new population estimates given by the Census, Upstate New York lost two districts to New York City.

I am confident that if this plan went into affect at the next election, Democrats would hold a large 43-19 majority in the New York State Senate for many years to come. But alas, Republicans won back this chamber last year and thus, it is not to be. However, I'm still convinced that with new population estimates, it will be extremely difficult for Republicans to redistrict another map that would allow them to retain the majority. Their luck has simply run out. They may be able to preserve many incumbents in Upstate and Long Island, but remember that Democrats only need to gain one seat for them to retake the majority (a 31-31 tie would allow Democratic Lt. Gov. Bob Duffy to act as the tie-breaker). And as I've shown through this analysis, downstate will have to gain two seats for the next redistricting plan to be in compliance with the Census.

It took many practice tries, but I believe this map provides the strongest possible plan for a large Democratic majority in the Senate that not only respects existing VRA districts, but also creates three new ones. In short, this is the ideal Democratic redistricting plan for the New York State Senate.

NY St. Senate Fair Redistricting: Let the Court Draw It

During the last redistricting, the Democrats and the Republicans allowed for a split redistricting plan: Dems redraw the Assembly, the GOP drew the Senate, and they both drew the House map. Now, with split control again, I think it would be best to allow the Courts to draw the redistricting map, even if it means Dems lose about twenty Assembly seats–Dems already control about 70% of the vote share!

So, I tried to draw the map as if I were the courts. Sorry if my naming of colors throws you off.

My plan is a fair plan:

I make as many minority-majority seats as I think would be necessary;

No district is designed specifically for any current senator;

County splitting is avoided as much as possible;

Almost all towns are kept together: no joke, there is not a single town outside of Nassau and Suffolk that is split. In Suffolk, Islip is too big, so three precincts are moved to NY-02. In Nassau, some hamlets might be split, but I’m pretty sure there aren’t that many that are;

In the City, I tired to respect racial groups;

Upstate, I tried to keep regions together.

To that end, Democrats would surely take the State Senate under this map. I’ve classified everything from R+1 to D+3 as a swing district. If you give Republicans all swing districts, they’ll only muster 25 seats. Kudos to the 2000 GOP, they made one heckuva map. Can you imagine if Dems made a Senate map? They could easily make 45 seats, but that’s a different story.

Here’s my map:

Photobucket

Photobucket

NY-1 D+1 Blue

South Hampton, Part of Brookhaven

NY-2 R+0 Green

Part of Brookhaven, Three Precincts of Islip

NY-3 D+1 Purple

Rest of Islip

NY-4 R+4 Red

Huntington, Smithtown

NY-5 R+2 Yellow

Babylon, Part of Oyster Bay

NY-6 D+2 Teal

Part of Hempstead

NY-7 D+2 Gray

Part of Hempstead

NY-8 D+3 Bluish Purple

Part of Hempstead, Part of North Hempstead

NY-9 D+1 Turquoise

Part of North Hempstead, Part of Oyster Bay

Photobucket

NY-10 D+14 Pink

Queens

NY-11 D+18 Light Green

Queens

NY-12 D+27 Light Blue

Queens

NY-13 D+27 Beige

Queens

NY-14 D+10 Mustard Green

Queens

NY-15 D+40 Dark Blue

Queens

NY-16 D+27 Orange

Queen, Brooklyn

NY-17 D+44 Lighter Green

Brooklyn

NY-18 R+5 Yellow

Brooklyn

NY-19 D+44 Green

Brooklyn

NY-20 D+42 Light Pink

Brooklyn

NY-21 D+39 Velvet Red

Brooklyn

NY-22 D+28 Brown

Brooklyn

NY-23 R+4 Darker Turquoise

Brooklyn

NY-24 D+12 Dark Purple

Brooklyn, Staten Island

NY-25 R+15 Pinkish Red

Staten Island

NY-26 D+41 Dark Gray

The Bronx

NY-27 D+31 Green

Brooklyn, Manhattan

NY-28 D+31 Dark Pink

Manhattan

NY-29 D+33 Green Gray

Manhattan

NY-30 D+23 Orange Red

Manhattan

NY-31 D+43 Yellow

Manhattan

NY-32 D+39 Red

Manhattan

NY-33 D+43 Blue

The Bronx

NY-34 D+25 Green

The Bronx, Queens

NY-35 D+32 Purple

The Bronx

Photobucket

NY-36 D+37 Orange

The Bronx, Mount Vernon

NY-37 D+9 Blue

Yonkers, New Rochelle

NY-38 D+11 Turquoise

White Plains, Rye

NY-39 D+5 Yellow

Peekskill, Clarkstown

NY-40 R+3 Red

Ramapo, Orangetown

NY-41 EVEN Gray

Middletown, Newburgh

NY-42 R+2 Light Green

Poughkeepsie, Beacon

Photobucket

NY-43 D+6 Pink

Kingston, Hudson

NY-44 D+9 Reddish

Syracuse

NY-45 D+9 Blue

Ithaca, Auburn, Cortland

NY-46 R+6 Prange

Elmira

NY-47 R+6 Light Pink

Rome, Utica, Oneida

NY-48 R+6 Orange

Watertown, Oswego

NY-49 R+1 Red

Binghamton, Vestal, Oneonta

NY-50 R+6 Gray Blue

Gloversville, Amsterdam

NY-51 D+5 Brown

Schenectady, Troy

NY-52 D+8 Dark Green

Albany, Rensselaer

NY-53 D+5 Gray

Plattsburg, Potsdam, Ogdensburg

NY-54 R+2 Light Beige

Saratoga Springs, Glens Falls

NY-55 D+4 Dark Beige

Part of Rochester, Perinton, Geneva

NY-56 D+12 Blue

Rest of Rochester

NY-57 R+11 Green

Olean, Corning

NY-58 R+5 Purple

Jamestown, Dunkirk, Pomfret, Orchard Park

NY-59 D+15 Red

Part of Buffalo, Lackawanna

NY-60 D+8 Yellow

Part of Buffalo, Niagara Falls, Tonawanda, North Tonawanda

NY-61 R+5 Turquoise

Amherst, Lockport

NY-62 R+8 Gray

Greece

Photobucket

Trying to Predict Redistricting in New York

As an ex-New Yorker, I keep my eyes perennially glued to New York politics.  It did not shock me terribly that Republicans took back a fair number of upstate New York house seats.  There were a lot of 27-1 or 28-0 nonsense maps put on this website last winter that failed to take into account that Republicans in New York often vote Democratic for president when they think the national candidate is too extreme but have no problem voting Republican downballot the rest of the way.  This may eventually change, like the voting habits of Dixicrats in the South apparently have, but it will take a while.

What shocked me the most was that it appears that the State Senate, and with it the Democratic trifecta that everyone was counting on last winter, has switched back into narrow GOP control pending the recounts in a few still undeclared State Senate seats.  With the lost of the North Buffalo seat to a Republican candidate, it appears our best hopes lay on working to a 31-31 tie.  Still, even were the lieutenant governor to cast a tie-breaking vote to organize the chamber for the Democrats, we have to keep in mind that there are quite a few scumbags in the delegation (Carl Krueger always tops the list in my view now that Espada and Montserrate are gone) who are more than willing to cut a deal with Dean Skelos (the GOP leader in the State Senate).  I therefore assume the following:

1) The GOP will have a seat at the table with redistricting.  Even with the very best scenario of the state senate breakdown of 31-31, it would be very hard to pass a Democratic gerrymander through the state legislature.  That’s just the reality.  

2) It will be an incumbent protection map that discomfits only those chosen to be drawn out.  

3) Despite Cuomo’s enthusiasm for a commission drawing the maps, it will not be passed in time to affect this round of redistricting and probably won’t be passed ever.  I can hardly ever see Shelly Silver giving up on drawing the State Assembly lines and that’s what it would take for Cuomo’s idea to prevail.  The Democratic leadership of the State Assembly perennially sold their party brothers and sisters over in the State Senate down the river for decades in going along with all the pro-GOP gerrymandering of the State Senate.  I hardly see anything different now.  

So this will be an agreement brokered between 3 men in a room, like the state budget or anything in New York State politics.  (For those of you not from New York or familiar with this phrase, it refers to the governor, the Assembly Speaker (always Democrat) and the State Senate President (usually historically Republican).

4) In addition to protecting the 4 black VRA districts and the 2 Hispanic VRA districts, a 3rd Hispanic district out of Joe Crowley’s currently minority-majority district that is Queens/Bronx will likely have to be passed to pass VRA preclearance.  This complicates greatly the map for downstate in a way that 2000 did not.  I would imagine that one of the three Queens white Democrats (Ackerman, Weiner, Crowley) gets the axe but expect there to be bitter racial tension over this.  Even if the GOP is closed out from redistricting through some act of miracle like the Buffalo state senator deciding to caucus with Democrats and/or Craig Johnson and Suzi Oppenheimer both winning their recounts, all it takes is one or two disgruntled Latino politicians that their constituency isn’t getting their “fair share” of congressional districts for them to bolt tactically to the Republicans.  If you don’t think this is a serious concern, I consult you to the 2001 mayoral election as a textbook example.  Fernando Ferrer sat on his hands – the Bronx Democratic machine did nothing on election day – and Bloomberg won.

So the crux of the matter is that a third Hispanic district will be created, very likely in the Queens/southern and eastern Bronx area.  Despite the fact that Crowley has close ties to Shelly Silver, he seems likeliest to be discomfited the most by the stark demographic realities of New York City.

5) In the past, New York State politicians in Albany have tended to privilege clout above all else.  Anyone who sits on Appropriations (Israel, Hinchey, Lowey, Serrano), Ways and Means (Rangel for now, Crowley, Higgins), or Financial Services because of the state’s ties to Wall Street and the large donations these members can draw (Maloney, Velazquez, Ackerman, Meeks, McCarthy) are generally immune from losing their districts.  I would add to this list Peter King (the incoming chair of Homeland Security – very important in swinging money to NYC and the State which overrides national partisan political objectives) and Slaughter (on Rules, which if the national Democrats get their act together and win back the House, she will again chair).

6) Western New York, which took the brunt the last time will not this time around, even though that is the part of the state that is losing the most population.  Either a prettier version of the dumbells will be created again for Slaughter, or there will be a Buffalo-Niagara Falls and a Rochester-Monroe County district.

7) The Hudson Valley (which gave up the other lost seat in 2002) will also not lose a seat.  Nita Lowey is too powerful to consent to a Westchester brawl between her and Nan Haysworth.  Hinchey’s on the powerful appropriations committee so a Hudson Valley conglomerated district between him and Haysworth also isn’t going to happen, either.  Given the state GOP’s desire to want to protect their most imperiled pickup, Buerkle’s surprise defeat of Dan Maffei in the Syracuse-based district, Hinchey’s elongated Southern Tier-Hudson Valley district will be needed to suck up ultra liberal votes out of Tompkins County.

Therefore, who might get targeted for elimination?

If New York only loses one seat, it seems easy to me to predict the outcome.  Bill Owens and Chris Gibson will be merged together in an Eastern Upstate New York congressional district that combines the northern most counties with the upper Hudson Valley, swooping around Albany.  It would be, depending on how you draw the lines, anywhere between a 52-54% Obama district and truly a “fair fight.”

What I’ve been struggling with is who gets the axe in addition if it’s a two-seat casualty loss and New York only has 27 seats after 2010.  In this scenario, the bipartisan redistricting scenario would require one Democratic and one Republican seat to vanish.  Upstate New York is where they would almost definitely take the Republican seat from.  Bill Owens would be left alone and Hanna and Gibson or Gibson and Haysworth would be merged.

Okay, so far so good.  Which Democrat gets the axe?  Remember, NYC is an universe all to itself and city politicians have a tendency to privilege the maintenance of clout and seniority over all else.  Also, it seems to me that even when I run the numbers on Dave’s redistricting app, a 3rd Hispanic district will still have to likely be created; therefore Crowley is still in a lot of peril one way or the other.

My guess is Eliot Engel of the north Bronx will eventually get the axe.  He is not well-liked in the delegation, nor by the Bronx party machine.  The demographic realities of a two-district loss mean that upstate will push a bit south even with losing one seat (because all of the population growth has been Hudson Valley-South for the past 2 decades at least) and there isn’t enough room in the Bronx to maintain a white district for him.  He sits on Foreign Affairs, which is a plum committee, but for pork barrel and “I scratch your back, you scratch mine” New York parochial politics, that aint good enough when push comes to shove.

The only thing that gives me pause is that when I play with it on Dave’s application, it does make the map a bit messy.  Haysworth swings south a tiny bit, like in the current map, to grab up more Republican-leaning or mixed areas of northern Westchester and northern Rockland.  Lowey takes the rest of Rockland and Westchester easily enough.  Then you would have Nadler swing north into Riverdale and left-over parts of Yonkers not needed in Lowey’s district.  Rangel could then have retain a black-plurality for his district by going into the north Bronx, Mt Vernon and parts of New Rochelle.  And then you would have room enough to create the 3rd Hispanic district in the southeast Bronx/northern Queens areas.  Down in Brooklyn, Grimm gets the heavily McCain precincts, the two black districts expand a bit more in that direction to gain new population, and Anthony Weiner gets the rest of the area that Nadler gives up.  Weiner is exactly the kind of Democrat that these voters would vote for so that’s not a big problem.

My only other guess is what to do out in Long Island.  Is it possible to really help Bishop at the expense of Israel or (ripple effects) McCarthy?  Bear in mind that Peter King has a safe pass given a) his position as the chair of Homeland Security and b) Dean Skelos being a fellow Nassau County Republican.  Realistically also, and this was the major flaw in many of the maps I saw it last year, no New York City politician wants to have to represent Long Island – there is just this hostility between the two regions as well as this narrow parochialism that is a New York City disease (and I can say that being a former New Yawker myself – I absolute refuse to give up rooting for my often lousy Mets).

So Peter King gets a safe GOP district, but unless you go into the City and have some of the City districts come out into the Island a bit, there are only enough Democrats for 2 districts (the current 2nd and 4th, both at 59% Obama performance).

So that’s what I foresee happening; Bishop not being helped all that much (except maybe the removal of Smithtown and the home of Altschuler) with some minority areas of Islip Town being added in its place.  This brings his district up from 52-53% Obama to 55% Obama, not that much of a help frankly.  It would have to be done in such a way not to imperil Israel most of all (as an appropriator he has a tremendous amount of clout) and McCarthy indirectly (because if you have Israel grab black areas in Nassau to compensate for losing minority voters in Islip, you risk imperiling McCarthy).

So the likeliest Democratic casualty if it is a 2-district loss seems to me to be Eliot Engel.  The only other possible scenario that I keep playing in my head is that perhaps Weiner gets the axe with everyone expecting (including himself all these years) that he will run for mayor in 2013.  I also note that he does not sit on any important clout committee – Education and Labor is not important enough in steering resources or in protecting tax provisions for Wall Street for Albany politicians to care much to want to protect him.  Engel still might not out of the woods with this scenario, though.  Might Shelly Silver protect his protege Crowley by drawing Eliot Engel into a Hispanic-majority district, axeing Weiner and drawing Crowley a dream Queens district where he can marshal the Queens Democratic machine behind him?  Intriguing possibilities….

I welcome your thoughts on this.  As someone who, because of my job, now resides in southern Illinois and only comes back to the City 2-3 times a year or to the Hudson Valley (where I’m originally from), my political radar antenna isn’t as perceptive as it might be were I still resident in New York.  

Wyoming Rule – Analysis

Over the past few weeks there has been a flurry of diaries about the Wyoming Rule (California, Texas, New York, Pennsylvania, Tennessee, Maryland, Oregon, New Mexico, and my Washington map below). Many of these diaries asked at the end what they thought about the Wyoming Rule, and the intent of this diary is to examine some of the benefits and drawbacks of the Ruie itself. 

The primary benefit of the Wyoming Rule is that the districts are smaller for many states – or about 75%-80% the size of the current projected district size. California would go from 52 seats to 68, Washington from 10 to 12, and Oklahoma from 5 to 7. Other states would stay the same – Hawaii, Nebraska, and Rhode Island.  (The number of districts for each state was researched by borodino21). The range between states would drop from about 400k (Rhode Island to Montana) to 300k (South Dakota to Alaska).

The smaller district sizes in most states means that there are more opportunities to preserve communities of interest. For some states like North Carolina, this means it may be possible to create additional minority-majority or minority-influence districts. In other states, it may be possible to draw more CDs that encompass only one county or city.

While I do not wish to subscrible to albguy's method of creating as many Democratic districts as possible (while I do enjoy his method of pushing the limits of a redistricting map), the smaller districts may make it harder to create all Democratic seat maps.

In Washington, a more realistic map under the Wyoming Rule likely means two safe(r) Republican seats in Western Washington and two or three safe Republican seats in Eastern Washington. Now perhaps one or two of those districts may be better considered swing districts (especially a Vancouver to Yakama district), but the result of the Wyoming Rule is a 7-5 delegation (compared with the current 5-4 delegation with the possibility of a 6-4 delegation after the 2011 redistricting).

The Wyoming'd New York faces a similar problem. In jsramek's New York – the delegation would be 30 Democrats and 6 Republicans. This map also includes the cracking of Staten Island, which would probably not be politically viable – even for a solidly Democratic state legislature. While this is better than the 8 Republicans representing NY in the 2011-2012 Congress, many of the maps made for the Redistricting Contest would contain 1 or 2 Republicans out of New York's 28 Congressional Districts. 

The resaons for these results is that the smaller district sizes make it more difficult to crack Republican strongholds – or areas without overwhelming the nearby Democratic area. So, back to New York, at least 4 upstate districts are created as Republican vote sinks, instead of the possibilty of spreading them out. In Western Washington, eastern King, Pierce, Thurston and Clark counties are Republican areas, as well as Lewis and most of Cowlitz counties. In some maps, it is possible to divide those populations and combine them with more Democratic areas such as Vancouver, Olympia, Tacoma, and Bellevue to allow for Democrats to win those districts (but as in the 2010 elections, Republicans held on in WA 8 [East King and Pierce County] and won in WA 3 [SW Washington including Olympia]). With smaller districts, you can create two safe Republican districts in those Republican areas in exchange for two additional safe Democratic districts (and possibly another swing district). 

So, where does that leave us?  I think the advantages of the Wymonig Rule outweigh the drawbacks. More representation is better from a democracy standpoint, but it also helps Democrats in the big picture. For all of the concerns about not being able to maximize Democratic seats, the Republicans would not be able to either. In addition, more Congressional seats will also help Democrats in the Electoral College.


Newyorkoming: A 36-seat Democratic Gerrymander

Photobucket

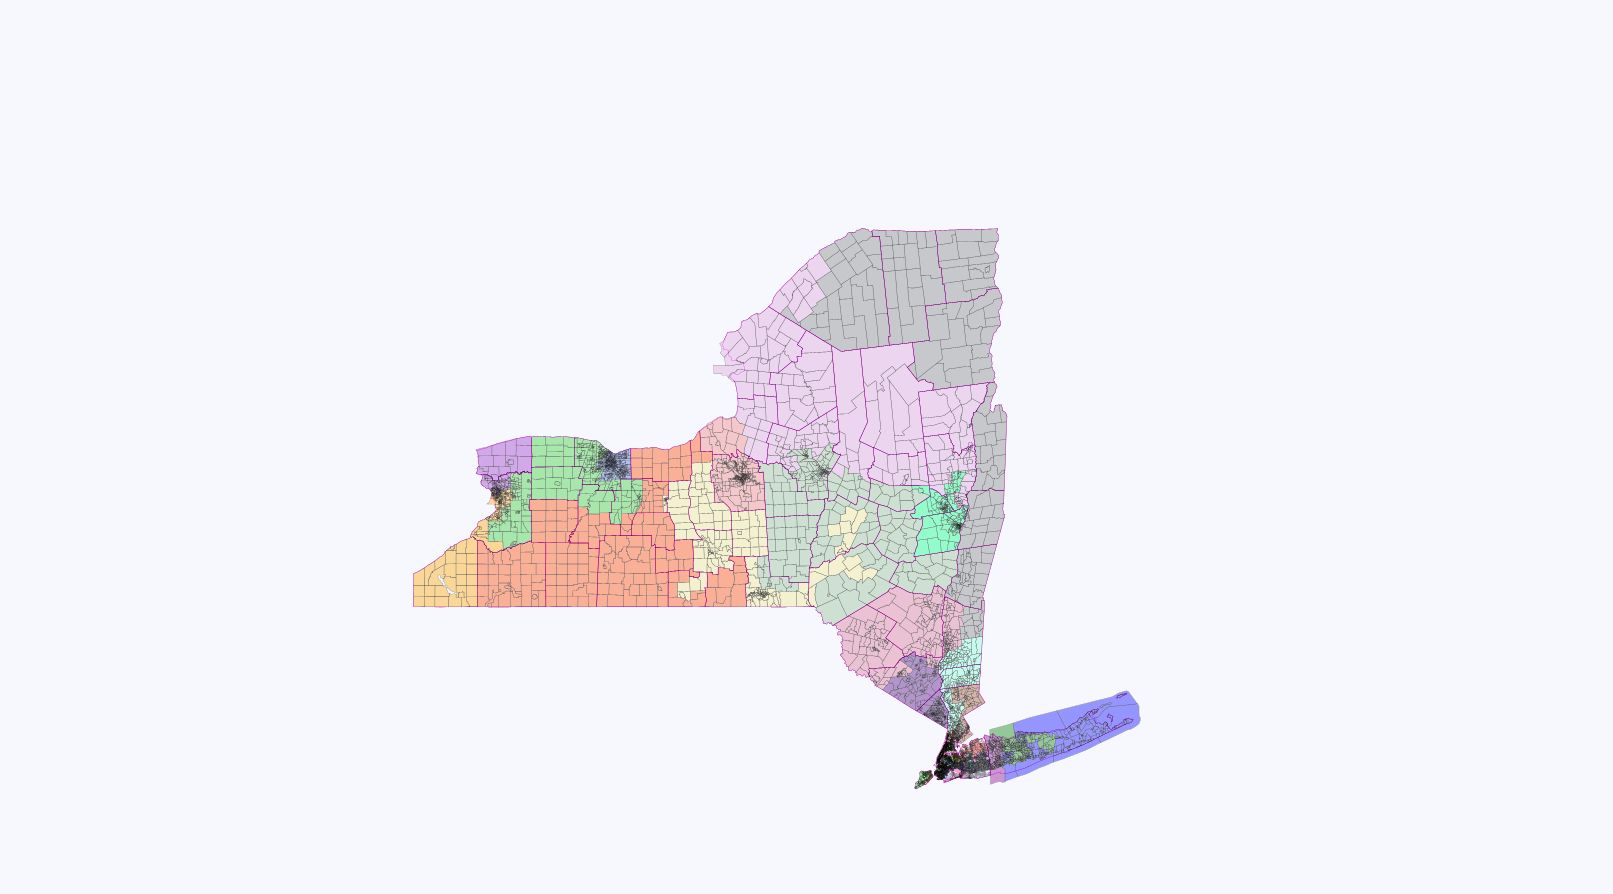
As a thought experiment, I’d figured I try redistricting the state of my birth (and my entire life up to age 30) under the Wyoming Rule discussed elsewhere on this website.  Aside from truly applying “one-man, one vote” by ensuring that residents of the smallest state do not have more of a vote than residents of the 3rd largest, there were other benefits of the Wyoming Rule when applied to New York City.  I was able under this map to create a new Hispanic VRA-compliant district in Queens (and give Valasquez an entire Brooklyn Hispanic district of her own).  In Queens, it was also possible to create an Asian influence “coalition” district that might ensure the election of the first Asian-American congressmember from New York.  And through the creation of several Queens/Nassau hybrid districts, I was able probably to ensure Peter King’s removal from public office (a major goal of mine as he is just terrible).  In the Bronx, with the smaller sized districts, it is possible not only to create another Hispanic VRA district (sorry Eliot Engel) but also an Black VRA district centered on northern Bronx and neighboring Mount Vernon.

Elsewhere, the major purpose of this map was to maximize Democratic-performing districts, particularly Downstate.  I created an open GOP seat in Suffolk County but cracked Peter King’s base and threw him into a 61% Obama district.  Staten Island is divided into two and hence neutered as a possible source of Republican votes.  In the Hudson Valley, three relatively safe Democratic seats were created with just one district with a Republican PVI (and that seat – Rockland/Orange, a reincarnation of the old Ben Gilman seat – is really more Democratic than the Obama percentages suggest).

Upstate, it is very possible to create a Democratic dummymander (as several of the maps on this site did last year in my opinion).  You need to leave some Republican vote sinks.  My map does this, aiming for a 7-4 split north of Maurice Hinchey’s now Hudson Valley-centered district.  Some of the 4 are within reach for an exceptionally strong Democratic candidate but only one of the 7 Democratic seats is realistically within reach for a Republican now.

This map creates just 6 districts where a Republican has a reasonable shot of winning (the new 2nd out in Suffolk County, the 24th in Rockland/Orange, and 4 districts upstate: the 28th and 29th in Central New York/Adirondacks region, and the 32nd and 34th in Western New York.  29 Democratic seats are at 58% Obama or higher, a 30th Democratic PVI seat (Bill Owen’s new 26th) is at 56% Obama, the best you can draw in that area without splitting Albany which I did not want to do.  A 30-6 delegation and not, I believe, a dummymander.  But please let me know what you think.

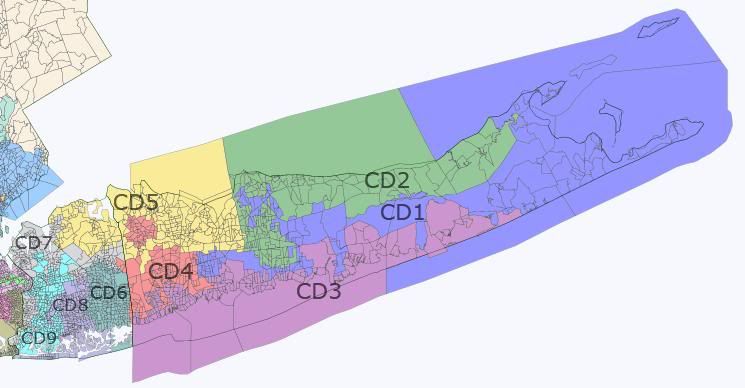
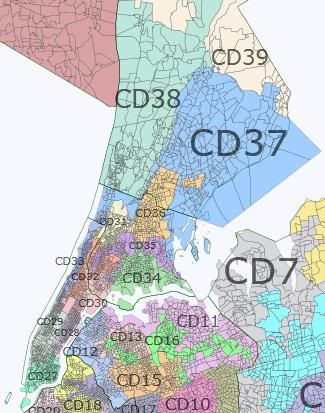
Eastern/Central Long Island (Districts 1-3)

Photobucket

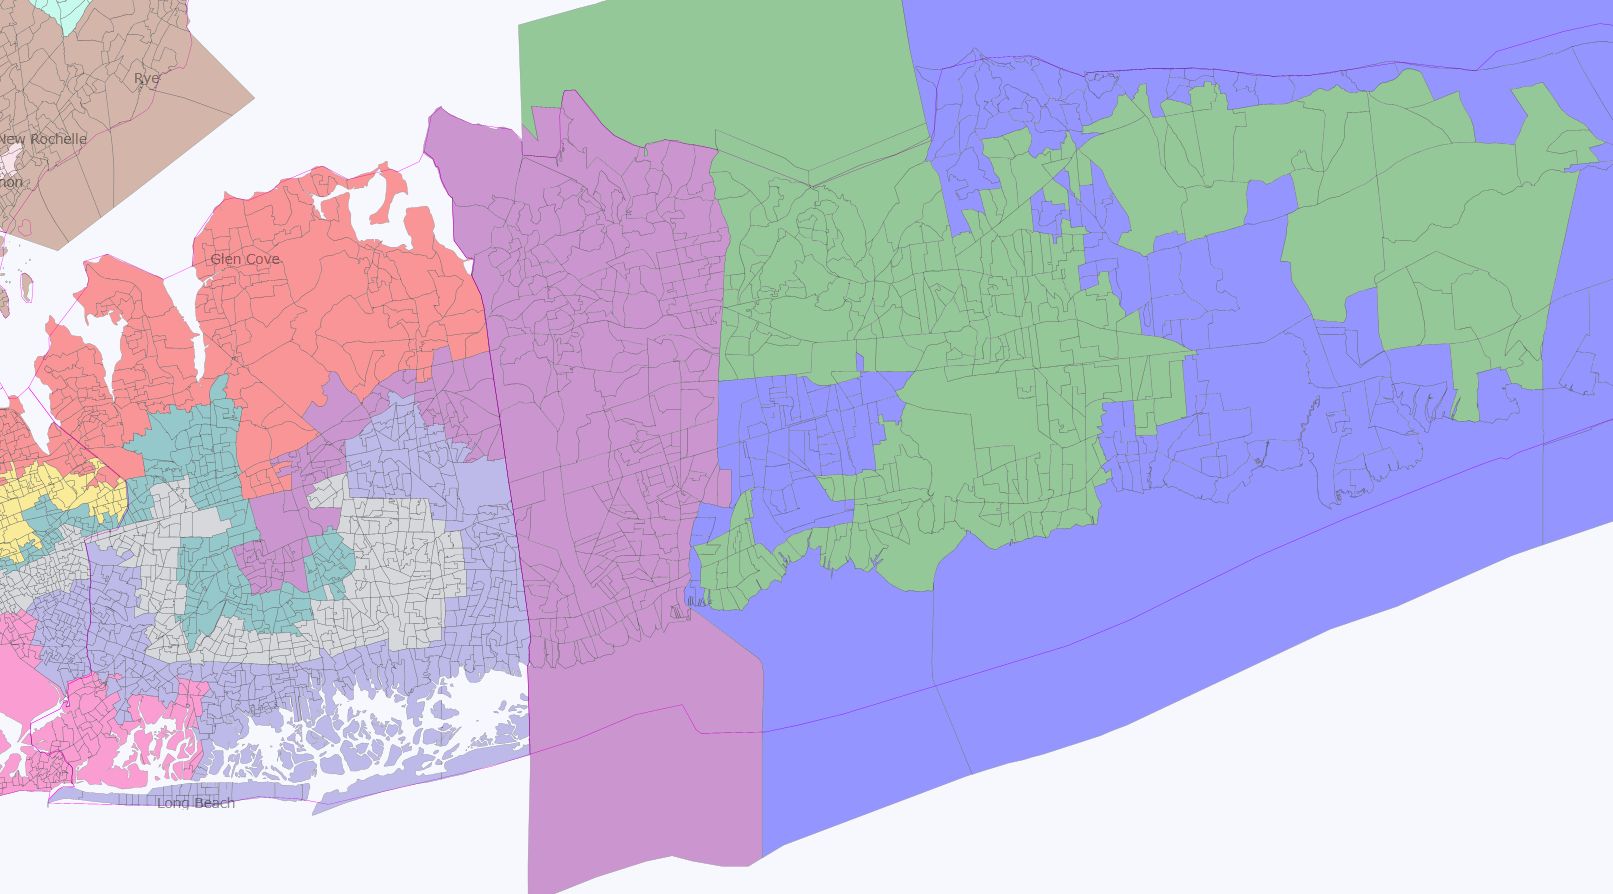
District 1 (Blue) (Bishop (D) if he survives his recount… otherwise it’s his again in 2 years) Obama 59, McCain 40

Lose Republican voting areas in eastern LI and replaces them with Democratic-areas of Islip Town.  Turns a swing district into something more like the current NY-02 or NY-04.  Bishop should now be fine.

District 2 (Green) OPEN LEAN GOP Obama 46, McCain 54

Realistically this GOP vote sink is necessary to protect Bishop and Israel.  I would have drawn Peter King in here but he lives too far away (and as I said, I wanted this map to get rid of that thug of a politician).  Would be the only Republican left in the entire downstate New York delegation.

District 3 Israel (D) (Purple) Obama 59, McCain 41

All of Huntington and Babylon towns in Suffolk, finger into Nassau as currently but extends a bit further down to Hempstead and Uniondale to grab black Democratic voters to push the Obama numbers up.  Israel should like this district.

Nassau/Queens Hybrid Districts (Districts 4-10)

Photobucket

Photobucket

District 4 (Red) Ackerman Obama, 60, McCain 39

North Shore areas of Nassau that Ackerman represented before in the 1990s, non-Asian areas of northern Queens that are in his district now, and Astoria (a new area for Ackerman but put in the district to bring up the Obama numbers).  Helps out the cracking of Peter King by removing parts of his North Shore base.  Although the district drops slightly in Democratic performance from now, Ackerman or another Democrat should be fine.

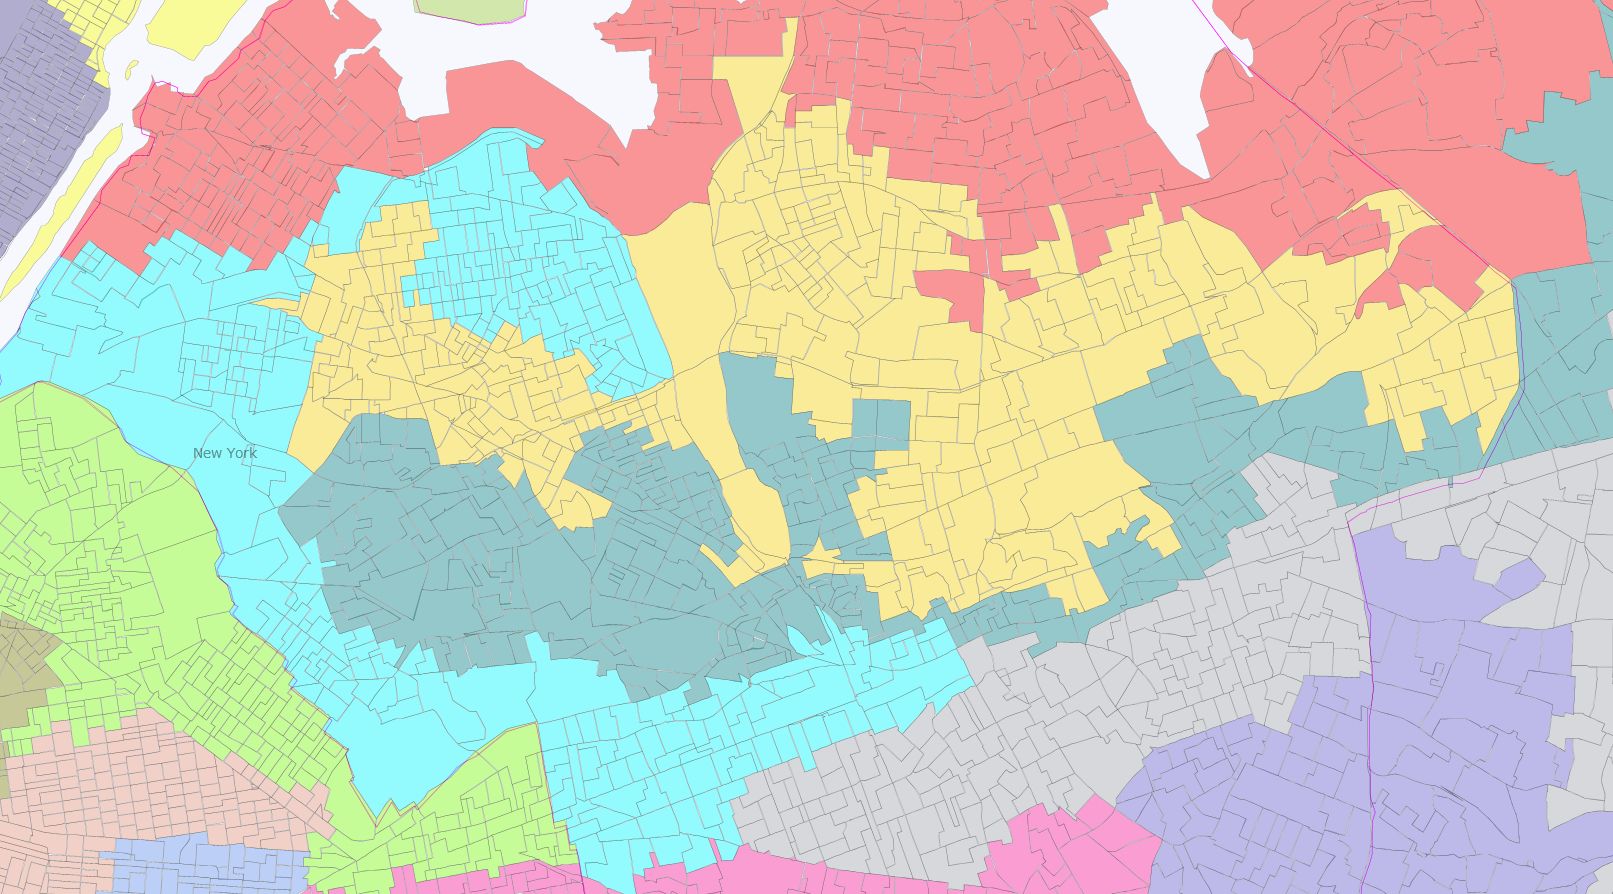
District 5 (Yellow) OPEN ASIAN-INFLUENCE “MINORITY-MAJORITY COALITION” VRA DISTRICT

Obama 69, McCain 30

Asians 39%, Whites 29%, Hispanics 22%, Blacks 6%, Others 4%

If you go to smaller Wyoming-sized districts, you still have to follow the VRA.  But ethnic/racial groups that do not have enough numbers to dominate a 720,000-person district do when we’re talking more like 545,000.  This was the hardest district to draw because Dave’s redistrict app does not color-code high Asian-American census tracts as it does for Blacks or Hispanics.  Luckily, my familiarity with Queens from living in New York City for 6 years helped me somewhat in knowing roughly where Asians reside in Queens.

District 6 (Teal Green) Crowley (D) or Weiner (D) although perhaps Weiner moves back to Brooklyn and runs in my new 14th?  Obama 62, McCain 37

Leftover bits of Queens after drawing a new Hispanic VRA district (the 9th), the Asian-influence VRA district (the 5th), and the current black VRA district centered on South Queens (the 8th).  It then snakes out in Long Island to continue helping crack Peter King.  With a PVI of +9, any generic Democrat should be fine in this district.

District 7 (Gray) McCarthy (D) Obama 61, McCain 38

Dips a bit into Queens to grab excess Blacks not needed for the #10 and helps further crack Peter King by grabbing some redder precincts out of his current district.  And it gets 2% more bluer than currently is the case.  What’s not to like?

District 8 (Purple-Blue) King (R) Obama 61, McCain 39

I think Peter King is finished with this remap.  And where is he going to run if not here?

District 9 (Sky Blue) OPEN VRA HISPANIC DISTRICT

Obama 80, McCain 19

Hispanics 50%, Whites 22%, Asians 14%, Blacks 8%

Barely VRA complaint, but I think it passes legal muster as the nearest demographic group, whites, are 28% less in the district.

District 10 (Pink) Meeks (D) BLACK VRA DISTRICT

Obama 79, McCain 21

Blacks 51%, Whites 26%, Hispanics 16%, Asians 2%

Completes the cracking of GOP voters in Nassau County, and thus Peter King, by sinking the heavily Republican Five Towns and other southwest Nassau GOP areas in a black-majority district that now extends a bit into Brooklyn to equalize its population and gain the necessary blacks to remain VRA complaint.  Meeks should still be fine.

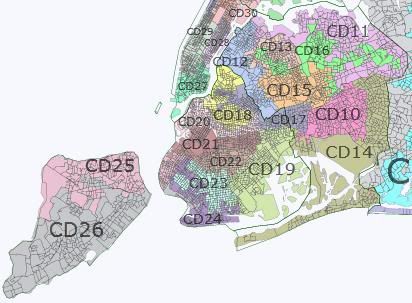
Brooklyn (Districts 11-14)

Photobucket

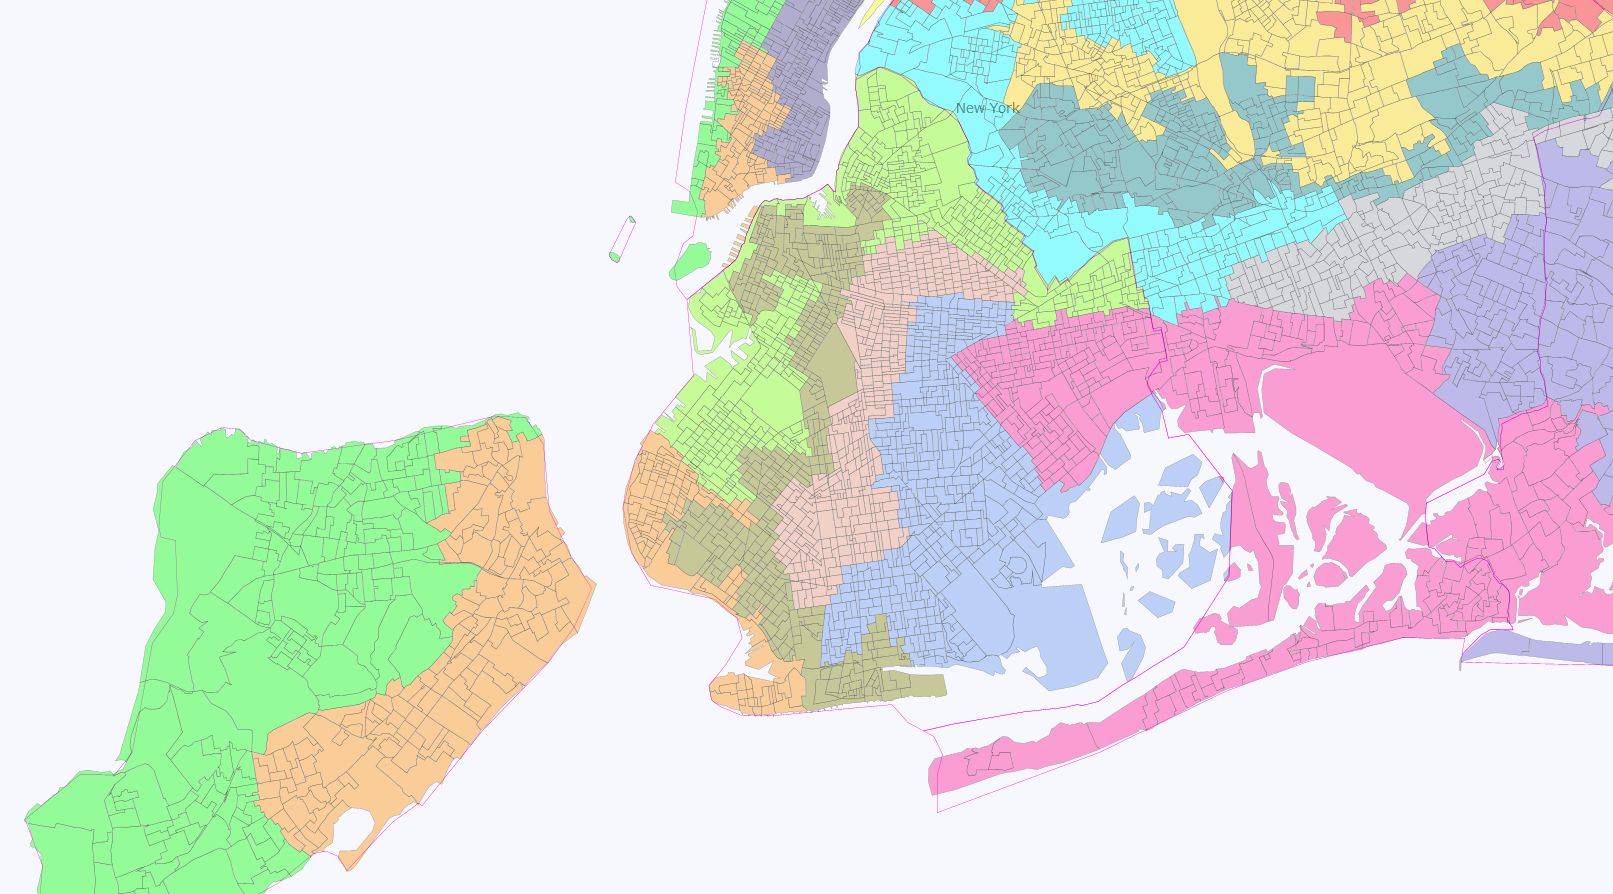
District 11 (neon green) Valasquez (D) HISPANIC VRA DISTRICT Obama 88, McCain 12

Hispanics 51%, Whites 21%, Blacks 13%, Asians 11%

With Wyoming-sized districts, Valasquez’s currently flailing in all directions district gets partitioned into Queens and Brooklyn-only successor districts.  There are just enough Hispanics in Brooklyn to make a district and its Valaquez’ for as long as she wants it.

District 12 (light blue) I’m guessing Towns (D)? VRA BLACK DISTRICT

Obama 78, McCain 22

Blacks 52%, Whites 34%, Hispanics 7%

I diluted the black share of this district and Yvette Clarke’s next-door so I could crack heavily McCain precincts in south Brooklyn and keep them away from the open #14.  Don’t know for sure whether I kept the Caribbean Blacks in one district and the African-American Blacks in another, though.  (This is mainly why the districts are drawn in the weird wrapping-around way right now).

District 13 (beige pink) Yvette Clarke (D)? VRA BLACK DISTRICT

Obama 81, McCain 19

Blacks 52%, Whites 28%, Hispanics 11%, Asians 6%

Also helps crack McCain precincts in south Brooklyn.

District 14 (ugly green) OPEN DEM SEAT Obama 69, McCain 30

Stretches from parts of Williamsburg, Fort Greene, and Park Slope down to Coney Island.  I think a Park Slope liberal like David Yassky would love this district; otherwise if Weiner wants to move back to Brooklyn he can have it.

Staten Island-Manhattan Districts (Districts 15-18)

District 15 (orange) Grimm (R) NOT MUCH LONGER!! Obama 67, McCain 32

Takes the last bits leftover in Brooklyn from drawing 4 districts, adds that to about 1/2 of Staten Island, and finishes the job by adding a bit of heavily Democratic lower Manhattan.  Shares joint-contiguity across New York Harbor with neighboring 16th with the Staten Island ferry.  Thousands of Staten Islanders take that to work each and every day – along with oodles of tourists getting a free view of the Statue of Liberty and Ground Zero.  Prior to 1982, the Staten Island district connected with a bit of Manhattan.  It’s perfectly legal.

District 16 (green) Nadler (D) Obama 69, McCain 31

Nadler helps complete the job of cracking Staten Island.  Even better his type of progressive politics causing Staten Islanders even bigger heartburn.  Want to secede from NYC?  Tough, you can’t!

Photobucket

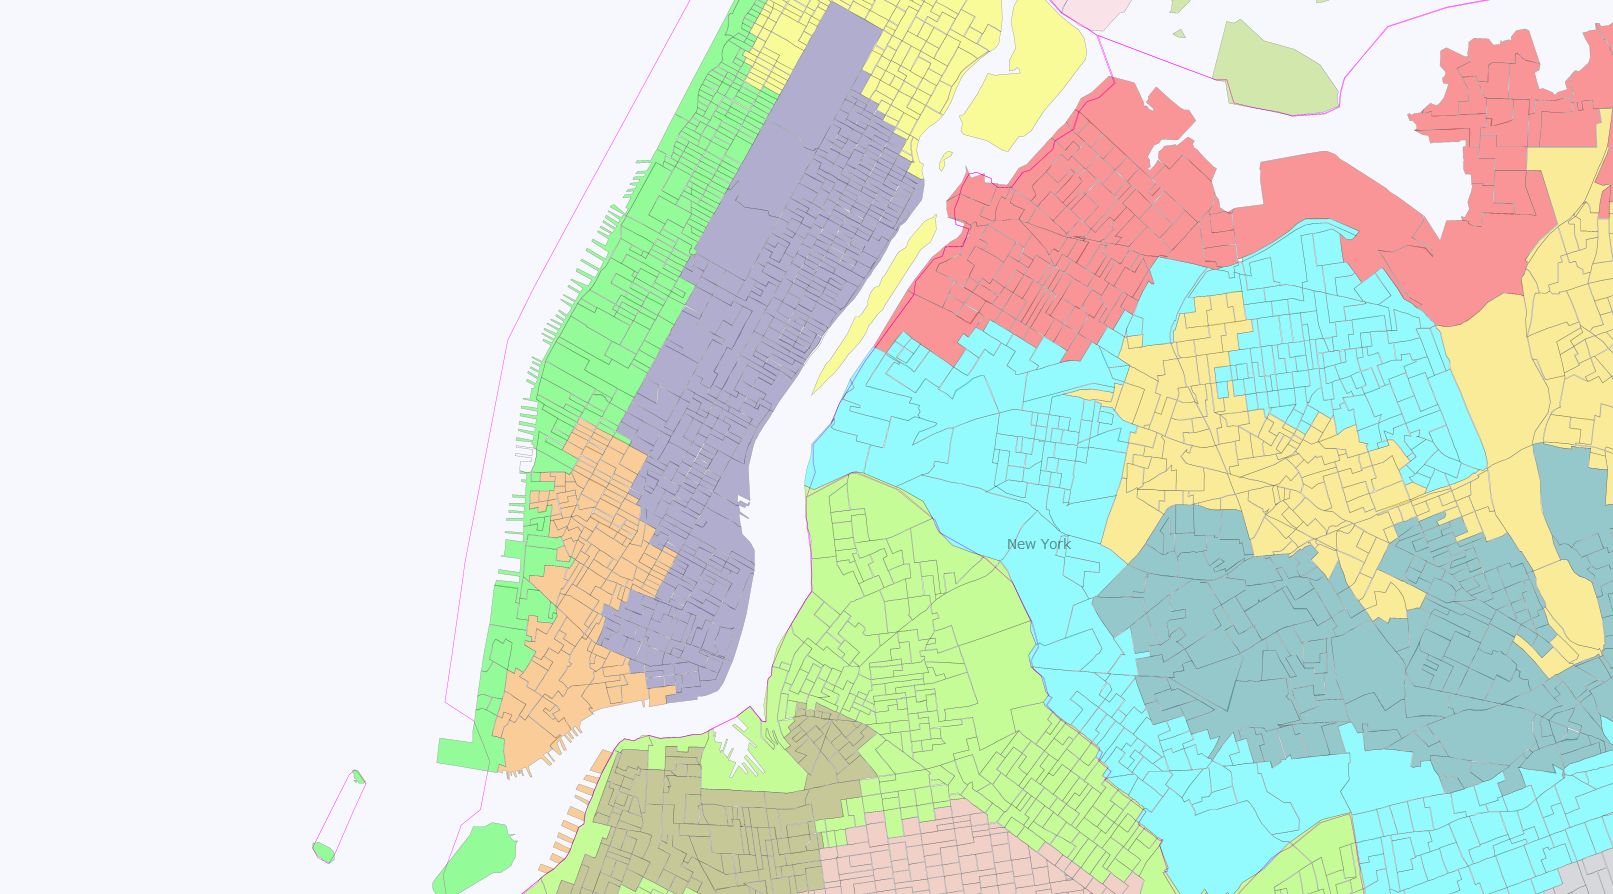
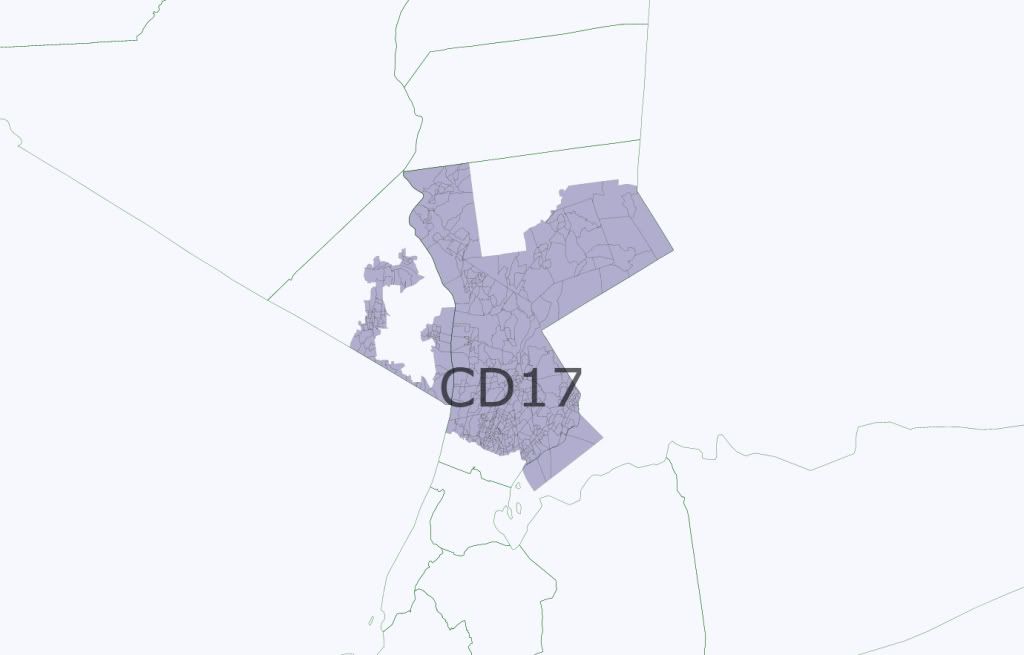
District 17 (dark purple) Maloney (D) Obama 78, McCain 21


Shrinks to become just an East-Side Manhattan district, like it was before the 1990s.

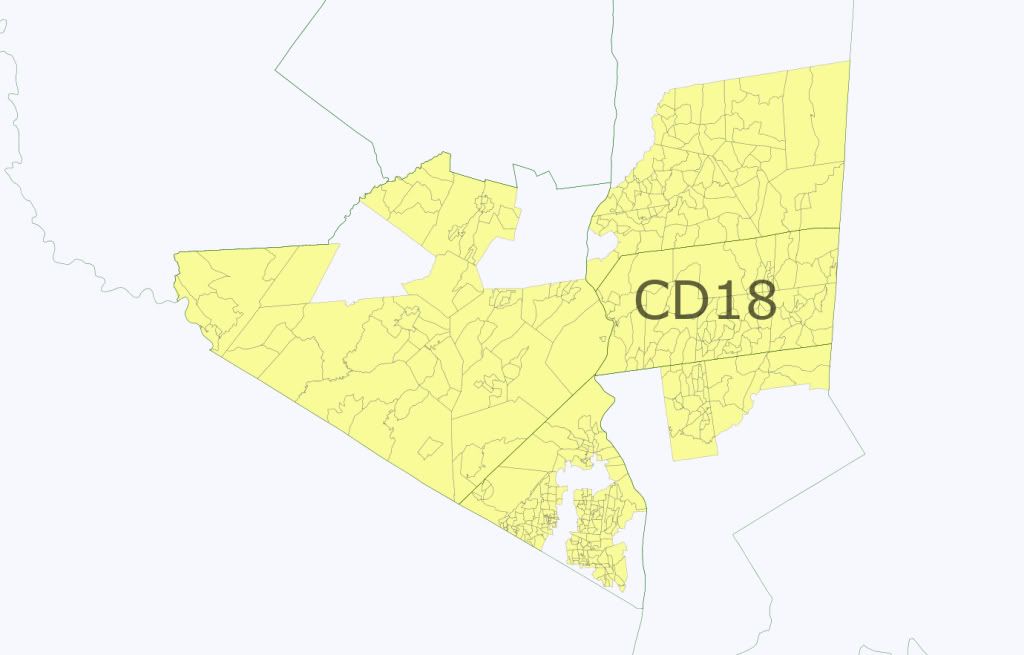
District 18 (yellow) Rangel (D) VRA “MINORITY-MAJORITY COALITION DISTRICT”

Obama 94, McCain 5


Hispanics 45%, Blacks 37%, Whites 13%

Largely the same as before, without Rikers Island or a bit of upper-most Manhattan.  Due to the exponential growth of Dominicans, it is no longer possible to draw a black-majority district in Harlem anymore without crossing over into the Bronx.

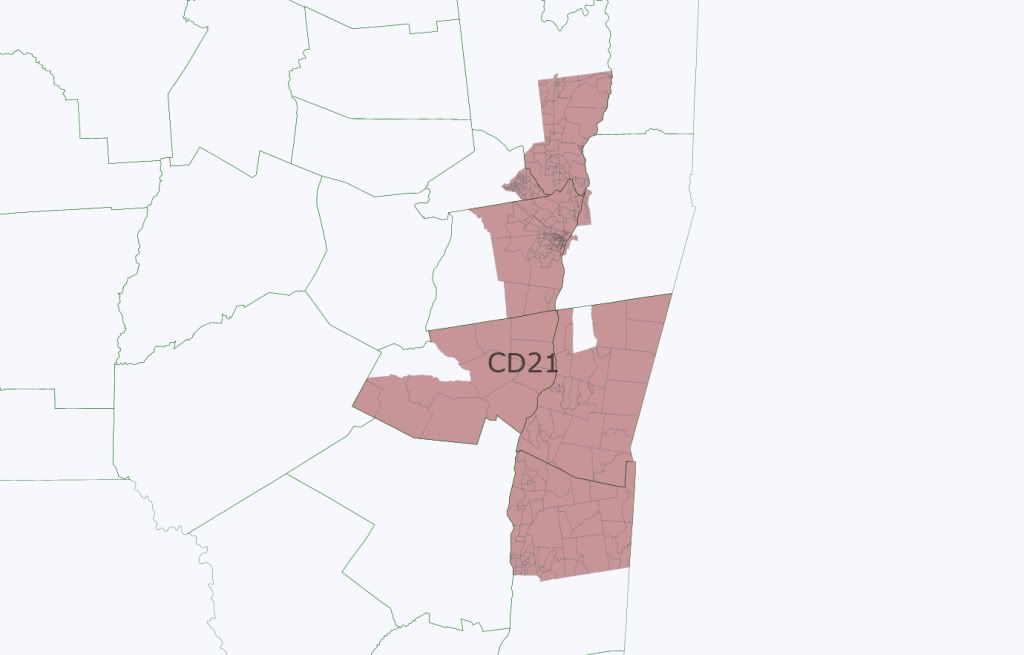
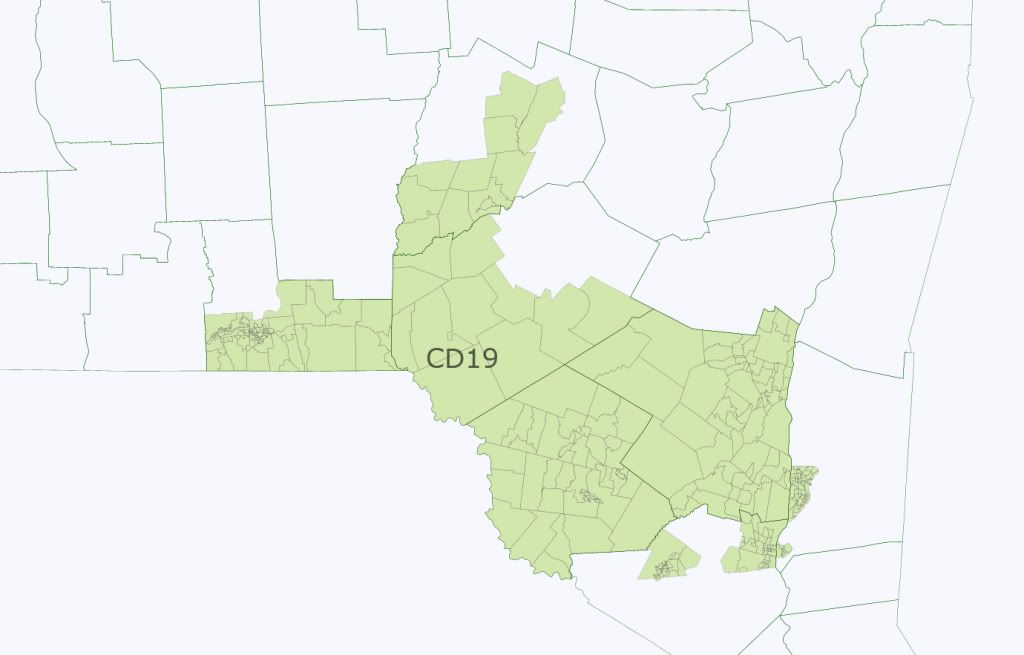
Bronx-Lower Westchester Districts (Districts 19-21)

Photobucket

District 19 (Serrano (D) VRA HISPANIC DISTRICT

Obama 85, McCain 14

Hispanics 54%, Blacks 23%, Whites 17%

Did a bit of rejiggering of the Bronx districts to create a second Hispanic VRA district as well as an African-American one.  But Serrano should be fine.


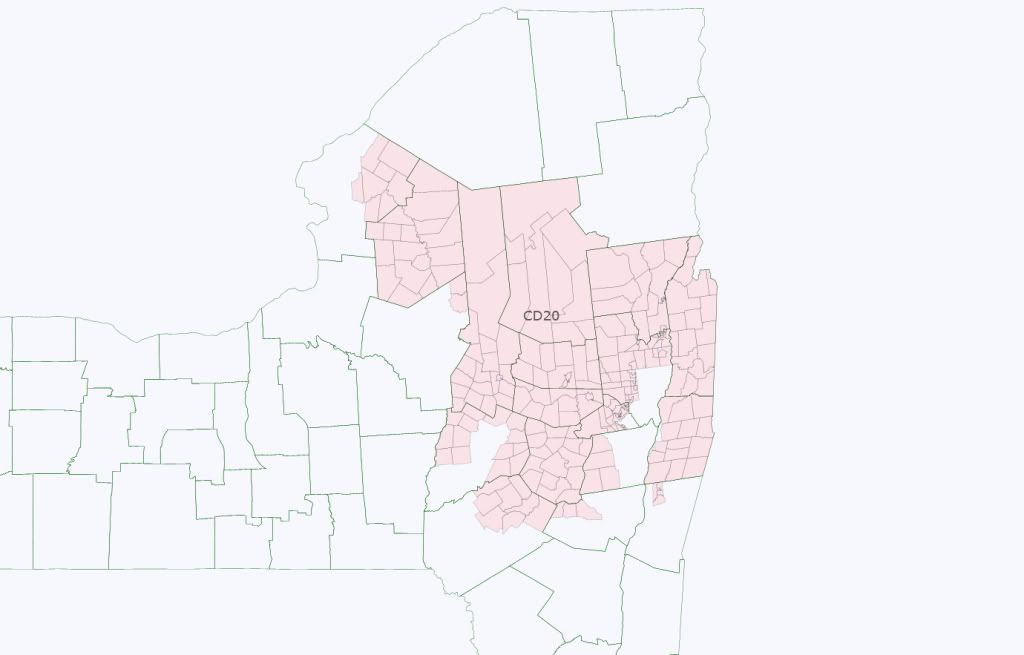
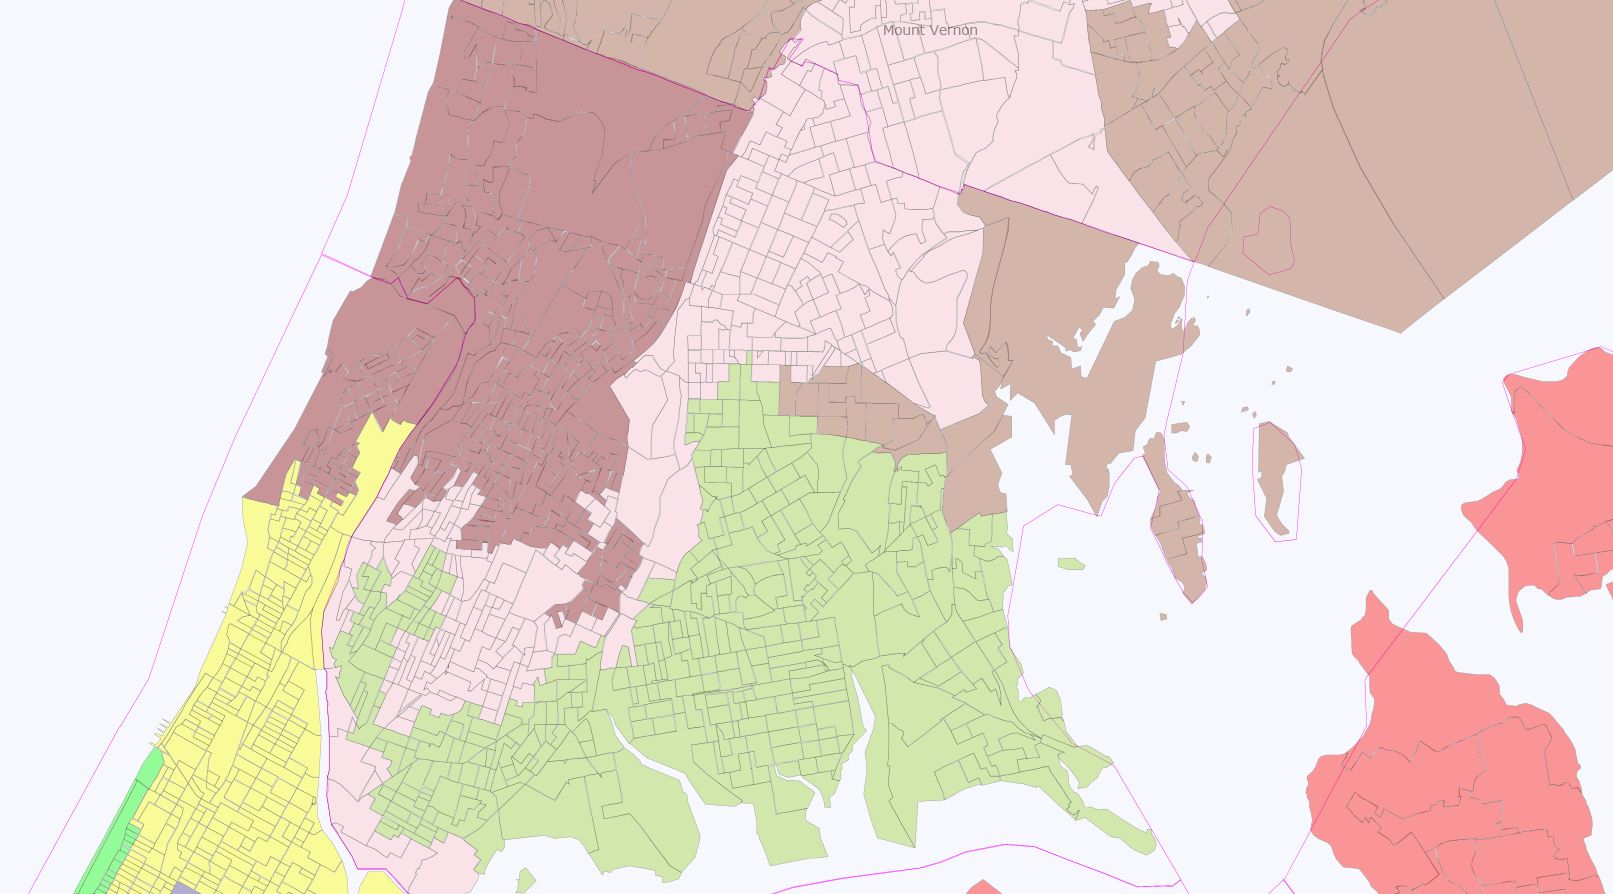
District 20 OPEN VRA BLACK DISTRICT

Obama 89, McCain 11

Blacks 51%, Hispanics 31%, Whites 14%

One of the best outcomes in my mind of a Wyoming Rule is that it enables you to craft VRA complaint districts in areas that you ordinarily cannot now.  Such is the case of northern Bronx/Mount Vernon.  District extends a bit north to Eastchester Town in Westchester to steal GOP votes from Lowey’s district.

District 21 (maroon) Engel (D) but likely not for much longer VRA HISPANIC DISTRICT

Obama 87, McCain 12

Hispanics 58%, Whites 18%, Blacks 17%

Under the Wyoming Rule and the VRA, Bronx is going to have to have a second Hispanic district.  And with that, Engel loses a seat, unless he wishes to move to Rockland County and take on the open swing district there.  Not that I care much; I find Engel one of the least effective congressmen from the New York delegation.

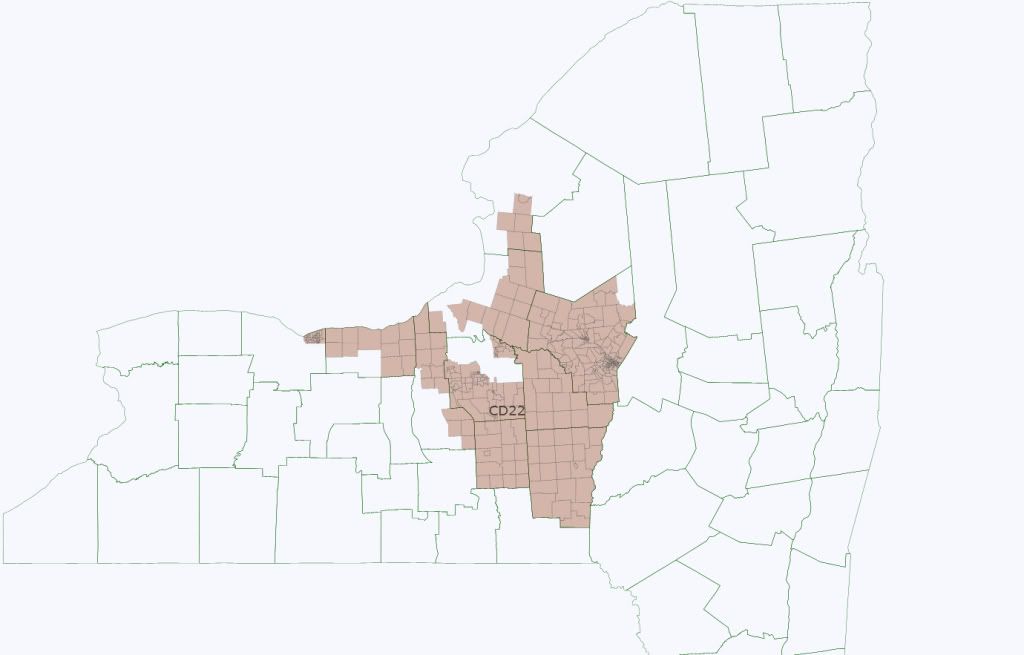
Lower-Mid Hudson Valley (Districts 22-25)

Photobucket

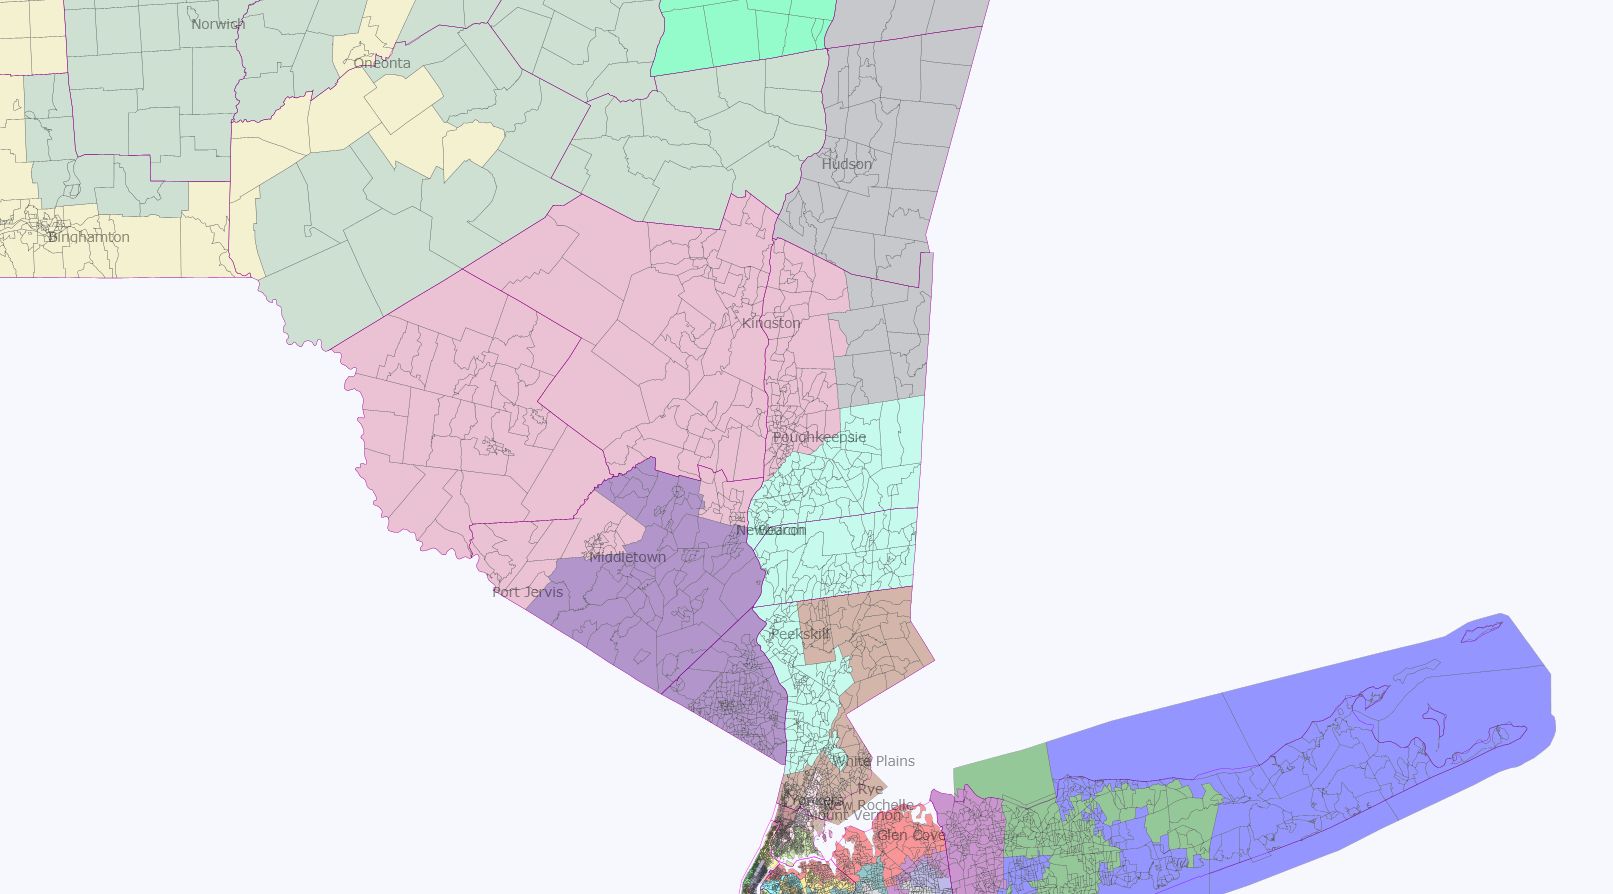
District 22 (brown) Lowey (D) Obama 60, McCain 39


Most of Westchester, goes north to grab a few more Republican-leaning areas away from Hayworth in the 23rd and helps transform that district from a swing district into a lean-Democratic one now.  Lowey, who’s an institution in Westchester, should be fine.

District 23 (very light blue) Hayworth (R) but not for much longer!

Obama 58, McCain 42

This would be my home district were I still living where I grew up.  Ancestrally Republican, southern Dutchess is now becoming a swing region, in part due to people moving in from New York City and Westchester, but also in part due to the Republican party lurching right off of a cliff over the past 2 decades.  The type of Republicans this region used to support were centrists like long-serving GOP congressman Ham Fish Jr., current State Senator Steve Saland who isn’t all that bad especially on education issues, and George Pataki who is bad on education issues but pretended to be a socially liberal Republican while governor between 1995 and 2007.

Still, by going deep into Democratic areas of Westchester, it is possible to draw this district so that it has a Democratic PVI.  John Hall probably would have won reelection on these lines.


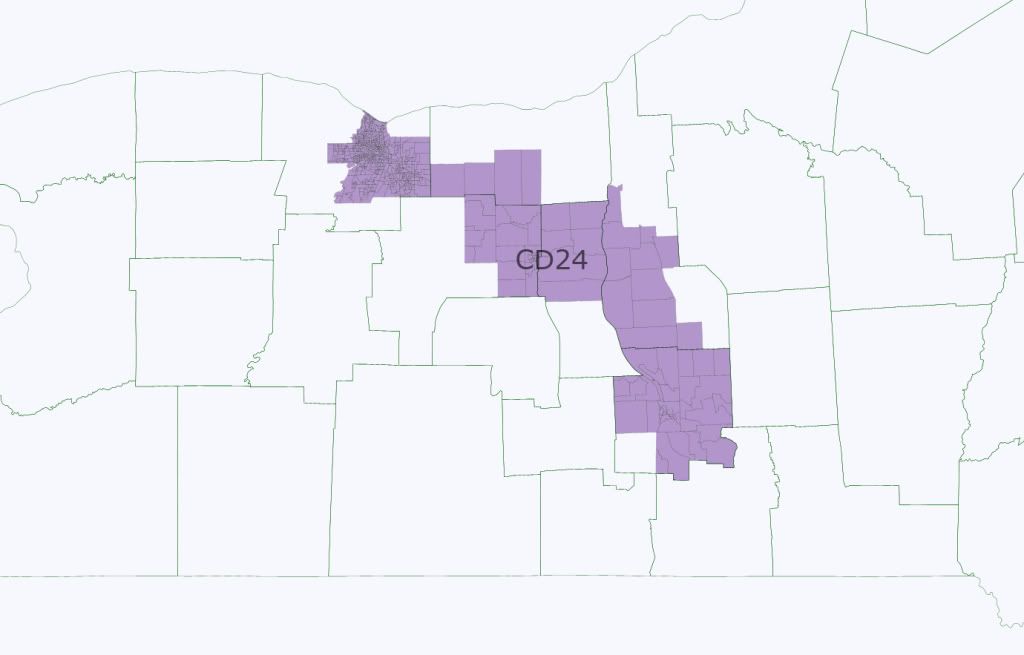
District 24 (purple) OPEN SWING DISTRICT/LEAN GOP?

Obama 51, McCain 49

Welcome to a reincarnated version of the old Ben Gilman district.  Going by Obama percentages alone would suggest that this is a lean-GOP district.  However, for some reason or another, Obama didn’t sit well with a lot of Jewish Rockland and southern Orange voters; similarly, he didn’t earn the robust vote percentages out of Long Island that Clinton and Gore received.  Perhaps a lingering 9-11 effect?  Well, whatever the reason, Rockland and southern Orange are heavily Jewish regions that tend to support Democrats at the state and local level.  A Republican can win here but it has to be a Republican in the mold of Ben Gilman, who even when he was serving in congress (1972-2002) was considered a RINO.  I like our chances in this district even though I drew it this way to maximize the Democratic chances in the 23rd and the 25th next door.


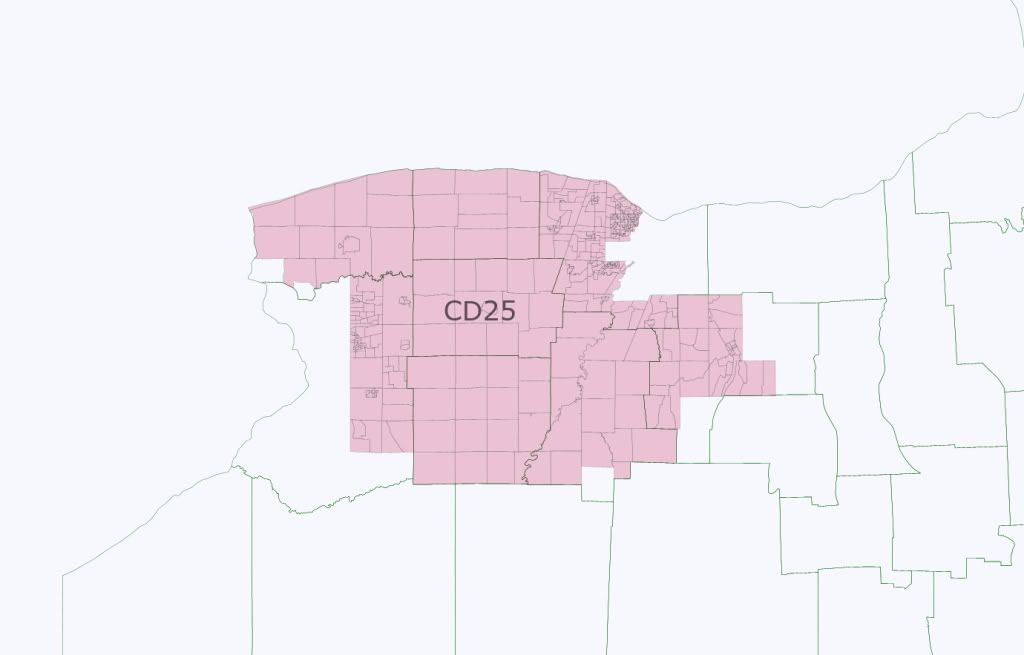
District 25 (pink) Hinchey (D) Obama 59, McCain 40


Hinchey finally gets a Catskills-Hudson Valley only district instead of his squiggling around all over the place!  I love the Wyoming Rule!!

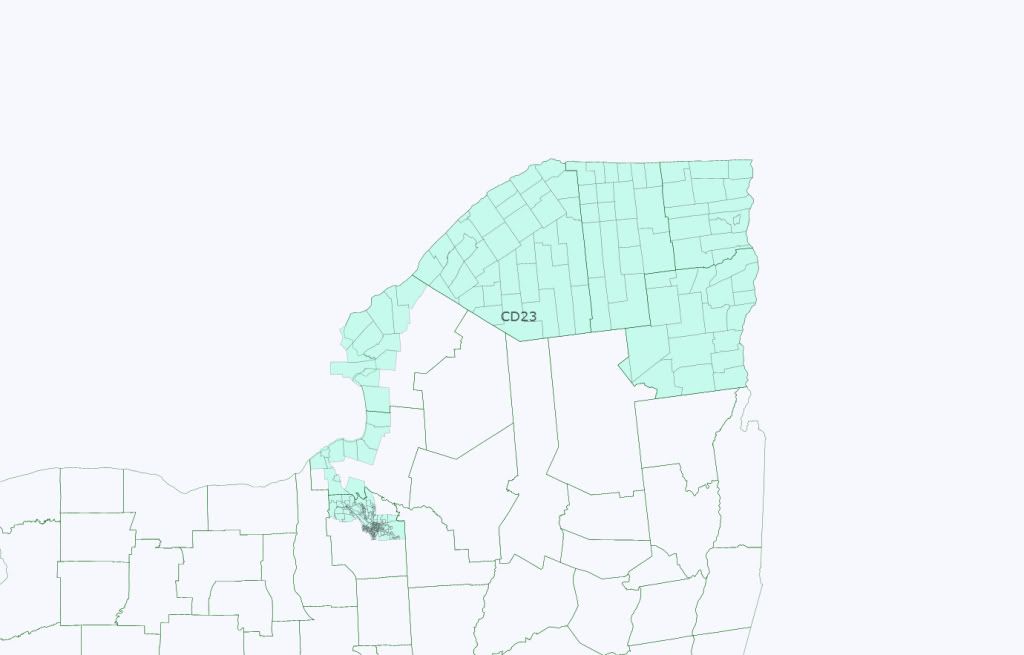
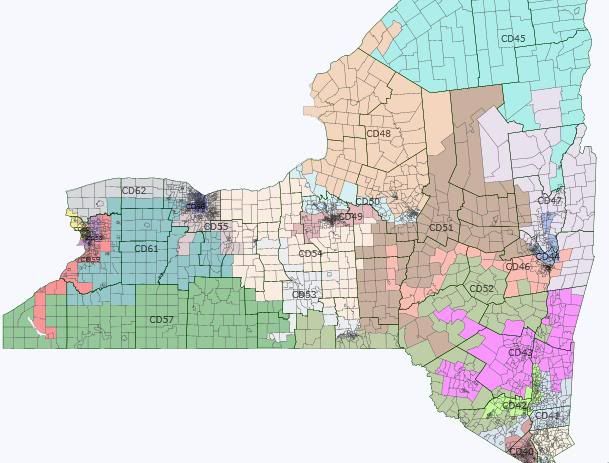
Central New York-Capital Region

Photobucket

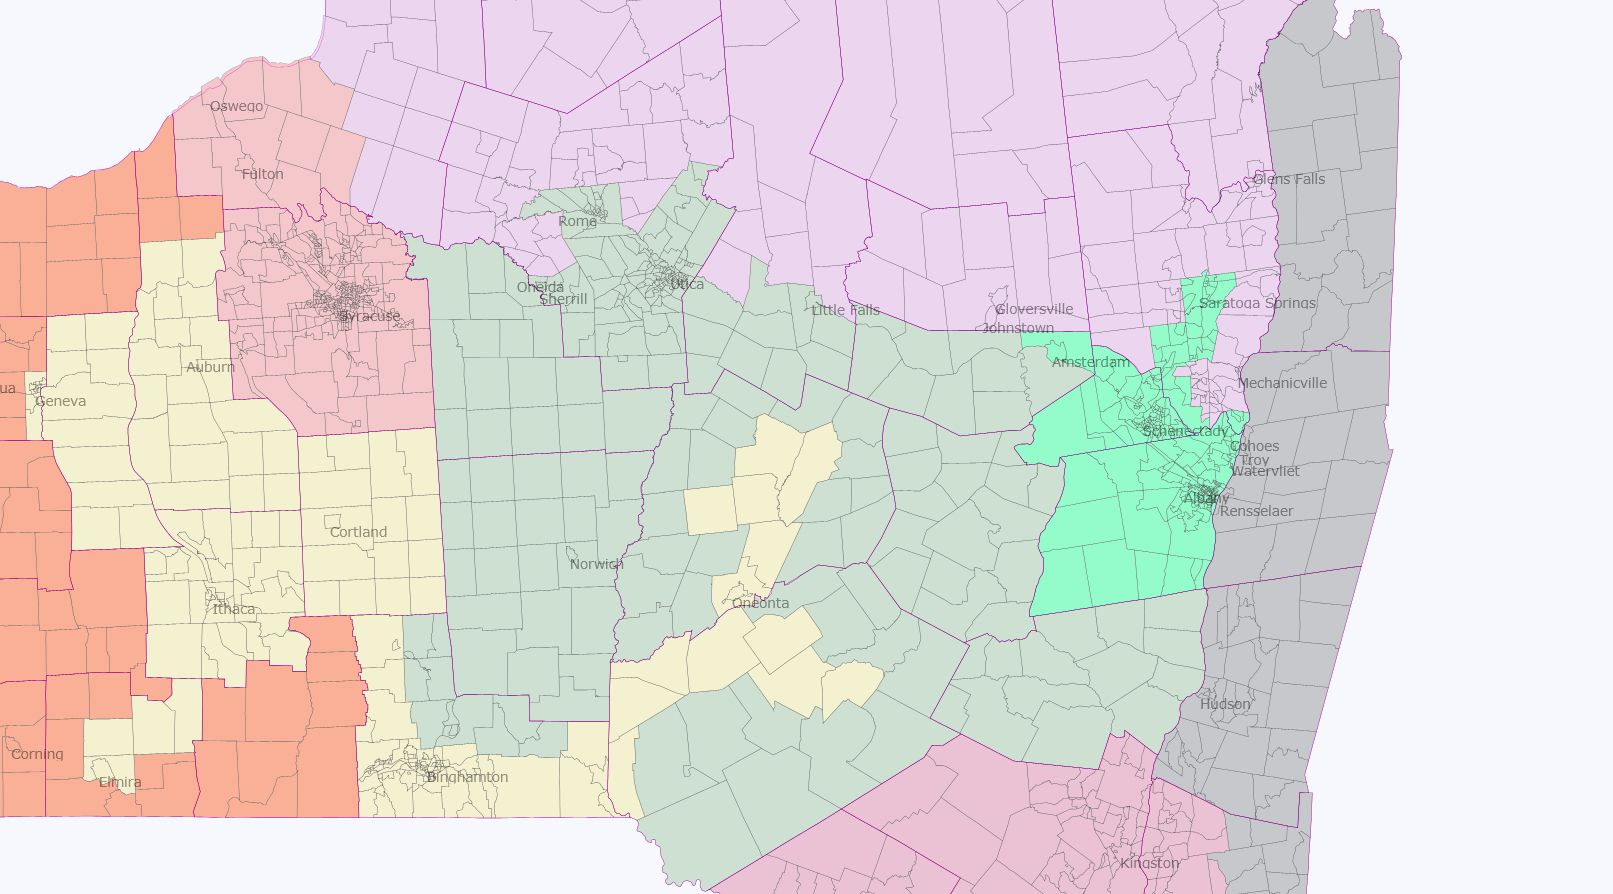
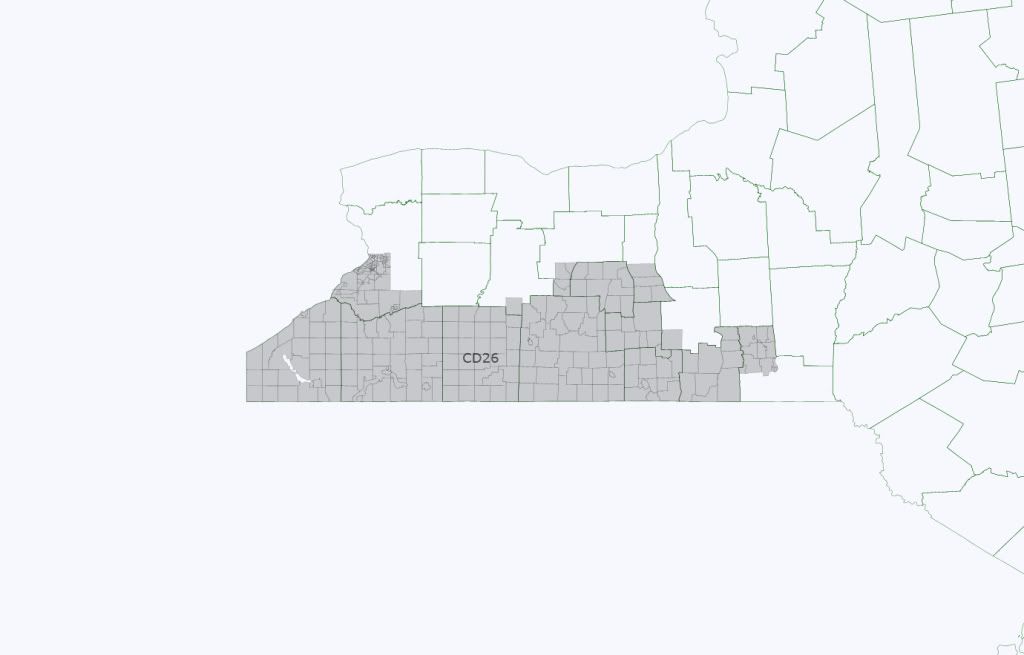
District 26 (grey) Gibson (R) vs. Owens (D) LEAN DEMOCRATIC  Obama 56, McCain 42


Being purely tactical here, I combined the most Democratic areas of both the current 20th and the 23rd, excising out the most Republican regions of each (Jefferson, Lewis, northern Oneida, Hamilton, Fulton, etc. in the 23rd; Saratoga in the current 20th).  While I do not like blue Dog DINO Owens, he has shown moxy in winning not once but twice a district that never elected a Democrat before in something like a century.  Now he has a district that has a lean-Democratic PVI… and without having to cut Albany in half.

District 27 (neon green) Tonka (D) Obama 60, McCain 39

The Albany outlaying region is slowly turning against national Democrats.  Decided here to shore up Tonka a little by grabbing Saratoga Springs.  The neighboring 28th is one of 4 GOP vote sinks in upstate New York so this makes a bit of sense.

District 28 (lilac) OPEN GOP SEAT Hoffman probably? (Ugh!) Obama 47, McCain 52

The consequence of making a safer district for Bill Owens is that we probably also get Doug Hoffman.  Oh well….

District 29 (green/gray) Hanna (R) Obama 47, McCain 51

A lean-GOP vote sink in upstate New York because frankly Oneida County has too many frigging Republicans and because under the Wyoming Rule, there’s no place really for them to go but here.  also, I wanted to a safer district for Maffei near Syracuse and an open Democratic college-towns district near the Binghamton-Ithaca area.  So, Hanna gets a safish district.  Arcuri could make a comeback, though, as it isn’t all that Republican.

District 30 (light red) Maffei? (D) Obama 58, McCain 40

I think Dan Maffei is well primed for a comeback with these lines.  Includes along with all of Syracuse-dominating Onondaga County, most of Oswego, including the university town that is bound to turn out big for President Obama in 2012.

District 31 (cream) OPEN DEMOCRAT SEAT

Obama 57, McCain 41

I had a lot of fun creating this one.  In addition to grabbing pockets of Democratic voters from Central New York, the Southern Tier, and the Finger Lakes, it is a community of interest district: it is a universities and colleges district.  SUNY-Oneonta, Hartwicke College, SUNY-Binghamton (my alma mater), Ithaca College, Cornell University, SUNY-Cortland, the list goes on and on.  And I think a liberal/progressive in the mold of Maurice Hinchey would do just fine here.

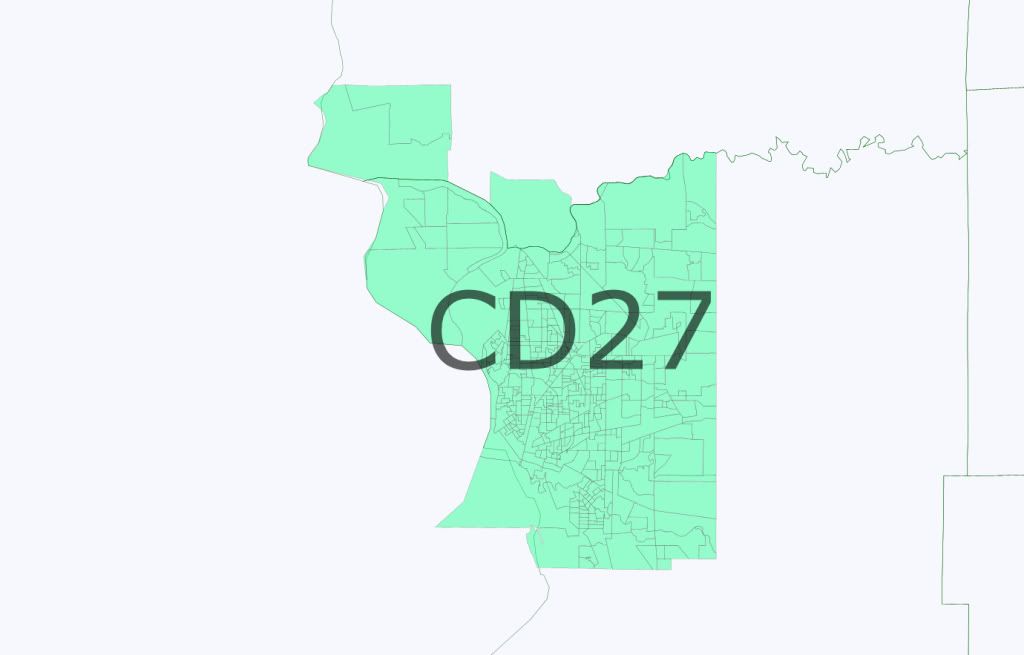
District 32 (red-orange) Tom Reed (R) Obama 43, McCain 56

This is the most Republican district in New York, and serves as one of four GOP vote sinks in Upstate to ensure the election of 7 Democrats in neighboring districts.  Worth the trade in my opinion.  Takes most of the Republican areas of the Southern Tier and connects them via a narrow corridor in Ontario County to uber-GOP Wayne County (the reason why Maffei lost btw).


Rochester-area

Photobucket

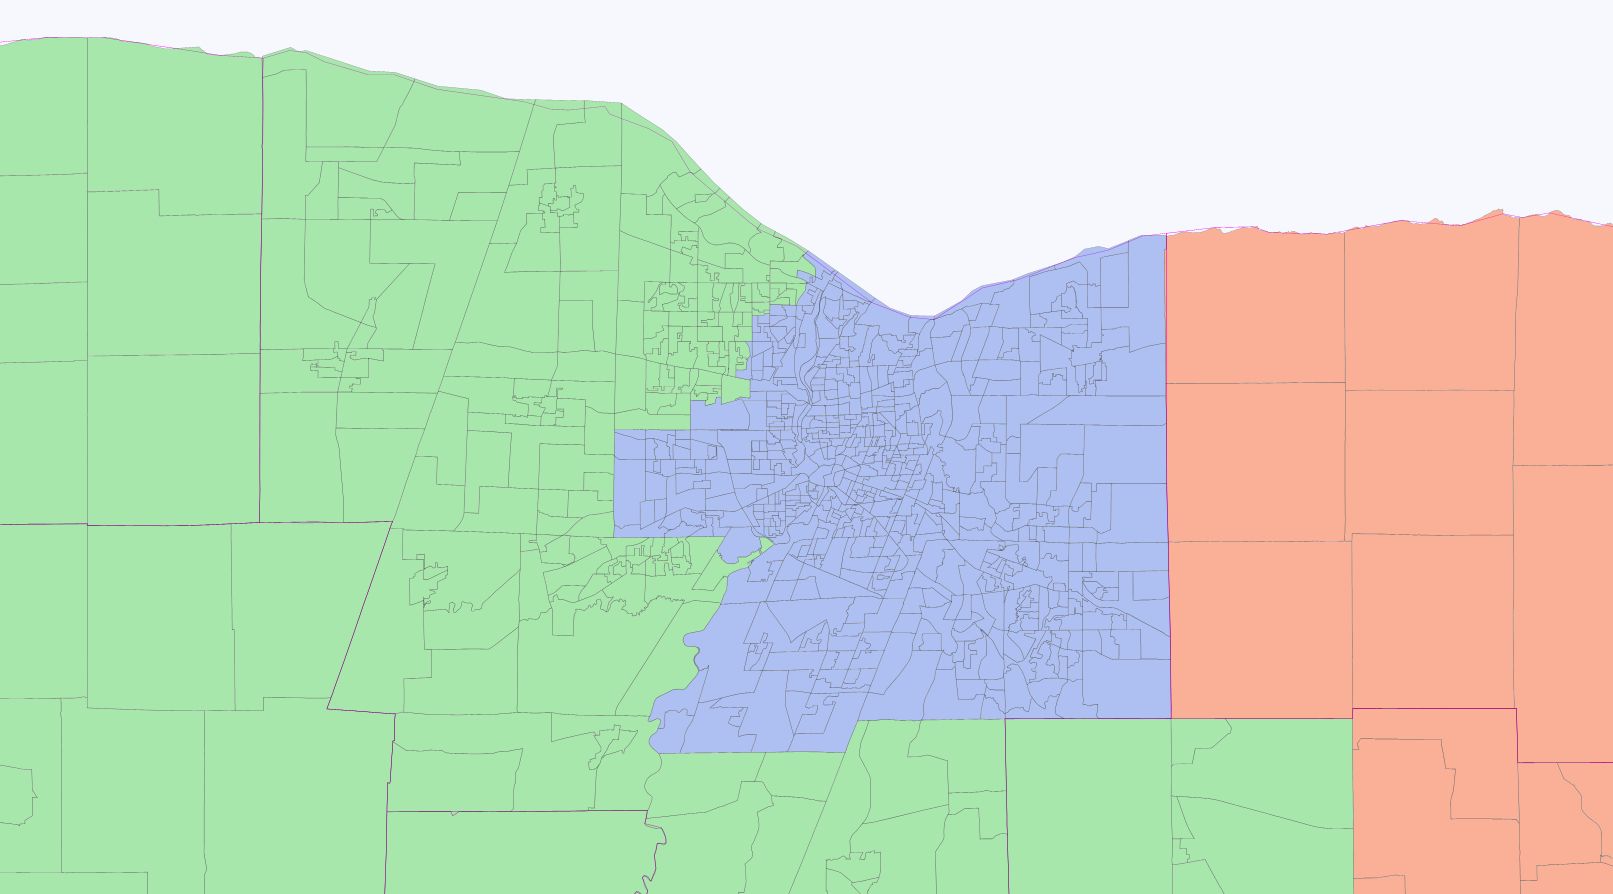
District 33 (blue) Slaughter (D) Obama 63, McCain 36

Could have risked it and created another Democratic district in Western New York other than the 3 I have created there.  But let’s face it; Slaughter is getting on in years, the suburbs of Monroe County aren’t nearly as blue as those of Erie, and it just ain’t worth it when you already are running up the score downstate where there are more reliably Democratic votes to unpack.  This district therefore consists of the entire city of Rochester and its immediate suburbs, safely Democratic even when Slaughter decides to retire.

Buffalo-area

Photobucket

District 34 (green) Lee (R) Obama 44, McCain 54

Republican suburbs of Erie County, the heavily GOP GLOW region between Rochester and Buffalo, and parts of Ontario County left over from the 32d.  A safe GOP district for as long as Lee wants it, designed this way to ensure a Democratic victory in the neighboring 35th and 36th seats.

District 35 (purple) OPEN DEMOCRATIC SEAT

Obama 58, McCain 40

A reincarnation of the old LaFalce seat, without its little finger into Rochester.  A generic Democrat should do just fine here.

District 36 (orange) Huggins (D) Obama 58, McCain 40

Little changed from current district in being a Erie-Chautauqua hybrid, but gains bluer portions of Buffalo to raise its Democratic performance a bit.  Remember in 2002, the district was drawn to be a district that a Republican, namely Jack Quinn, could win.