Bipartisan Upstate NY Map – 6D, 5R

Here is my take on what will happen in redistricting in upstate New York.  Some ground rules…

1.  I went in with the assumption two seats are going to be eliminated, one Republican, and one Democrat.  

2.  The Republican, most likely, will be Ann Marie Buerkle of NY 25.  There are several reasons for this.  First, she won a D+3 district in an upset, and she lives in the most Democratic part of the district (Syracuse), meaning giving her a much better district would be difficult.  Second, she is considered too conservative for her district.  Both mean she’s probably the most untenable incumbent.  Finally, Bill Owens is going to need some Democrats to shore up his seat, and Syracuse is the best place to poach them.

3.  The downstate district eliminated is not pictured on the map, but it is likely a NYC-based district not considered a VRA seat.

I didn’t redistrict the sixteen downstate districts for a number of reasons.  First, racial demographics play a much larger role downstate in drawing districts than partisan data.  We don’t have up-to-date racial data with the voting districts, and given the rapid shifts in NYC neighborhoods, it’s really needed.  Second, I don’t know very distinctly the residences of existing reps.  I can say I think the Democrats should have 2-3 majority-black districts (one in Queens, 1-2 in Brooklyn), and 3 majority Latino districts (2 in Bronx, one in Brooklyn and Queens).  

I should also note that in keeping with NY law, I in all cases but one did not split up townships or cities.  the exception was Rockland County.  This was partially because Rockland County has huge “towns” similar to Long Island which were split under the old map.  It’s also because within the towns there are huge ideological ranges, with Hasidic areas which were 90% McCain next to black areas which were 90% Obama.  

Anyway, all of these seats should be reasonably safe for the incumbents.

Away we go…in descending order.
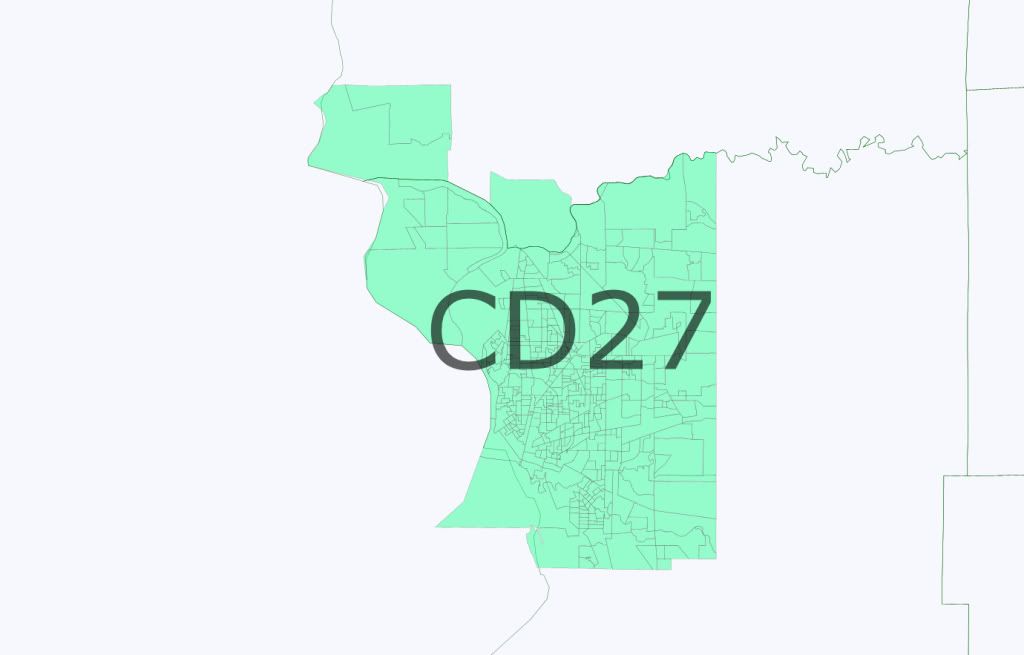
NY-27:

Incumbent: Brian Higgins

D+10

One of the four upstate districts which keeps its old number.  Draws in tightly to Buffalo and becomes far more Democratic.
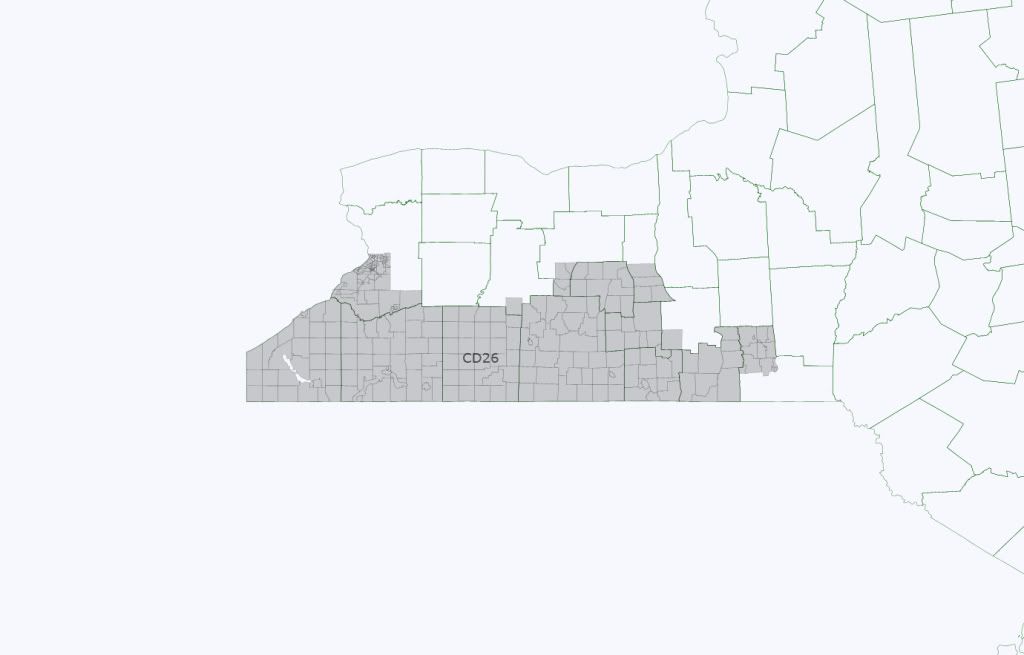
NY-26:

Incumbent: Tom Reed

R+7

Tom Reed gets a more compact district which hews closely to the southern tier, while taking in some narrowly Republican suburbs south of Buffalo.  A bit more Republican than his old seat.  
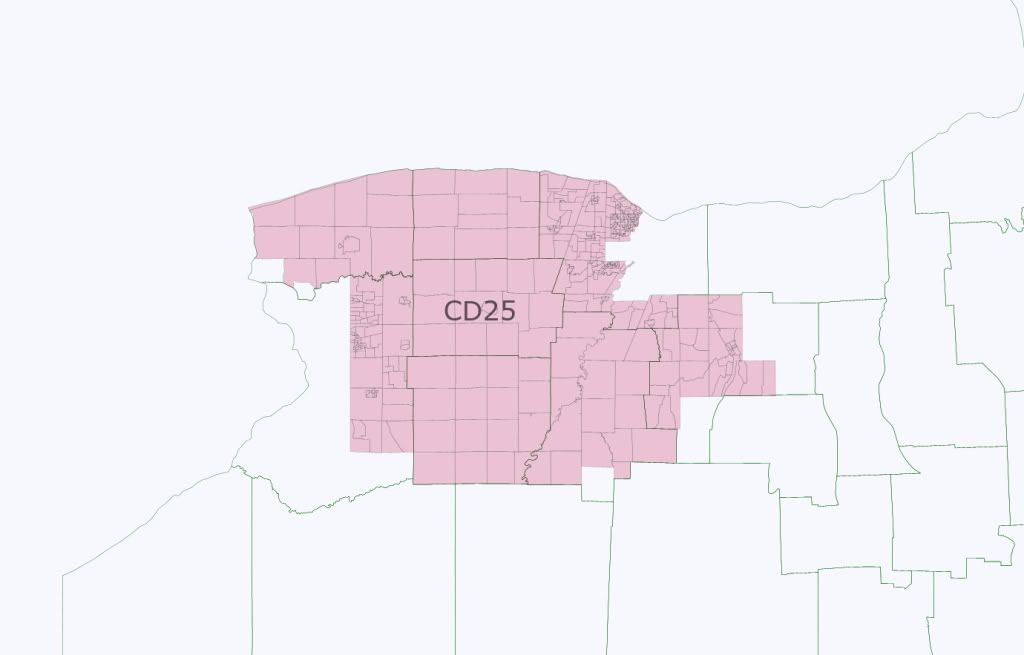
NY-25:

Incumbent: Chris Lee

R+9

The district is essentially NY-26.  It gets smoothed out a bit, but still maintains itself as being mainly Republican suburbs of Buffalo and Rochester, with some rural areas in-between.  Is more Republican than the old seat.  
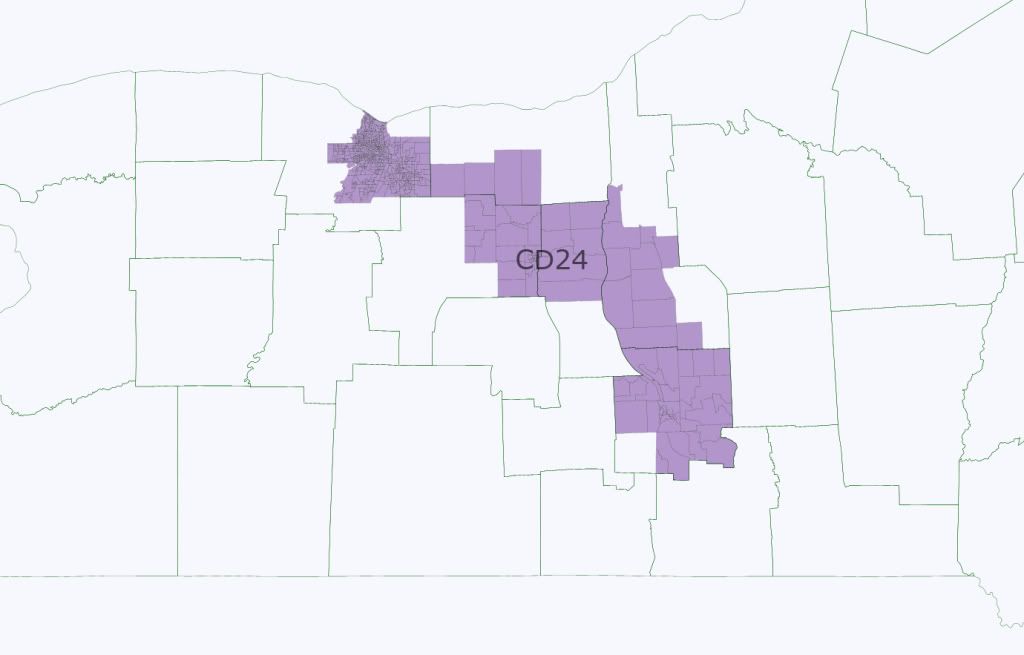
NY-24:

Incumbent: Louise Slaughter

D+10

The earmuffs are gone!  Instead, the district takes in the more Democratic suburbs of Rochester, then makes a beeline Southeast to take in Icatha.  This is a little less Democratic than the old seat, which was D+15, but it’s still quite safe.  
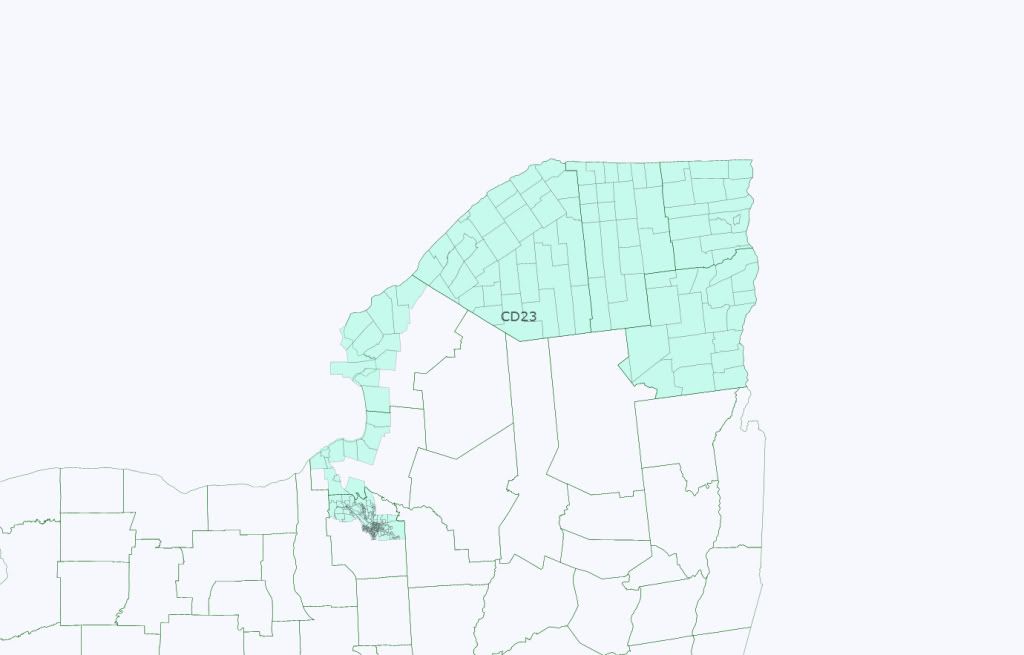
NY-23:

Incumbent: Bill Owens

D+6

The second Upstate district which doesn’t change numbers.  Bill Owens keeps the four most Democratic counties in North Country.  He gets added to his district Syracuse, the most Democratic-leaning suburbs of it, and a salient connecting the two.  A bit of a ugly gerrymander, but what can you do?  
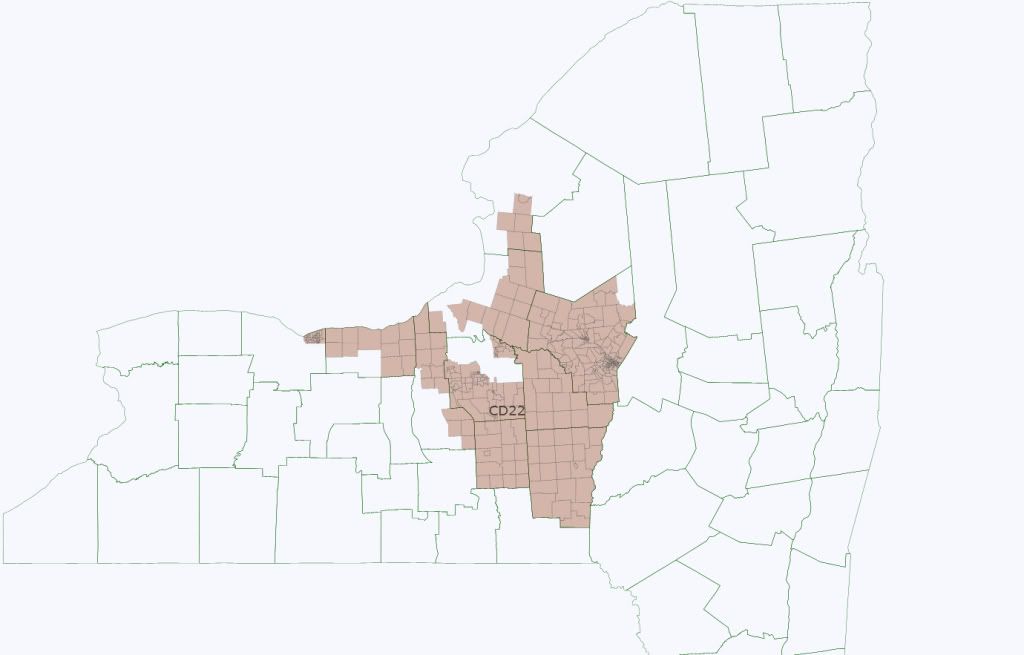
NY-22:

Incumbent: Richard Hanna

R+5

The district is broadly similar to the old NY-24, in that it still forms a U around Syracuse, although the U is much tighter.  The district is marginally better than the old R+2.  
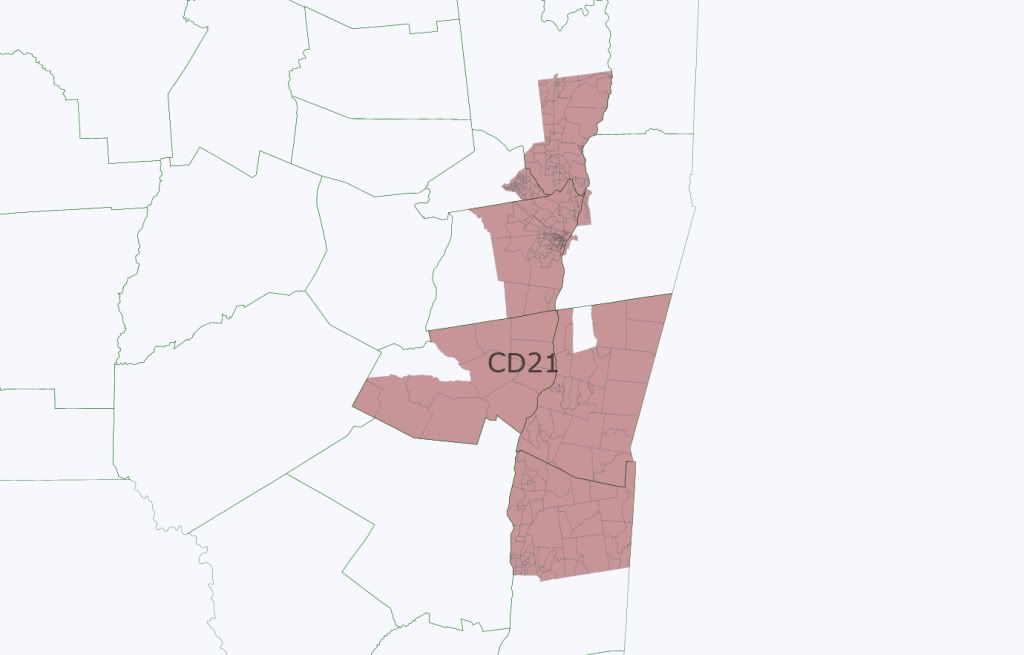
NY-21:

Incumbent: Paul Tonko

D+6

Another district not switching numbers.  It changes quite a bit, although it remains Albany-focused, shedding some of the more Republican areas to the west, but adding some Democratic-leaning areas in the mid-Hudson region.  The PVI is essentially unchanged.  
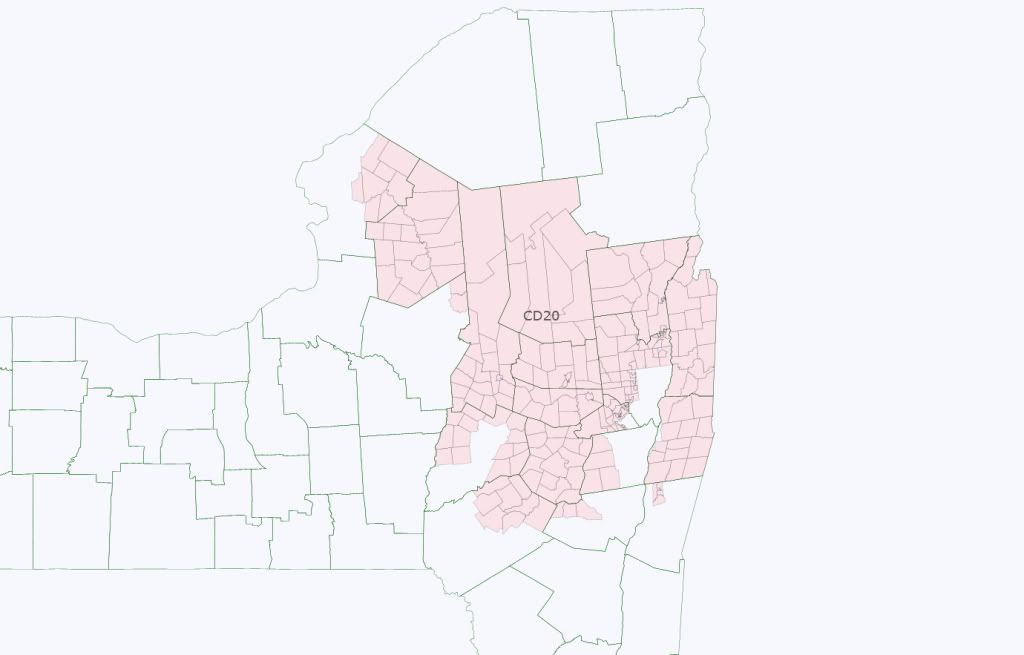
NY-20:

Incumbent: Chris Gibson

R+6

This district transforms quite a bit.  It loses all of Duchess and most of Columbia counties, and swaps them for conservative areas mostly swiped from NY-23.  Significantly better than the old PVI of R+2
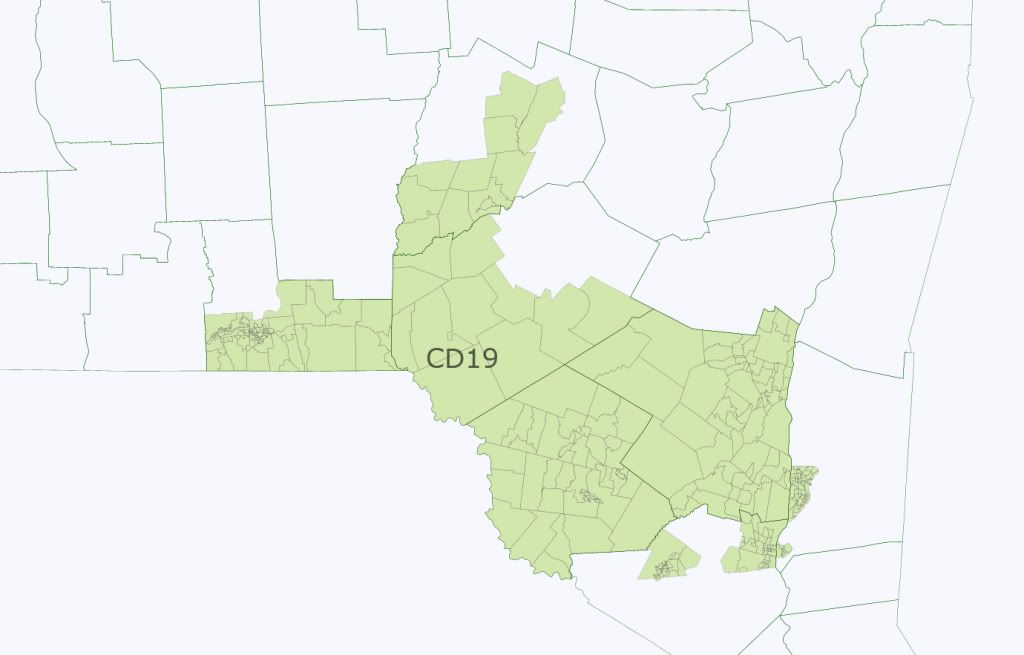
NY-19:

Incumbent: Maurice Hinchey

D+5

This is more or less the old NY-22.  It is more compact, having lost Icatha, but gained  Poughkipsie.  The PVI declined by one from the old PVI (D+5), but it should still be a solid seat for the Democrats.  
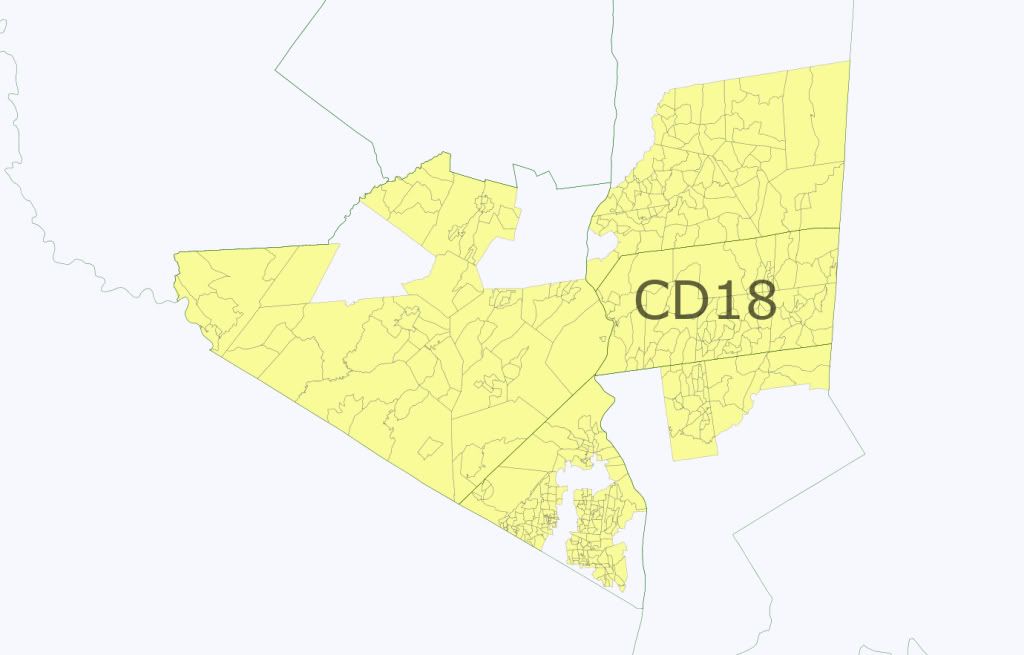
NY-18:

Incumbent: Nan Hayworth

R+7

A major improvement from the old district, which had a PVI of R+3.  Admittedly, the heavy gerrymandering of Rockland County helped a lot.  I’m guessing that if I followed village lines I would have been less questionable here, but I think even with that the PVI shouldn’t have declined much.  
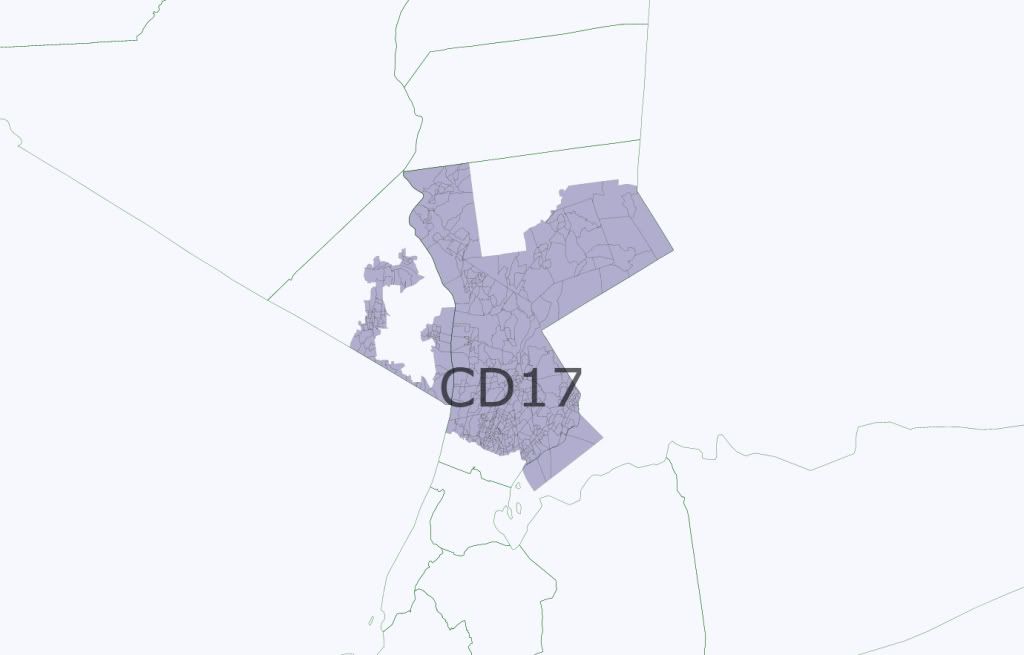
NY-17:

Incumbent: Nita Lowey

D+9

Basically NY-18.  Still Westchester based, with a bit of Orange.  PVI is identical to the old district.  

At the end, I was left with a sliver of Westchester County at the bottom of the map – Mount Vernon, Pelham, and the southern portions of New Rochelle and Yonkers.  I could have gone two ways with this, either keeping Elliot Engle’s seat, but making it more compact (containing these regions and the non-Latino sections of the Bronx), or if I chose to eliminate his seat, splitting the region between several NYC-based districts.  I think the former would have been easier.  

Anyway, love to hear thoughts.  I think in retrospect I could have done better with NY-19, and I’m unsure if NY-18 is legal under New York law, but besides that I think this is a pretty good map.  

New York’s Republican Primary and New York Politics, Part 2

This is the second part of two posts analyzing New York’s recent Republican primary. It will focus upon Republican weakness in New York City, as revealed by the primary. The previous part can be found here.

New York City in the Republican Primary

One of the more interesting things about American politics is the rural-urban divide. The weakness of the modern Republican Party in urban areas is quite astounding. Much of this has to do with the history of the American city, especially the way in which many cities have become reservoirs of poor minorities.

The Republican gubernatorial primary constituted a particularly powerful demonstration of Republican weakness in American cities. To illustrate this, let’s look at a map of turn-out in businessman Carl Paladino’s victory over former representative Rick Lazio:

Part 2

More below.

This map shows the vote cast by each county as a percentage of the total vote cast in the primary. Erie County, for instance, cast 46,054 votes in the primary. Since 442,608 people voted in total, the county cast 10.41% of the total primary vote.

The turn-out map reveals some fascinating patterns. The biggest counties in the Republican primary were in Buffalo and Long Island. High number of Republicans also voted in Rochester, Syracuse, and Westchester County (north of New York City).

On the other hand, New York City participation in the Republican gubernatorial primary was dismal. Fewer people voted in the five boroughs combined than in Erie County (Buffalo). More than twice as many people voted in all Long Island than in New York City. In the Bronx, 2358 people decided to participate in the Republican primary. This is in a place where an estimated 1,382,793 people live.

Compare these figures to 2008 presidential election:

Part 2

Here we see New York City punching at something closer to its actual strength. Like a giant magnet, New York City’s population pulls away influence from upstate New York and directs it to itself. Indeed, in the presidential election New York City is four times as important as it was in the 2010 gubernatorial Republican primary – constituting 34.23% of the total vote, compared to 8.58% in the Republican primary.

This really says something about the state of the Republican Party in New York City.


New York City in the General Election

The above two maps do not really hammer in the importance of New York City. Stating that five boroughs hold one-third of a state’s vote is one thing, but actually seeing it is another.

The previous post contained an image of New York in the 2008 presidential election. This map only reflected President Barack Obama’s performance in upstate New York, which he won by the high single digits. Here is a picture of said map:

Part 2

(Note: Edited NYT Image. This map underestimates Mr. Obama’s strength, since it doesn’t include a number of absentee ballots and provisional ballots. Both, especially the absentees, tended to go more Democratic than the national average in 2008.)

This looks good for Mr. Obama. There is a lot of blue here and not a lot of red. In reality, however, most of the territory mapped above actually does not belong to the Democratic base. In a close election, almost all of these counties would go strongly Republican. These are the places that generally voted for Carl Paladino.

The real area of Democratic power is in New York City. Let’s add New York City to the above map:

Part 2

Mr. Obama looks really good here; indeed, the blue margins are so large that it is hard to comprehend their magnitude.


Concluding Thoughts

All in all, the divide between New York City’s importance in the Republican primaries and its importance in the general election is quite amazing. It really points to what the Republican coalition of voters is like today. Cities are almost an afterthought; most Republicans assume they will vote Democratic anyways, and so they don’t even bother to compete.

In some states this can be a wise concession. In most states taking the suburbs and the rural areas – occasionally, winning just the rural areas – is enough to win a state election. Cities are not always necessary to win. On the other hand, they certainly are useful to win elections, especially in a state like New York.

Republican candidate Carl Paladino does not look like he will win the general election. Originally trailing Democratic Attorney General Andrew Cuomo 2-to-1, the Republican national wave has closed this to a high single-digit gap. This, however, will be hard to surmount – for much of the remaining gap lies in winning New York City voters, almost none of whom participated in the primary electorate which chose Mr. Paladino.

New York’s Republican Primary and New York Politics, Part 1

This is the first part of two posts analyzing New York’s recent Republican primary. It will focus upon the upstate-downstate divide revealed by the primary. The next part can be found here.

The 2010 Republican Gubernatorial Primary

On September 14th 2010 the Republican Party held its primary in New York. In the gubernatorial primary, party favorite Rick Lazio was defeated by the Tea Party Candidate: businessman Carl Paladino. Mr. Paladino won a comprehensive victory, with 62% of the vote to Mr. Lazio’s 38%.

In the long run, this primary does not matter much – if at all. By next month the primary will all but be forgotten by even the most politically intense folk. Most Americans probably weren’t even aware that there was a primary in the first place.

Yet, whatever its long-term importance, the primary constitutes a valuable tool for exploring New York’s electoral geography. Mr. Paladino’s victory revealed two interesting facts of New York politics. This post will explore the first one.

The Upstate-Downstate Divide

Picture the state of New York, and most Americans will think of a certain city. This fact has long frustrated the many folks who live in upstate New York – which contains more than seven or eight million people, depending on how one defines upstate.

New York state politics have thus been dominated by the divide between upstate and downstate. Upstate generally votes Republican on a local level; downstate votes heavily Democratic. The divide is also apparent in the battle over whether resources are to be spent upstate or in New York City.

On the presidential level, this pattern is relatively hard to discern:

Part 1

A look at upstate New York in the 2008 presidential election shows President Barack Obama dominating. While downstate New York casts an extremely Democratic ballot,  upstate New York also votes for the blue side.

Indeed, Democrats have actually won upstate New York for the past five elections. This table indicates how New York has voted in several recent elections:

Part 1

Only in 1988 does Governor Mike Dukakis lose the upstate vote, and even then Mr. Dukakis does fairly respectably. (Note: This table includes suburban Westchester and Rockland County as part of upstate; an alternative definition may not do so). Thus, it is somewhat difficult to find a difference between upstate and downstate New York when looking at presidential elections.

This was not the case with New York’s Republican gubernatorial primary. Here is a map of the results:

Part 1

This is a tremendous regional divide. Upstate New York votes overwhelmingly for Mr. Paladino, while downstate gives Mr. Lazio a strong vote, despite his overall poor performance. Indeed, in Erie County (Buffalo) Mr. Paladino actually got 93% of the vote. On the other hand, Long Island Suffolk County gave his opponent two-thirds of its support.

Not surprisingly, Mr. Paladino’s home is located in Buffalo, while Mr. Lazio represented a congressional district in central Long Island. Mr. Lazio was also born in Suffolk County. His long history with downstate New York led to considerable discontent upstate, and constituted one factor behind its landslide rejection of Mr. Lazio.

There is one final thing that must be noted, however. While Mr. Paladino definitely looks like a winner under the map above, the 3:2 split may look strange to seasoned observers of New York politics. Mr. Lazio, after all, is winning both New York City and its suburbs. Manhattan, Brooklyn, and Queens are supporting him by double-digits – while he is running very strongly in Long Island.

Democrats have won New York with similar maps. Here is one such map:

Part 1

As it turns out, Mr. Lazio would have indeed done a bit better under general election circumstances. That is, if Mr. Lazio had won the same percent of the vote in each county in the 2008 presidential election, he would have gained 40% of the vote. This is not an enormous change, but in a close election it means the difference between victory and defeat.

This seeming contradiction lies at the heart of another interesting truth that New York’s Republican primary revealed: namely, that Republicans do not exist in New York City. The next post will explore this strange phenomenon.