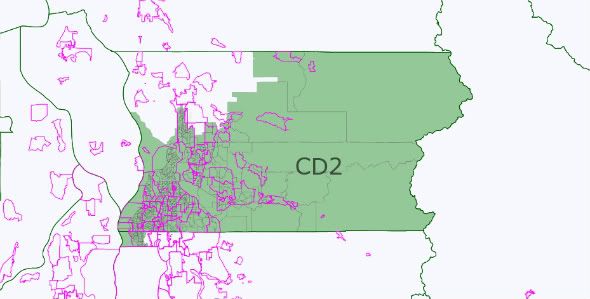
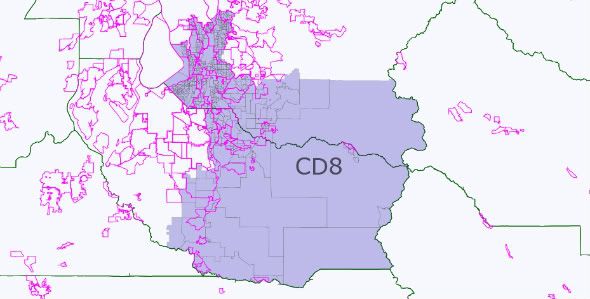
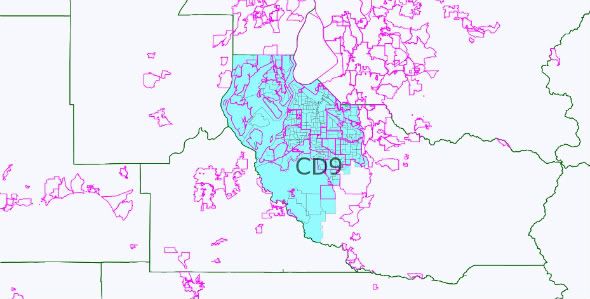
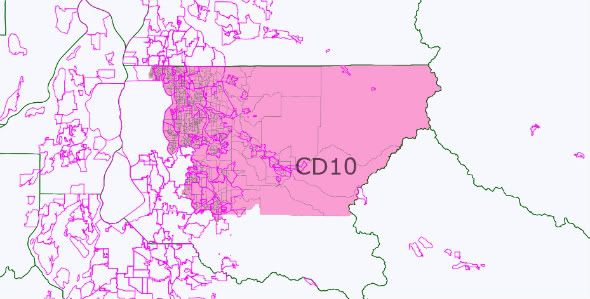
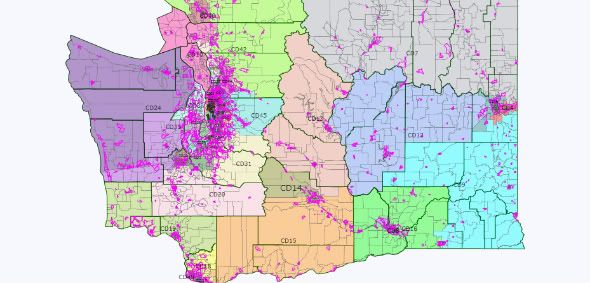
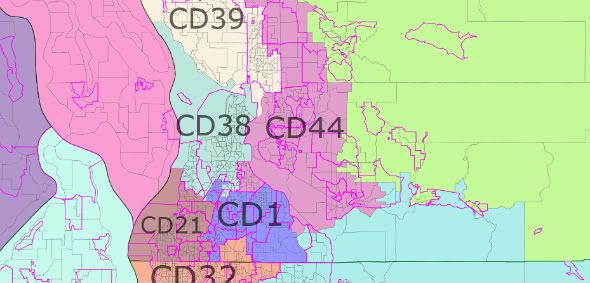
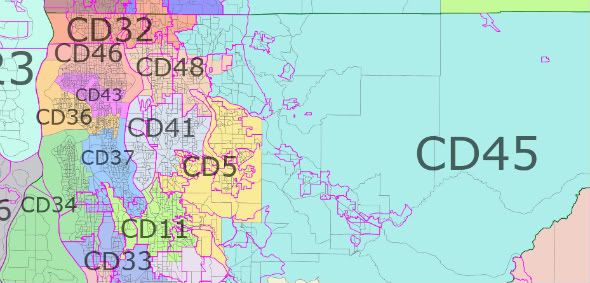
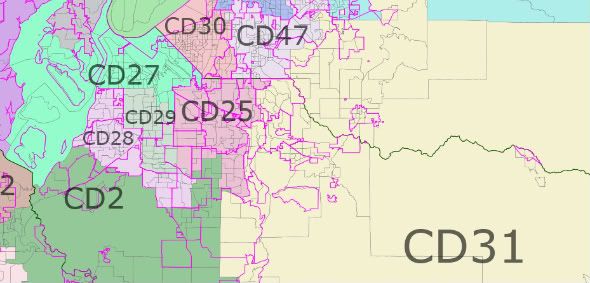
Choices in Washington Redistricting

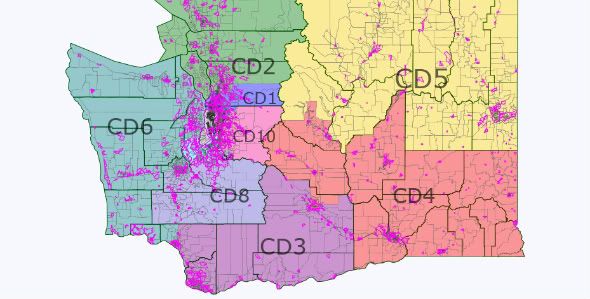
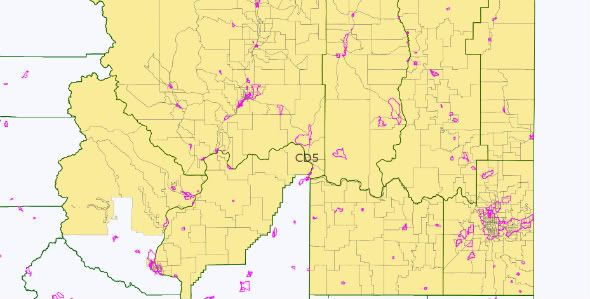
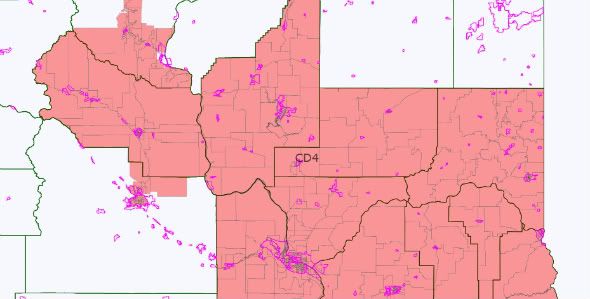
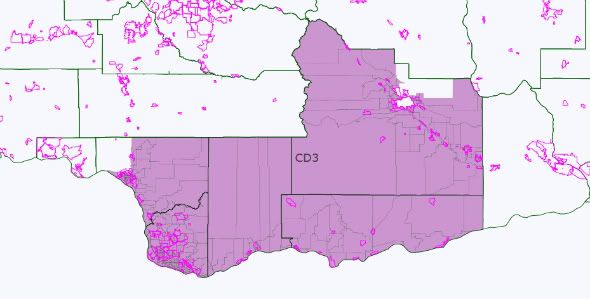
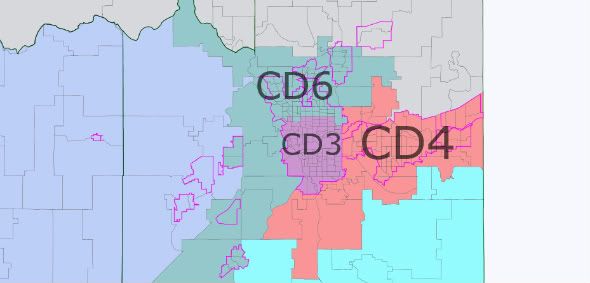
At the Washington State Democratic Central Committee meeting this past January, over lunch the delegates discussed the ramifications of the addition of a 10th Congressional District in the State. The goals discussed in the meeting was to ensure that a Democrat would be elected in the new 10th. There was general recognition that the 3rd would go from Vancouver to the outskirts of Yakama (along the Columbia River).

With three districts generally accounted for (the 3rd, 4th and 5th), the main question becomes how the Puget Sound area is divided. In Washington, the redistricting law states that plans should consider electoral competition and not purposefully favor or discriminate against any political party (among all of the normal provisions).

In practice, this means that the bipartisan redistricting commission gets the sign-off by the elected representatives (encouraging little change in the composition in the district, both geographic and partisan). For 2011, this means that Representative Dicks will want a more Democratic district (especially if he loses parts of Tacoma), and Representative Reichart wants a more rural, and Republican district.

With the addition of a 10th District in Washington, the choice facing the redistricting commission is to create 6-8 safe districts (3 safe Democratic 3 safe Republican) or to create a map with 4 safe districts (2 D – 2 R) and another 4 districts that are likely Democratic. (The difference really is should Democrats want to lock in a third safe Republican district in eastern King, Pierce, and Thurston counties or draw a map that is 7-3 in most years [including 2010]).

Photobucket

If the goal is to create 7 Democratic (or competitive) districts west of the Cascades (creating a 7-3 [or in the worst years a 6-4] split), then the existing Representatives should be willing to trade a bit of comfort and security for the potential for more Democratic representatives from Washington.

Some basic rules for redistricting in Washington:

1) While it may be the dream of many Democrats to split Seattle, it is not going to happen. The commission respects geographic cohesiveness, and sending a spur from Seattle to a) the Olympic Peninsula, or b) to Kirkland or Bellevue is not going to happen.

2) The redistricting commission likes to create competitive districts.

3) Two and a half districts will be in Eastern Washington.

Photobucket

Photobucket

Photobucket

Redistricting Washington

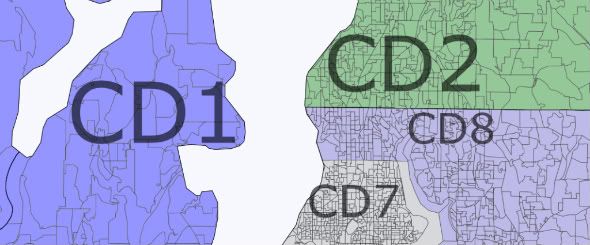
So, 6 districts left to draw. Two districts will have their roots in Whatcom, Skagit and Snohomish County. Representative Larson lives in Lake Stevens, west east of Everett. However, if Representative Inslee runs for Governor, then Larson could either run in the 1st or 2nd (and could be happy either way, since he would want more of Everett anyway).

For me, the key to redistricting Washington lies with not where the new 10th District goes, but what will the 6th District go? And, what does Representative Norm Dicks want from this round of redistricting?

The current 6th District includes Bremerton, Representative Dicks' residence, most of the Olympic Peninsula, and extends into Pierce County and has to shed 37,000 people.

If Representative Dicks gets anxious and wants a district that a) resembles his current district and b) becomes more Democratic, then the Democrats lose the redistricting game (and likely all decade). Either the 10th or the 8th District will be a Solid Republican district. If he is a team player, and accepts a Democratic leaning district that has lots of new constituents, Democrats win (or have a better chance of winning). Then, the 8th and 10th will be lean Democratic seats (or better).

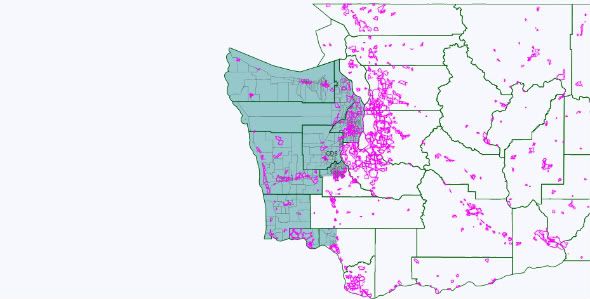
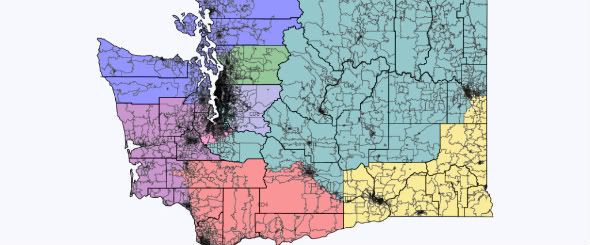
The following maps present two options for a 10th CD and the competitiveness of each district (again, the 3rd, 4th, and 5th stay the same).

Option 1: Dicks remains concerned about his reelection

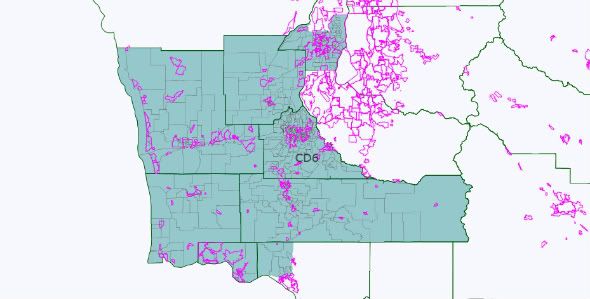
In this scenario, the 6th CD is the entire Olympic Peninsula, the Washington Coast, and most of Cowlitz County and the cities of Olympia, Tumwater and Lacey. While losing his portion of Tacoma, Dicks gains the remainder of Democratic-leaning Kitsap County, and Democratic leaning Olympia. While Dicks is secure about his reelection, the population of the state mean that a Republican-leaning district must be created.

Photobucket

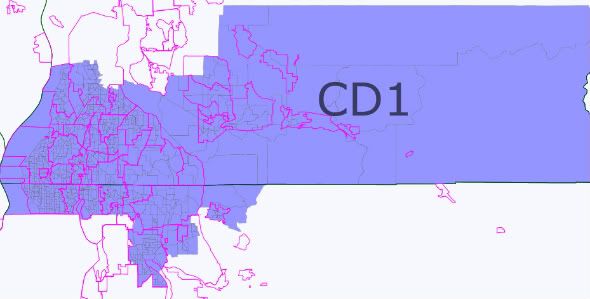
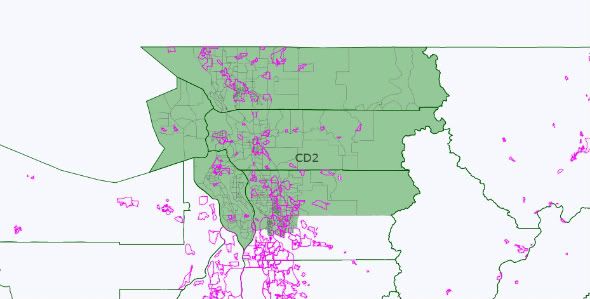
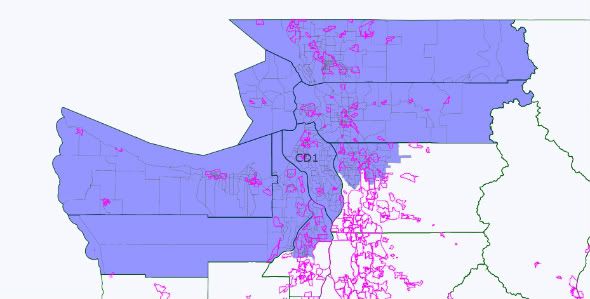
With the Olympic Peninsula off the map, the 1st and 2nd become located entirely in Whatcom, Skagit, and Snohomish County. The 2nd adds Everett, making Larson happy. The 1st (open) becomes southwestern Snohomish counties and several King county cities – Shoreline, Lake Forest Park, Kenmore, Redmond, Bothell and Woodinville.

Photobucket

Photobucket

Up to this point – good for the Democrats – 3 stronger seats.

South of Seattle, Representative Smith's (Tacoma) district can also be strengthened – include all of Tacoma and western Pierce County, and include the cities of Kent, Renton, Federal Way, and the other cities immediately South of Seattle not part of the 7th.

Photobucket

So, 4 stronger seats for the Democrats (and all geographically compact).

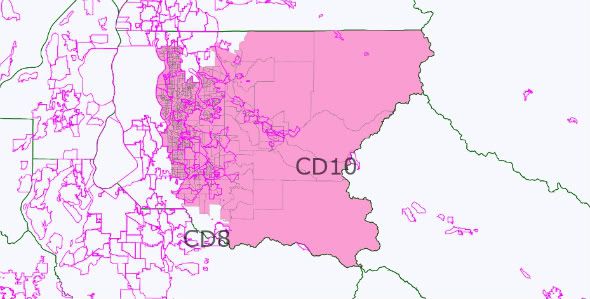
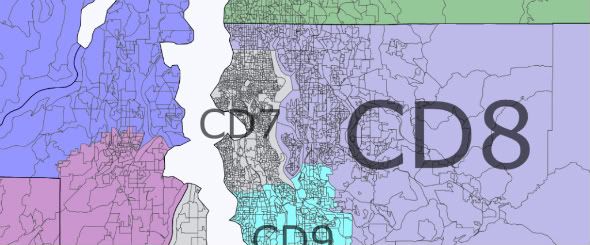
Now the rub. there are few Democratic areas left in the State to draw two more competitive districts (or better). The 10th ends up in Eastern King County centered around Bellevue. This is the area where Democrats have done well in 2006, 2008, and 2010.

Photobucket

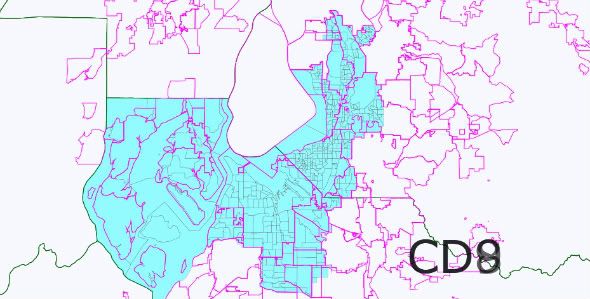
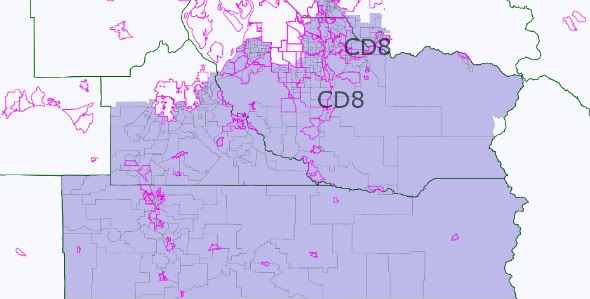
The elusive 8th district becomes the remainder of the State – Auburn, Eastern Pierce County, Lewis County, and rural portions of Thurston County.

Photobucket

So, the end result of Western Washington is 1 SR seat and 4 safer Democratic seats. In essence, this is the status quo and Washington's delegation would be 6-4 for the majority of the decade (with the slim possibility of winning back the 3rd).

But Democrats could do better.

Option 2: Dicks accepts a district with more new constituents

The 6th CD includes Bremerton and other Democratic portions of Kitsap county (Bainbridge Island), Olympia and all of Thurston County, and Pacific, Wahkiakum counties (as well as Lewis County). Every county (or portion of) the county is Lean D (or better) except for Lewis County. While the District would be lean D, and potentially competitive, it would still likely be a Democratic seat the entire decade.

Photobucket

With 2 counties and portions of Kitsap on the Olympic Peninsula not part of the 6th, you then draw a district across the Sound to Whatcom County (via Island and San Juan Counties). The 2nd CD can be all of Snohomish (with a portion of Democratic Shoreline).

Photobucket

Photobucket

So, here we have 2 likely Democratic district and 1 safe Democratic districts.

The 8th CD becomes a Democratic leaning district by adding the King County cities of Federal Way, Kent, Renton, Tukwila, Newcastle and SeaTac. While Representative Reichert still lives in the district, he has lots of new Democratic cities to deal with.

Photobucket

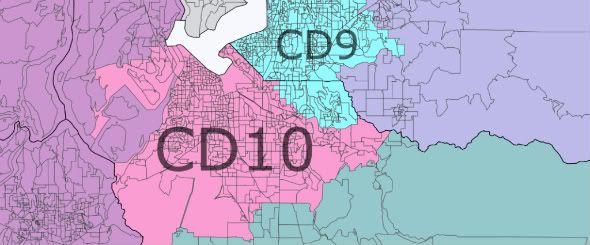
The 9th is a Pierce County district centered around Tacoma.

Photobucket

Again, this is two additional lean/likely Democratic districts.

The new 10th is now exclusively an Eastern King County district.

Photobucket

In this scenario, each district would be competitive (at worse for the Democrats), but likely, year in and year out, sending 7 Democrats to DC.

And, did I say from the outset that the commission likes competitive districts?

To summarize:

Option 1 (max deviation 174):

3 safe Democratic seats, 3 lean/likely Democratic seats, 3 safe Republican seats, 1 likely/lean Republican seat.

Option 2 (max deviation 140):

2 safe Democratic seats, 2 safe Republican seats, 4 lean/likely Democratic seats, 1 likely/lean Republican seat.

Bonus – State Legislature Map (max deviation 590):

Photobucket

Snohomish County

Photobucket

King County

Photobucket

Pierce County

Photobucket

Thurston County

Photobucket

Kitsap County

Photobucket

Clark County

Photobucket

Benton County

Photobucket

Spokane County

Photobucket


By what margin will Bob Shamansky win?

View Results

Loading ... Loading ...

Wyoming Rule – Analysis

Over the past few weeks there has been a flurry of diaries about the Wyoming Rule (California, Texas, New York, Pennsylvania, Tennessee, Maryland, Oregon, New Mexico, and my Washington map below). Many of these diaries asked at the end what they thought about the Wyoming Rule, and the intent of this diary is to examine some of the benefits and drawbacks of the Ruie itself. 

The primary benefit of the Wyoming Rule is that the districts are smaller for many states – or about 75%-80% the size of the current projected district size. California would go from 52 seats to 68, Washington from 10 to 12, and Oklahoma from 5 to 7. Other states would stay the same – Hawaii, Nebraska, and Rhode Island.  (The number of districts for each state was researched by borodino21). The range between states would drop from about 400k (Rhode Island to Montana) to 300k (South Dakota to Alaska).

The smaller district sizes in most states means that there are more opportunities to preserve communities of interest. For some states like North Carolina, this means it may be possible to create additional minority-majority or minority-influence districts. In other states, it may be possible to draw more CDs that encompass only one county or city.

While I do not wish to subscrible to albguy's method of creating as many Democratic districts as possible (while I do enjoy his method of pushing the limits of a redistricting map), the smaller districts may make it harder to create all Democratic seat maps.

In Washington, a more realistic map under the Wyoming Rule likely means two safe(r) Republican seats in Western Washington and two or three safe Republican seats in Eastern Washington. Now perhaps one or two of those districts may be better considered swing districts (especially a Vancouver to Yakama district), but the result of the Wyoming Rule is a 7-5 delegation (compared with the current 5-4 delegation with the possibility of a 6-4 delegation after the 2011 redistricting).

The Wyoming'd New York faces a similar problem. In jsramek's New York – the delegation would be 30 Democrats and 6 Republicans. This map also includes the cracking of Staten Island, which would probably not be politically viable – even for a solidly Democratic state legislature. While this is better than the 8 Republicans representing NY in the 2011-2012 Congress, many of the maps made for the Redistricting Contest would contain 1 or 2 Republicans out of New York's 28 Congressional Districts. 

The resaons for these results is that the smaller district sizes make it more difficult to crack Republican strongholds – or areas without overwhelming the nearby Democratic area. So, back to New York, at least 4 upstate districts are created as Republican vote sinks, instead of the possibilty of spreading them out. In Western Washington, eastern King, Pierce, Thurston and Clark counties are Republican areas, as well as Lewis and most of Cowlitz counties. In some maps, it is possible to divide those populations and combine them with more Democratic areas such as Vancouver, Olympia, Tacoma, and Bellevue to allow for Democrats to win those districts (but as in the 2010 elections, Republicans held on in WA 8 [East King and Pierce County] and won in WA 3 [SW Washington including Olympia]). With smaller districts, you can create two safe Republican districts in those Republican areas in exchange for two additional safe Democratic districts (and possibly another swing district). 

So, where does that leave us?  I think the advantages of the Wymonig Rule outweigh the drawbacks. More representation is better from a democracy standpoint, but it also helps Democrats in the big picture. For all of the concerns about not being able to maximize Democratic seats, the Republicans would not be able to either. In addition, more Congressional seats will also help Democrats in the Electoral College.


Washington Redistricting v.2.0

Earlier this year I posted a diary creating a 10 district Washington State. With the update to Dave’s Redistricting, I thought I would update my proposed redistricting map of Washington.

Washington has a bipartisan commission for redistricting, so at best the map is going to strive for balance or the creation of swing districts.

Photobucket

In this map, I make a return to the delegation maps of the 1960s, where the 2nd Congressional district connected Whatcom County along the Canadian border with Clallam County along the Pacific Ocean. (Actually, that district contained all or portions of Clallam, Island, Jefferson, King, San Juan, Skagit, and Snohomish Counties). Also in this map, the new 10th CD is an Tacoma (Pierce County) based district while the 3rd CD connects Bremerton with the Pacific Coast. Should this map be adopted, I would think that the delegation would be 7-3, and possibly 9-1 in a strong Democratic year if and as the cities Spokane and Yakama trend towards Democratic candidates.

Photobucket

CD 1 – Inslee (D – Bambridge Island) or open

White – 82%
Asian – 3%
Hispanic – 5%

Photobucket

As I wrote in the introduction, the 1st CD connects Whatcom County in the north with Jefferson County along the Olympic Peninsula. The district is connected via the Keystone to Port Townsend ferry. The district also includes the northern half of Kitsap County (Kingston and Bambridge Island), extending to the southern edge of Bremerton.

The district will be a swing (at worse) district that leans Democratic. Of the counties in the new district, Jefferson, Kitsap, and Whatcom county voted for Patty Murray, while Clallam still gave her 46%. While Rick Larsen won a squeaker in 2010, most of the Republican leaning area of his district (East Snohomish County) is now in the 2nd CD.

CD 2 – Larsen (D – Lake Stevens)

White – 83%
Asian – 6%
Hispanic – 5%

Photobucket


The 2nd is now entirely in Snohomish County. The only City not in the CD is Stanwood.

The district should be a sold Democratic district. There are 4 Democrats on the Snohomish County Council and 1 Republican. A portion of the Republican district is not in the 2nd CD, while the districts of the remaining 4 Democrats are in. Still, there is a potential for an upset in a bad year, but Patty Murray did win 51% of the vote in Snohomish County.

CD 3 – Norm Dicks (D – Bremerton)

White – 85%
Asian – 3%
Hispanic – 5%

The 3rd CD connects Bremerton in Kitsap County to Longview and Kelso in Cowlitz County. The district includes Olympia and Centralia and Chehalis in Lewis County (the district splits Lewis and Cowlitz counties [mostly down 1-5]). The district also includes Gig Harbor in Pierce County.

With Olympia and Bremerton, and as well as the Democratic lean along the Pacific Ocean (Murray won in Pacific, Gray’s Harbor, and Thurston counties), the district should remain a Democratic one.

Photobucket

CD 4 – Jamie Herrara (R – Camas)

White – 79%
Hispanic – 13%

The 4th CD is a Columbia River district and extends north to the City of Yakama.

Photobucket

For the near term, this would be a Republican district. Over time, it is possible that the City of Yakama returns to its Democratic roots (the area did elect Jay Inslee in 1992) and with Vancouver, become a Democratic-performing district.

CD 5 – Cathy McMorris-Rodgers (R – Spokane)

White – 83%
Hispanic – 10%

It may not be possible to elect a Democrat east of the Cascades, but combining the Tri-Cities with Spokane may be the only way to do so. The district includes the cities of Spokane and Spokane Valley in Spokane County, but nothing to the west or north.

The district does have the advantage of placing Representative Hastings (Pasco) and McMorris-Rodgers into the same district (but I would not expect them to run against each other).

Photobucket

CD 6 – Open or Doc Hastings (R – Pasco)

White – 79%
Hispanic – 15%

This 6th CD takes in all of the rest of Eastern Washington not in the 4th or 5th and supplements that population with a small portion of Eastern Pierce County. This is a solid Republican precinct.

CD 7 – Jim McDermott (D – Seattle)

White – 68%
African American – 8%
Asian – 13%
Hispanic – 6%

This is the City of Seattle and Vashon Island. Not much to say here (except this would be one area where having city boundaries on v.2.0 would be especially nice).

CD 8 – open

White – 82%
Asian – 9%
Hispanic – 4%

This district is the district that any of the challengers to Dave Reichert would have wanted. In the north, all of the northern King County cities (and reliably Democratic) (Shoreline, Lake Forest Park, Kenmore, Kirkland, Redmond), combine with Bellevue to balance the Republican portion of east King County.

Photobucket

CD 9 – Dave Reichert (R – Auburn)

White – 71%
African American – 6%
Asian – 10%
Hispanic – 7%

Photobucket

The 9th CD retains most of its current form, extending north to Renton and east to Auburn, while it loses most of its portion of Pierce County. What remains is all (or most of the south end of King County – a distinct region in King County politics).

This swing district that never really swung, becomes a more solidly Democratic district.

CD 10 – Adam Smith (D – Tacoma)

White – 73%
African American – 8%
Asian – 7%
Hispanic – 6%

The district includes Tacoma and portions of South and East Pierce County.

Pierce County is a swing County, but the Republican portions of Pierce County are not in this CD. The 6th CD has lots of east Pierce, and the 9th has a chunk of north-central Pierce County. A Democrat should retain this seat.

Photobucket

At the end of the day this map is compact, yet would probably yield a 7-3 Democratic split in the delegation most years. If there was another Republican wave, potentially 2 more Democrats could be endangered – in a Democratic wave, 2 Republicans would be endangered.

By what margin will Bob Shamansky win?

View Results

Loading ... Loading ...

Washington Redistricting 10 CDs

With the news that Washington state may receive a 10th Congressional District, I set out to develop a map that is favorable to Democrats and should lead to a 7-3 delegation split in bad years, and up to an 8-1 split in good years.

Washington has a bipartisan redistricting commission, so massive gerrymanders are off the table. When Washington received a 9th CD, the commission attempted to make the 9th competitive – I expect the same to happen with a 10th CD.

Anyway, this map creates a super-strong Republican seat east of the Cascades, and generally puts each major city in the Western portion of the state in its own district and connects that city with more rural portions of Western and Central Washington. (BTW, partisan data would be helpful here).

Photobucket

WA 1 (Inslee [open]-D) [Blue]

WA 1 still extends across Puget Sound to Kitsap County, but loses Bambridge Island and some Seattle precincts and extends to the eastern most portions of Snohomish County. The Kitsap portion of the District, as well as the western Snohomish portion should keep this District a safe Democratic one.

Photobucket

WA 2 (Larson D) [Green]

WA 2 retains much of its current form – Northwestern Washington. Like it does now, the district extends into Everett. If Larson holds on this year, the District should remain a Democratic hold.

WA 3 (open D) [purple]

WA 3 runs along the Columbia River and the Pacific Ocean. Inland it includes solidly Lewis County. In many years, this would be a Democratic seat, but control depends on who wins Clark County (and the City of Vancouver).

The coastal counties are more Democratic, and Skamania and Klicikat Counties did vote for Obama in 2008. In 2010 and 2012 this might be a tough hold, but as Vancouver becomes more solidly Democratic, so should the entire CD.

Photobucket

WA 4 (Hastings – R) [Red]

This district encompasses most of Eastern Washington – or at least Yakama and most of the low population counties east of the Cascades. Currently, both WA 4 and WA 5 are about 40-45% Democratic – this district would probably push that number to about 35%.

Tri-Cities

WA 5 (McMorris-Rogers – R) [Yellow]

While it may not be possible to create a safe Democratic district in Eastern Washington, connecting the Tri-Cities to Spokane may do the trick (to at least elect a Democrat – or make it a swing district). Whitman County voted for Obama and Spokane has two Democratic Senators in Olympia.

Spokane

WA 6 (Dicks-D) [Teal]

WA 6 connects Olypmia to Kitsap County and extends to the Pacific Ocean. All of these counties are fairly reliable Democratic counties. Fairly in the sense that King, Snohomish, and sometimes Pierce Counties lead the way on Democratic issues in the state.

WA 7 (McDermott – D) [Grey]

Seattle.

Puget Sound

WA 8 (Reichert – R) [Lavender]

WA 8 is strongly contested in 2010 by Suzan DelBene. Likely, the 2010 election will depend on how well she does in Pierce County.

To solidify the district, I chose to add several Democratic areas to the district – Renton and Kirkland. To add population to the district, I added the central Washington counties of Chelan and Kittitas. This is an area where I would like more partisan details, but both counties have voted for Democratic presidential candidates in the past.

Photobucket

WA 9 (Smith – D) [Bright Blue]

WA 9 was originally designed as a swing district twenty years ago – but has only been held by a Republican for only 2 years (1995-1997). For this map, it should stay a Democratic seat.

The district goes from the Seattle border to Puyallup and from Puget Sound to east King County.

WA 10 (open) [Magenta]

This new district is a Pierce County district. It includes Tacoma and Gig Harbor – and then races out to eastern Pierce county. This district should be competitive – or leaning Democratic in the worst years.

**Sorry for the quick write-up (I published the Diary before I was ready). Each district is + or – 744 from the ideal population size.

California Redistricting (Finally) with only 7 Republicans Safe

Also posted at http://frogandturtle.blogspot….

(Beware, this post is long so read if you have time.)

First, this is finally finished! You may have seen me mention this map in some comments and I kept saying it was a couple of weeks away a few months ago. It took me a couple of months to map and write, including when half of the write up mysteriously vanished.

This is not the most realistic plan in the world but I wanted to see how big a Democratic gerrymander I could create. I tried to keep only seven Republicans safe while making the other seats winnable for the Democrats. Although 2010 is definitely looking like a bad year for the Democrats, 2012 with Obama on the ticket should be better. 2010 should be better than expected but that’s another story. I drew this map assuming California has 53 congressional districts after the census. Yes, I know that keeping only seven Republicans safe could turn into a dummymander because I weakened too many Democrats. I hope to avoid that and I made current Democrats safe. Many of  the shakier seats should trend Democratic overtime so the Democrats will be able to pick up all the seats I made for them sometime in the decade if not 2012. I created 33 Safe Democratic, 9 Likely Democratic, 3 Lean Democratic, 2 Toss Up, 1 Likely Republican and 6 Safe Republican seats. Besides the Republican district, Obama does not win less than 53% of the vote in any district that is not safe or likely Republican. He wins 53% in only one district and 54% in two. Also, I gave the Hispanics four new districts while increasing the Asian population in the 32nd (renumbered 31st) district and 15th district. I also protected two of LA’s three African American representatives. Diane Watson is retiring so I made her district more Hispanic so the 35th (renumbered 34th) and 37th (renumbered 36th) districts will be more African American but the Hispanics will get an extra district. Also, I do not have demographic numbers for 2010 unfortunately. Here are the maps:

First, here’s a map of California’s current congressional districts. http://www.govtrack.us/congres…

Here, you can scroll down and click on California’s Congressional district names for information on them. http://en.wikipedia.org/wiki/C…

Photobucket

Northern California

1st District Mike Thompson (D) St. Helena (Blue)

Obama 203,307 62% McCain 117,072 36%

Change: McCain +8

Demographics: 13% Hispanic, 78% White

Communities of Interest: Redding, Santa Rosa, Eureka

Status: Safe Democratic

I removed most of Napa County except for Thompson’s home in St. Helena. I also added most of heavily Republican Shasta County. The North Coast keeps the district safely Democratic though.

2nd District Wally Herger (R) Chico (Green)

Obama 160,489 55%, McCain 122,712 43%

Change: Obama +24

Demographics: 16% Hispanic, 5% Asian, 72% White

Communities of Interest: Redding, Chico, Davis

Status: Lean Democratic

Herger’s seat makes a big turn to the left because I removed Shasta County and Republican parts of Butte County. I added parts of Democratic Sonoma and Yolo Counties. Herger is unfamiliar with these areas so he should have trouble making inroads in them. Although he still has his home in the district, I should say he will lose by seven points to a strong challenger. Also, Herger has been criticized in the past for not being an effective congressman. A race in a district like this will shake him up.

Photobucket

Sacramento area

3rd district Dan Lungren (R) Folsom

Obama 148,675 56% McCain 110,520 42%

Change: Obama +14

Demographics: 7% African American, 14% Hispanic, 7% Asian and 67% White

Communities of Interest: Sacramento, Folsom, Citrus Heights

Status: Likely Democratic

Lungren is already shaky in his current 49%-49% seat so a 56% Obama seat would be too Democratic for him. I added parts of Sacramento where he is not entrenched while removing Republican areas outside of Sacramento County. A strong challenger in 2012 when Obama is on the ballot should be able to knock off Lungren.

4th District Tom McClintock (R) Granite Bay (Red)

Obama 149,211 41% McCain 203,357 57%

Change: McCain +6

Demographics: 8% Hispanic, 85% White

Communities of Interest: Roseville, Lincoln, Rocklin

Status: Safe Republican

The only real change is that McClintock loses the Democratic Lake Tahoe area. He gets even safer with the addition of more Republican areas.

5th District Doris Matsui (D) Sacramento

Obama 165,279 62% McCain 96,765 36%

Change: McCain +16

Demographics: 12% African American, 17% Hispanic, 16% Asian, 50% White

Communities of Interest: Sacramento, Elk Grove,

Status: Safe Democratic

Although her district picks up some moderate Sacramento suburbs, her district still remains strong for her with a base in Sacramento.

Photobucket

Greater San Francisco area

6th District Lynn Woolsey (D) Petaluma (Teal)

Obama 223,326 68% McCain 99,268 30%

Change: McCain +16

Demographics: 18% Hispanic, 5% Asian, 71% White

Communities of Interest: San Rafael, Petaluma, Napa, Yuba City

Status: Safe Democratic

First, this is my home district! I am not too pleased with this district because Central Valley Democrats will have an influence over voters next to San Francisco. The district is still anchored in the North Bay so when Woolsey retires, a North Bay Democrat will replace her. A good candidate is Jared Huffman, a liberal State Assembly member from Marin County which cast 48% of the district’s Obama votes with 1/3 of the district’s population. Marin County does not have a representative in the State Senate or the House so when Woolsey retires, Marin probably will have one in the House (finally.)

7th District George Miller (D) Martinez

Obama 182,391 68%, McCain 83,750 31%

Change: McCain +8

Demographics: 14% African American, 20% Hispanic, 14% Asian, 46% White

Communities of Interest: Vallejo, Fairfield, Pittsburg

Status: Safe Democratic

George Miller loses most of Richmond and gains all of Solano County which drops the Obama percentage a bit but Miller is still safe.

Photobucket

San Francisco/Oakland

8th District Nancy Pelosi (D) San Francisco

Obama 282,287 85%, McCain 41,850 12%

Change: McCain +0

Demographics: 8% African American, 15% Hispanic, 29% Asian, 44% White

Communities of Interest: San Francisco

Status: Safe Democratic

Keeping all of San Francisco except part of the Sunset District, the district does not change a bit.

9th District Barbara Lee (D) Oakland

Obama 249,791 84%, McCain 41,860 14%

Change: McCain +8

Demographics: 27% African American, 19% Hispanic, 14% Asian and 36% White

Communities of Interest: Oakland, Berkeley, Lafayette

Status: Safe Democratic

Lee’s district gets a bit more Republican by going into the less Democratic cities in the San Ramon Valley such as Danville and Orinda but still stays extremely safe.

10th District John Garamendi (D)

Obama 208,364 65% McCain 108,189 33%

Change: McCain +0

Demographics: 15% Hispanic, 9% Asian, 67% White

Communities of Interest: El Cerrito, Concord, Antioch, Lodi

Status: Safe Democratic

This district keeps its anchor in north-central Contra Costa County but gains mostly white but heavily Democratic neighborhoods in Oakland and goes further into the Central Valley to pick up Republican parts of San Joaquin County. Also for Garamendi, the district picks up a few more precincts in Sacramento County.

11th District Jerry McNerney (D) Pleasanton

Obama 164,551 58% McCain 115,845 40%

Change: Obama +8

Demographics: 5% African American, 19% Hispanic, 11% Asian, 61% White

Communities of Interest: Pleasanton, Oakley, Tracy

Status: Likely Democratic

McNerney gets safer. I was able to give him Democratic Castro Valley and Oakley while removing the Republican area around Lodi. I slipped in Livermore too because Tauscher does not represent the 10th anymore and she wanted Livermore in her district. McNerney also picks up a few precincts in Stockton from the 18th district. Most of McNerney’s old territory is in the district too.

12th District Jackie Speier (D) Hillsborough

Obama 216,684 74% McCain 70,455 24%

Change: McCain +0

Demographics: Hispanic 20%, Asian 27%, 46% White

Communities of Interest: South San Francisco (the industrial city,) Redwood City, Half Moon Bay

Status: Safe Democratic

The district picks up the San Mateo County coastline and part of Redwood City but besides that, the district remains the same.

13th District Pete Stark (D) Fremont

Obama 183,890 74%, McCain 58,035 24%

Change: McCain +0

Demographics: 7% African American, 25% Hispanic, 23% Asian, 40% White

Communities of Interest: Hayward, Fremont, Santa Clara

Status: Safe Democratic

Stark’s district loses some of Fremont to the plurality Asian 15th and gains minority majority areas in Sunnyvalle and Santa Clara. These changes should not affect the district much.

Photobucket

South Bay (ignore the unassigned precincts, if I assigned one, all of them would be assigned. No one lives in them either.)

14th District Anna Eshoo (D) Atherton

Obama 220,962 70% McCain 90,352 28%

Change: McCain +6

Demographics: 13% Hispanic, 17% Asian, 64% White

Communities of Interest: Mountain View, Los Altos, San Jose

Status: Safe Democratic

The district loses all of Santa Cruz County and goes into mostly white areas formerly in the 15th district. Although the changes rise the McCain percentage a bit, Eshoo is still very safe and has her home in the district.

15th District Mike Honda (D) San Jose

Obama: 170,000 70% McCain 69,345 28%

Change: Obama +4

Demographics: 18% Hispanic, 43% Asian, 31% White

Communities of Interest: Fremont, San Jose, Cupertino

Status: Safe Democratic

This is one of the two Asian plurality districts I created on the map. I added Union City and Asian parts of Fremont while removing white neighborhoods in western San Jose. Honda should be safe here.

Photobucket

Central/Southern California

16th District Zoe Lofgren (D) San Jose

Obama 130,902 67% McCain 60,558 32%

Change: McCain +6

Demographics: 13% Asian, 50% Hispanic, 29% White

Communities of Interest: Fresno, Watsonville, San Jose

Status: Safe Democratic

I think Zoe is a great representative but I had to create more districts for Hispanic representatives. This district keeps Hispanic areas in San Jose and picks up Hispanic areas in San Benito, Santa Cruz and Fresno Counties. Although 50% Hispanic is barely a majority, the number should be 54% about now and Hispanics outside her district are not used to voting for her in the primary.

17th District Sam Farr (D) Carmel (purple)

Obama 216,197 65% McCain 109,291 33%

Change: McCain +14

Demographics: 17% Hispanic, 6% Asian, 71% White

Communities of Interest: San Carlos, Santa Cruz, Monterey

Status: Safe Democratic

The district gets whiter and safer for Farr. It is interesting though having a district represent Peninsula and San Luis Obisbo communities. I removed Hispanic parts of Monterey County and San Benito County while adding Republican eastern San Luis Obisbo County as well as some white San Mateo County neighborhoods. Farr is still very safe.

18th District Dennis Cardoza (D) Atwater

Obama 96,786 61% McCain 59,722 37%

Change: Obama +4

Demographics: 6% African American, 46% Hispanic, 8% Asian, 36% White

Communities of Interest: Stockton, Modesto, Merced

Status: Safe Democratic

Cardoza loses whiter parts of Merced County and picks up more Hispanic neighborhoods in Madera County, making the district a tad more Democratic and Hispanic.

Photobucket

Fresno area

19th District George Radanovich (R) Mariposa (light green)

Obama 115,407 41% McCain 157,413 57%

Change: McCain +10

Communities of Interest: Clovis, Madera, Merced

Status: Safe Republican

Radanovich’s district was safe already but now it is even safer with the removal of Democratic parts of Fresno and the inclusion of Republican parts of Merced. Also, Yosemite National Park which is Democratic was removed.

20th District Jim Costa (D) Fresno (tan/pink)

Obama 91,480 59% McCain 61,190 40%

Change: McCain +2

Demographics: 6% African American, 55% Hispanic, 7% Asian, 27% White

Communities of Interest: Fresno, Salinas, Shafter

Status: Safe Democratic

Although Costa’s district picks up Democratic and Hispanic areas in Monterey County, the district grows more Republican as it extends into Republican white areas around Fresno formerly in the 19th district. Costa’s district is still Hispanic and Democratic.

21st District Devin Nunes (R) Tulare

Obama 70,892 53% McCain 61,228 46%

Change: Obama +22

Demographics: 63% Hispanic, 25% White

Communities of Interest: Bakersfield, Visalia, Delano

Status: Likely Democratic

This is the new Hispanic majority district in the Central Valley. Nunes’s district now takes in Hispanic parts of Fresno County and Hispanic parts of Tulare County. The district also takes in Hispanic parts of Bakersfield. This district is probably too Hispanic for Nunes so he will probably not run here. The Democrats should find a Hispanic candidate who will help increase the Obama percentage by turning out the Hispanics and having them vote more Democratic. Even if Nunes runs, he should lose.

22nd District Kevin McCarthy (R) Bakersfield

Obama 96,063 37% McCain 161,271 61%

Change: McCain +2

Demographics: 22% Hispanic, 67% White

Communities of Interest: Bakersfield, Visalia, California City

Status: Safe Republican

McCarthy’s district changes as it loses San Luis Obisbo County and picks up Republican parts of Tulare and Ventura Counties. It even goes into Simi Valley which is close to the San Fernando Valley. Nunes might run in this district because the 21st is too Democratic for him. McCarthy should win because most of his current district is in the new 22nd district.

23rd District Lois Capps (D) Santa Barbara

Obama 187,384 61% McCain 115,227 37%

Change: McCain +10

Demographics: 31% Hispanic, 60% White

Communities of Interest: San Luis Obisbo, Santa Barbara, Ventura

Status: Safe Democratic

Capps’s district gets less Democratic. I removed heavily Hispanic Oxnard and added the Republican interior of Santa Barbara County. I also added Ventura and Ojai which lean Democratic. The only place where Capps’s district is a line along the coast is in San Luis Obisbo County. Although her district becomes similar to the competitive 1990’s lines, she is entrenched enough and the areas trended Democratic enough to protect her.

Photobucket

Greater Los Angeles area

24th District Elton Gallegy (R) Simi Valley

Obama 149,125 59% McCain 100,007 40%

Change: Obama +16

Demographics: 39% Hispanic, 9% Asian, 45% White

Communities of Interest: Oxnard, Moorpark, San Fernando Valley

Status: Likely Democratic

Gallegy’s district gets much more Democratic and the Hispanic population rises from 24% to 39% with the inclusion of Oxnard, Hispanic areas in the San Fernando Valley and the loss of interior Santa Barbara County. Although Gallegy is a popular incumbent, the 24th district is too Democratic. He is also not entrenched in Oxnard and the San Fernando Valley. This should get him to retire which he has been considering. This is a good district for Brad Sherman to run in because his district is combined with the more entrenched Howard Berman. The 24th also contains part of Sherman’s current district. If Sherman ran, he would definitely win here.

25th District Buck McKeon (R) Santa Clarita

Obama 135,401 55% McCain 106,766 43%

Change: Obama +10

Demographics: 9% African American, 31% Hispanic, 51% White

Communities of Interest: Lancaster, Victorville, South Lake Tahoe

Status: Toss Up/Tilt Democratic

Although Buck McKeon does not live in the district, it belongs to him because it contains most of his old territory. It will be harder for him to win because I added the Democratic Lake Tahoe area, moved Republican Santa Clarita into the 27th and added a few Hispanic neighborhoods in the San Fernando Valley. Although McKeon is popular, the district is trending Democratic, especially around Lancaster and Palmdale. If the Democrats find a great candidate, they should be able to kick off McKeon.

26th District Vacant (D)

Obama 128,868 63% McCain 71,638 36%

Change: N/A

Demographics: 5% African American, 56% Hispanic, 8% Asian, 28% White

Communities of Interest: Upland, Glendora, San Fernando

Status: Safe Democratic

This new district is also a new Hispanic majority district. It looks like David Dreier’s (R) current district but this district picks up heavily Hispanic areas instead of areas that lean Republican. It does contain Glendora which is Republican though. Still, a Democratic should have no trouble winning here and a 56% Hispanic population (and increasing) should be enough to elect a Hispanic representative.

Photobucket

Inner LA area (I removed the numbers to make the districts easier to see. You can see the numbers in the picture above this one.)

27th District Howard Berman (D) vs. Brad Sherman (D) Green

Obama 204,550 65% McCain 104,583 33%

Change: McCain +22

Demographics: 20% Hispanic, 8% Asian, 64% White

Communities of Interest: Santa Clarita, San Fernando Valley, Burbank

Status: Safe Democratic

Berman’s district gets less Democratic with the inclusion of Santa Clarita and more white but remains heavily Democratic. Sherman has less territory here than Berman so if I were Sherman, I would run in the 24th District which has part of Sherman’s current territory.

28th District Adam Schiff (D) Burbank (originally the 29th)

Obama 179,592 68% McCain 80,069 30%

Change: McCain +0

Demographics: 6% African American, 32% Hispanic, 13% Asian, 43% White

Communities of Interest: Pasadena, Glendale, La Canada Flitridge

Status: Safe Democratic

Schiff’s district remains pretty similar with a high enough white population to keep him in office and Democratic.

29th District Henry Waxman (D) Los Angeles (originally the 30th)

Obama 245,543 68% McCain 111,756 30%

Change: McCain +4

Demographics: 10% Hispanic, 9% Asian, 76% White

Communities of Interest: Thousand Oaks, Beverly Hills, Santa Monica

Status: Safe Democratic

Waxman’s district picks up marginal Thousand Oaks and loses a few Democratic areas in the San Fernando Valley. These minor changes do not affect the district’s strong Democratic lean.

30th District Xavier Beccara (D) Eagle Rock (originally the 31st)

Obama 141,239 81% McCain 29,245 17%

Change: Obama +2

Demographics: 5% African American, 61% Hispanic, 15% Asian, 16% White

Communities of Interest: Monterey Park, Los Angeles

Status: Safe Democratic

Beccara’s district was formerly 70% Hispanic but now has less Hispanics with the inclusion of white areas formerly in Watson’s district. Beccara’s district is still heavily Hispanic and safely Democratic though.

31st District Judy Chu (D) Monterey Park (tan) (originally the 32nd)

Obama 132,559 62% McCain 78,365 36%

Change: McCain +12

Demographics: 39% Hispanic, 38% Asian, 18% White

Communities of Interest: El Monte, Temple City, Walnut

Status: Safe Democratic

I know that Asians do not vote as one bloc but I think if given the choice, they will support an Asian candidate over a Hispanic one. Chu’s district gets more Asian with a small line to Walnut and Diamond Bar and the exclusion of Baldwin Park and the vicinity. I wanted to protect communities of interest but the district had to follow the VRA. Her district gets more Republican but she is still safe.

32nd District Diane Watson (D) Los Angeles (originally the 33rd) Orange color

Obama 149,611 83% McCain 28,305 16%

Change: McCain +8

Demographics: 20% African American, 53% Hispanic, 11% Asian, 12% White

Communities of Interest: Los Angeles, Culver City, Huntington Park

Status: Safe Democratic

Watson is retiring and the Hispanic population is getting too high in Los Angeles to keep three districts with African American representatives. I removed white areas in the northern part of the district and added Hispanic areas on the east and west sides of the original 35th district while taking out some African American areas in the district’s center. The Hispanic population will keep growing so the district should elect a Hispanic.

33rd District Lucille Roybal Allard (D) Los Angeles (formerly the 34th)

Obama 123,083 66% McCain 59,211 32%

Change: McCain +18

Demographics: 74% Hispanic, 18% White

Communities of Interest: Huntington Park, Downey, La Habra

Status: Safe Democratic

Allard’s district gets more Republican with losing some Hispanic areas in Los Angeles and adding whiter Whitter and La Habra. Although La Habra is Republican, Allard’s district is still safe and Democratic.

34th District Maxine Waters (D)

Obama 202,877 88% McCain 23,877 10%

Change: Obama +10

Demographics: 43% African American, 41% Hispanic, 7% Asian, 6% White

Communities of Interest: Los Angeles, Inglewood, Gardena

Status: Safe Democratic

Waters’s district gets safer as the African American population increases from 34% to 43%. Also, something interesting is you can see how high African American turnout really was by looking at the precincts. There were 930 votes in a 92% African American precinct with 1,380 people.

35th District Jane Harman (D) Venice (formerly the 36th) Purple

Obama 192,875 62% McCain 113,650 36%

Change: McCain +4

Demographics: 26% Hispanic, 15% Asian, 51% White

Communities of Interest: Torrance, Redondo Beach, Manhattan Beach

Status: Safe Democratic

Harman’s district gets more Republican with the addition of Rancho Palos Verdes which leans Republican. Communities in the district’s northern part like Venice keep Harman safe though.

Photobucket

Orange County area

36th District Laura Richardson (D) Long Beach (formerly the 37th)

Obama 162,948 71% McCain 61,850 28%

Change: McCain +18

Demographics: 22% African American, 40% Hispanic, 11% Asian, 23% White

Communities of Interest: Carson, Compton, Seal Beach

Status: Safe Democratic

Adding Orange County communities that lean Republican such as Seal Beach and Los Alamitos make this district more Republican. They also reduce the Hispanic population by a few points though. Richardson should have no problems from Republicans in a district where McCain won 28% of the vote though.

37th District Grace Napolitiano (D) Norwalk (formerly the 38th district)(blue)

Obama 131,462 67% McCain 59,629 31%

Change: McCain +8

Demographics: 66% Hispanic, 15% Asian, 14% White

Communities of Interest: Baldwin Park, Chino Hills, Pico Rivera

Status: Safe Democratic

Grace Napolitiano (D) has her home in the 38th district but she should run here because this district has most of her current district. The district becomes a bit gerrymandered by having the 32nd cut into the middle of it. Also, her district gets Republican Chino Hills. It is still safely Democratic though.

38th District Linda Sanchez (D) Lakewood (formerly the 39th)

Obama 135,584 60% McCain 87,210 38%

Change: McCain +12

Demographics: 6% African American, 54% Hispanic, 9% Asian, 29% White

Communities of Interest: Lynwood, Bellflower, Fullerton

Status: Safe Democratic

Napolitiano should run in the 37th district so Sanchez should be safe from a primary challenge. Also, the district should be Hispanic and Democratic enough to protect her from Republicans. Her district does get weaker with the addition of Republican parts of Fullerton though.

39th District Ed Royce (R) Fullerton (formerly the 40th district)

Obama 113,574 54% McCain 93,975 44%

Change: Obama +14

Demographics: 40% Hispanic, 18% Asian, 35% White

Communities of Interest: Norwalk, Cypress, Anaheim

Status: Toss Up/Tilt Democratic

Royce’s district gets much more Democratic with the addition of Democratic parts of Anaheim, Norwalk and he loses Republican parts of Fullerton to the 42nd. Royce is pretty entrenched in his district but not in the Norwalk area so Democrats have a strong shot at replacing him. I wish I could have done more to protect communities of interest in this district though. Also, it would not be easy for a Republican to win in a 35% White district (and decreasing.)

Photobucket

Inland Empire

40th District David Dreier (R) San Dimas (formerly the 26th)

Obama 127,168 58% McCain 89,498 40%

Change: Obama +14

Demographics: 7% African American, 46% Hispanic, 7% Asian, 37% White

Communities of Interest: Pomona, Upland, Rancho Cucamonga

Status: Likely Democratic

Dreier is a pretty popular incumbent but even he will have trouble in a 58% Obama district with unfamiliar territory such as Azusa, Ontario and Pomona. He also loses the most Republican parts of his current district. Dreier will probably not run and a Democrat will win easily. If Dreier runs, he will probably not be strong enough to compete with the new Democratic areas. I hope a Hispanic politician wins this seat and although Hispanics do not make a large share of voters, there should be more in the Democratic primary.

41st District Jerry Lewis (R) Redlands

Obama 104,391 41% McCain 147,051 57%

Change: McCain +6

Demographics: 20% Hispanic, 69% White

Communities of Interest: Hesperia, Beaumont, Yucaipa

Status: Safe Republican

Lewis was extremely safe before and he gets even safer. Enough said.

42nd District Gary Miller (R) Diamond Bar

Obama 131,169 40% McCain 189,640 58%

Change: McCain +10

Demographics: 15% Hispanic, 8% Asian, 71% White

Communities of Interest: Yorba Linda, Murrieta, Rancho Santa Margarita

Status: Safe Republican

Miller loses his home but he does not have to live in this district to run. His district gets more Republican by picking up the Lake Forest area formerly in the 44th and Murrieta formerly in the 45th. He has no worries.

43rd District Joe Baca (D) Rialto

Obama 107,522 66% McCain 52,753 32%

Change: McCain +4

Demographics: 14% African American, 51% Hispanic, 5% Asian, 27% White

Communities of Interest: San Bernadino, Fontana, Ontario

Status: Safe Democratic

Baca’s district gets less Hispanic but the Hispanic population is growing quickly and he is entrenched enough to survive. He should have no problems from Republicans though.

44th District Ken Calvert (R) Corona

Obama 92,733 56% McCain 70,846 43%

Change: Obama +12

Demographics: 7% African American, 43% Hispanic, 5% Asian, 41% White

Communities of Interest: Riverside, Norco, Colton

Status: Likely Democratic

In 2008, Calvert barely won reelection but he lost Riverside County. Now with the Republican parts of Orange County removed, Calvert is in trouble. I also removed Republican areas in Riverside County too and the addition of heavily Hispanic Colton does not help Calvert either. Since Calvert was already weak, it should not be too difficult to find a challenger, get the DCCC interested and kick out Calvert.

45th District Mary Bono (R) Palm Springs

Obama 113,612 57% McCain 82,064 42%

Change: Obama +10

Demographics: 10% African American, 36% Hispanic, 46% White

Communities of Interest: Moreno Valley, Perris, San Jacinto

Status: Lean Democratic

Bono is a popular moderate incumbent but she will probably lose here. I added Democratic Perris and Lake Elsinore while removing Hemet. Also, the district has fast growing African American and Hispanic populations so if a Democrat is not reelected in 2012, a Democrat certainly will be soon.

46th District Dana Rohrabacher (R) Huntington Beach

Obama 163,591 55% McCain 127,405 43%

Change: Obama +10

Demographics: 23% Hispanic, 13% Asian, 58% White

Communities of Interest: Long Beach, Irvine, Costa Mesa

Status: Lean Democratic

Rohrabacher keeps most of his old district where he is entrenched. Still, the addition of Irvine and Democratic Long Beach areas should be enough to unseat him with a good candidate.

47th District Loretta Sanchez (D) Garden Grove

Obama 89,040 55% McCain 69,075 43%

Change: McCain +10

Demographics: 55% Hispanic, 19% Asian, 21% White

Communities of Interest: Santa Ana, Anaheim, Tustin

Status: Likely Democratic

Sanchez’s district gets less Democratic and Hispanic but Sanchez is entrenched and should win Hispanic by large margins.

48th District John Campbell (R) Irvine  Peach

Obama 135,283 48% McCain 144,225 51%

Change: McCain +3

Demographics: 21% Hispanic, 7% Asian, 65% White

Communities of Interest: Vista, Oceanside, Lake Forest

Status: Likely Republican

Yes, I know Campbell is a birther but I realized that if I tried to get rid of him, I would make other seats safer for Republicans that I wanted Democratic. Campbell’s district is mostly shifted out of the Irvine area into more conservative Vista and Oceanside. By the end of the decade, Campbell should be vulnerable but for now, he is unfortunately safe.

49th District Darrell Issa (R) Vista

Obama 113,663 39% McCain 175,745 59%

Change: McCain +12

Demographics: 18% Hispanic, 73% White

Communities of Interest: Hemet, Temecula, Poway

Status: Safe Republican

Issa’s home is not in the district but he should not mind. His district gets more Republican with the loss of Perris and Lake Elsinore.

Photobucket

San Diego

50th District Brian Bilbray (R) Carlsbad

Obama 187,575 56% McCain 144,396 42%

Change: Obama +10

Demographics: 19% Hispanic, 6% Asian, 70% White

Communities of Interest: Carlsbad, Escondido, San Diego

Status: Likely Democratic

Bilbray has faced close races in his currently marginal district but the addition of liberal parts of San Diego near the coast make the district more Democratic. He also loses more conservative areas in the east to the 53rd district. These changes should be enough to elect a Democrat.

51st District Bob Filner (D) San Diego

Obama 112,770 63% McCain 64,790 36%

Change: McCain +0

Demographics: 7% African American, 62% Hispanic, 10% Asian, 19% White

Communities of Interest: Indio, El Centro, Chula Vista

Status: Safe Democratic

I think Bob Filner is fine but I wanted another Hispanic congressman so I increased the Hispanic population from 53% to 62%. Although Filner has not faced many challenges recently, the change in population should attract a strong Hispanic candidate.

52nd District Duncan Hunter Jr. (R) Lakeside

Obama 135,237 56% McCain 101,445 42%

Change: Obama +22

Demographics: 7% African American, 29% Hispanic, 9% Asian, 51% White

Communities of Interest: La Mesa, El Cajon, Chula Vista

Status: Likely Democratic

This district undergoes one of the largest partisan changes under my plan. Duncan Hunter Jr. is new to this district. The addition of Chula Vista and Democratic parts of San Diego unfamiliar with him (and his father) will not help him. The changes should make the district Democratic enough to elect a Democrat.

53rd District Susan Davis (D) San Diego

Obama 167,156 60% McCain 107,595 38%

Change: McCain +16

Demographics: 7% African American, 24% Hispanic, 14% Asian, 51% White

Communities of Interest: Cornado, Imperial Beach, San Diego

Status: Safe Democratic

Davis’s district goes inland and therefore gets more Republican but coastal areas keep this district Democratic.

Still want more election analysis? If yes, please check out my blog http://frogandturtle.blogspot…. Thanks! I have some posts there I have not posted here yet.

By what margin will Bob Shamansky win?

View Results

Loading ... Loading ...
New Jersey Redistricting with Christie in Office

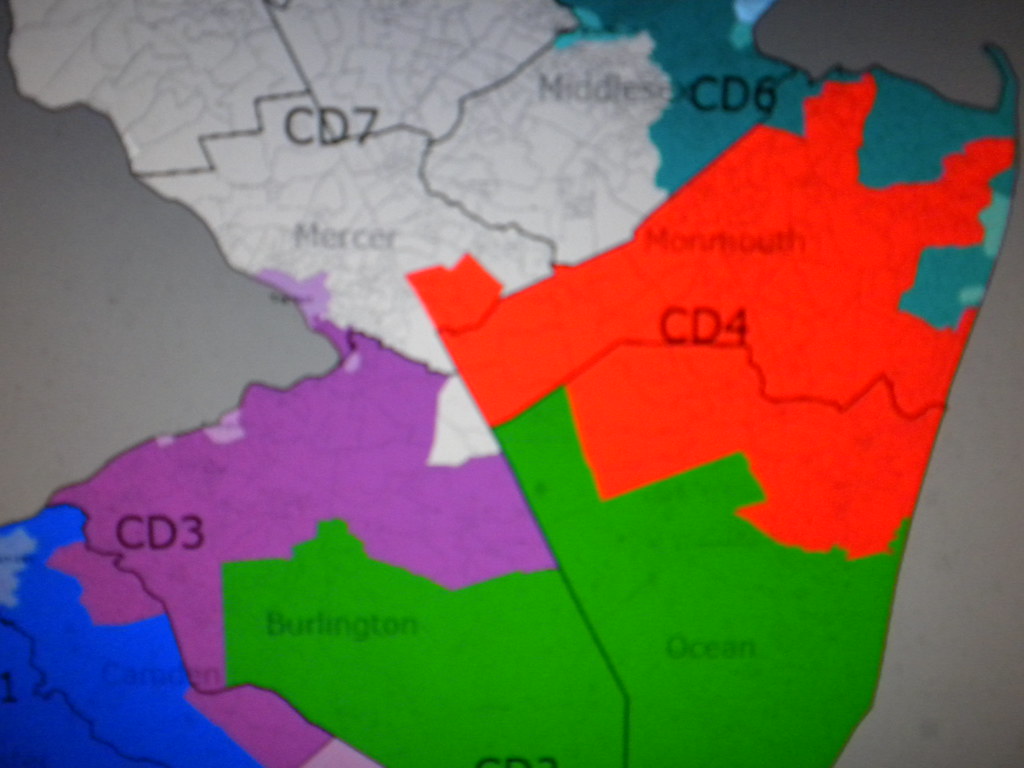
The census should show that New Jersey will lose one congressional district. Currently, New Jersey has 8 Democrats and 5 Republicans representing it in the House of Representatives. The independent comission should aim for a bipartisan plan. I combined the districts of Rush Holt (D) and Leonard Lance (R) in a district that leans Democratic but Lance can win in it since it contains most of his current district. I strengthened all the other incumbents and kept the 10th and 12th district African American and Hispanic majority respectively. For this map, I tried to not make it too convoluted because realistically, I do not see that happening. Also, I calculated the partisan data for these districts by town and I tried not to split the towns. I had to in a few cases but the partisan data should be accurate most of the time. Also, I calculated it for the top two candidates only. Here are some helpful links

For election results by county: http://www.uselectionatlas.org…

For results by town: http://njelections.org/2008_ge…

For map of current congressional districts: http://www.govtrack.us/congres…

For map of the state: maps.google.com

Southern New Jersey

Southern New Jersey

Camden Area

Camden Area

District 1 Rob Andrews (D) Haddon Heights

Demographics: 17% African American, 10% Hispanic and 68% White

Partisan data: Obama McCain Percentages

   Camden 132785 57336 70%-30%

  Gloucester 73201 56669 56%-44%

  Salem 3927 2309 63%-37%

  Total   209913 116314 64%-36%

Communities of interest: Camden, Pennesauken

The district grows a bit more Republican. I removed the Democratic neighborhoods in Burlington County to help strengthen the 3rd district. I also added more of Gloucester County and the areas I added are marginal. I also added a heavily Democratic slice of Salem County. Overall, I made mostly minor changes so Rob Andrews should have no trouble with reelection. Status is Safe Democrat

District 2 Frank LoBiondo (R) Ventor

Demographics: 9% African American, 11% Hispanic and 76% White

Partisan data:  Obama   McCain

Cumberland 21720 14211 60%-40%

Cape May 22893 27288 46%-54%

Atlantic 58904 41306 59%-41%

Burlington 13718 16638 45%-55%

Ocean        60834 85988 41%-59%

Salem        1882 2733 41%-59%

Total   179951 188164 49%-51%

Communities of interest: Vineland, Atlantic City, Berkeley

LoBiondo looks safe in his current district but since Obama won his current district 54%-45%, a bipartisan plan would strengthen him. To strengthen LoBiondo, I mostly removed Democratic areas. I removed Democratic parts of Salem County and some Democratic areas in Cumberland County.  I also removed small parts of Atlantic County but Obama barely won them. The main additions in Burlington County are Medford and Southampton which lean Republican. To completely shore up LoBiondo, I added about half of Ocean County and McCain won a 25,000 vote margin in the portion I added. These changes help boost McCain’s performance from 45% to 51%, ensuring LoBiondo safety and his successor’s safety too. Status is Safe Republican.

District 3 John Adler (D) Cherry Hill

Demographics: 20% African American, 10% Hispanic and 64% White

Partisan data: Obama  McCain              

Salem        10235 9774 51%-49%

Atlantic 8926 8596 51%-49%

Gloucester 4065 3646 53%-47%

Cumberland 13199 8149 62%-38%

Camden        26474 16483 62%-38%

Burlington 116496 71652 62%-38%

Mercer        23577 2157 92%-8%

Total        202972 120457 63%-37%

Communities of interest: Cherry Hill, Burlington, Trenton

I definitely strengthened Adler so he will have no problems with reelection. I strengthened him a bit too much though. I removed all of heavily Republican Ocean County while adding territory in South Jersey that leans Democratic as well as more Democratic territory in Burlington County. I also added Trenton which voted 92% for Obama so that brings up the Democratic total. I had to give Adler Trenton because I do not see Christie signing a bill with Trenton in the 7th district. Overall, Adler should have no problem in this district. Corzine won it in his unsuccessful Gubernatorial run in 2009. Status is Safe Democratic.

Central New Jersey

Central New Jersey

District 4 Chris Smith (R) Hamilton

Demographics 8% Hispanic, 83% White

Partisan Data: Obama  McCain

Ocean      49355 74689 40%-60%

Monmouth      85774 106223 45%-55%

Mercer      3406 3099 52%-48%

Total      138535 184011 43%-57%

Communities of interest: Toms River, Lakewood, Freehold

Chris Smith seemed safe already, even with Democratic parts of Mercer and Burlington Counties inside his district. He lives in the Democratic parts of the old district. I removed his home from the district and placed it in the 7th. He would probably not mind moving though as long as his district is safer. I increased McCain’s percentage from 52% to 57% by removing most of the Democratic areas along the Delaware River and adding more Republican areas in Monmouth County. Smith should have absolutely no problem here. Status is Safe Republican.

Northern New Jersey

Northern New Jersey

Northwest New Jersey

Northwest New Jersey

District 5 Scott Garrett (R) Wantage

Demographics: Hispanic 6%, Asian 6%, 85% White

Partisan Data: Obama  McCain

Sussex       28840 44184 40%-60%

Warren       20628 27500 43%-57%

Morris       19274 26364 42%-58%

Passaic       35201 44572 44%-56%

Bergen       60808 76821 44%-56%

Total       164751 219441 43%-57%

Communities of Interest: Newton, Rockaway and Montvale

This district does not go through large changes but the few I made strengthen Garrett. I removed marginal towns in Bergen County such as Bergenfield and Ridgewood. I mostly did this because the 9th district needed room to expand. I added in some Republican townships in Morris County. I also kept Garrett’s home, Wantage in the district. Increasing the McCain percentage here should keep Garrett safe for until he retires. Status is Safe Republican.

District 6 Frank Pallone (D) Long Branch

Demographics: 11% African American, 13% Hispanic, 16% Asian and 58% White

Partisan Data:  Obama   McCain

Monmouth 62963 54210 54%-46%

Middlesex 102139 63016 62%-38%

Total        165102 117226 58%-42%

Communities of Interest: Edison, Asbury Park, New Brunswick

Pallone’s district gets a bit weaker. I removed Plainfield to give more African Americans to the 10th and since I tried to keep town boundries intact, I removed the small Democratic slice of Somerset County. I replaced it with Woodbridge and Edison which lean Democratic even though Christie barely won them. Still, Pallone is entrenched here and since the minority population is growing quickly here (the white population was 65% in 2000,) this district should grow more Democratic. Pallone should not have trouble. Status is Safe Democrat.

District 7 Rush Holt (D) Hopewell vs. Leonard Lance (R) Clinton

Demographics: 9% African American, 8% Hispanic, 13% Asian and 69% White

Partisan Data:  Obama   McCain

Mercer        80943 44967 64%-36%

Middlesex 66727 47797 58%-42%

Hunterdon 22211 28800 44%-56%

Somerset 44197 31149 59%-41%

Burlington 1005 1336 43%-57%

Total       215083 154049 58%-42%

Communities of Interest: Ewing, North Brunswick

This district may at first look like a sure win for Holt because he has represented his district since the 90’s and this district contains most of his old territory. Lance is a freshman but he is a moderate. He also ran a great campaign in 2008, winning against Linda Stender (D) by nine points in a district Obama barely carried. Stender was a good candidate and she almost beat Mike Ferguson (R) who formerly represented the 7th district in 2006. Also, the territory here is less Democratic than it looks with high income independents who swung heavily toward Christie in the Gubernatorial race last year. About the areas in the district, I had to remove Trenton because I think Christie would never sign a plan putting Lance in the same district as Trenton. Still, the district is Democratic with other parts of Mercer County as well as Democratic areas in Middlesex County. Overall, this should be a tough battle but Holt should win. Status is Lean Democratic.

Urban New Jersey

Urban New Jersey

8th District Bill Pascrell (D) Paterson

Demographics: 11% African American, 29% Hispanic, 7% Asian and 53% White

Partisan Data: Obama      McCain

Passaic       78056   27980 74%-26%

Essex 70,000 (+- 1,000)42,000 (+-1,000)62%-38%

Union 37,000 (+-1,000) 35,000 (+-1,000)51%-49%

Bergen       7888  8031         50%-50%

Total 193,000 (+-2,000) 113,000(+-2,000)63%-37%

Communities of Interest: Westfield, West Orange, Paterson, Clifton

I had to split some towns in this district so the vote totals are not exact. Overall, his district gets more Democratic by a few points. I removed all the Republican parts of Passaic County, leaving only Paterson, Clifton, Passaic and a few small Democratic suburbs. Obama won 74% of the vote in the 8th district’s part of Passaic. I added most of western Union County which Obama and McCain split but most of the time, Republicans should win that area. I also added a slice of Bergen County which is also split between Obama and McCain. These changes should not affect Pascrell much because Paterson and neighborhoods in Essex County keep this district strongly Democratic. Status is Safe Democratic.

9th District Steven Rothman (D) Fair Lawn

Demographics: 7% African American, 20% Hispanic, 16% Asian and 56% White

Partisan Data: Obama      McCain

Bergen       154063  100073 61%-39%

Hudson   26,000 (+-1,000)13,000(+-1,000)67%-33%

Total 180,000 (+-1,000)113,000 (+-1,000)62%-38%

Communities of Interest: Jersey City, Englewood, Hackensack, Garfield

Rothman’s district gets a touch more Republican but does not make many changes. I gave the district some northern Bergen County suburbs such as Bergenfield and Tenafly which lean Democratic. The only areas I removed were Fairview and North Bergen which are heavily Democratic. These changes should not affect the composition of the district strongly. Status is Safe Democratic.

10th District Donald Payne (D) Newark

Demographics: 55% African American, 17% Hispanic and 23% White

Partisan Data: 82% Obama, 18% McCain

Communities of Interest: Plainfield, Rahway, Linden, Elizabeth, East Orange, Newark

Since I split most of the towns in the district, I decided to just estimate the partisan data. Also, Payne’s district changes a bit. I did not remove many areas from it but I added Plainfield and the marginal Union County suburbs for a few reasons: Plainfield has an African American majority and since the 10th is New Jersey’s African American majority district, I decided it should be included. Also, the 10th helps shore up the 8th by taking in some marginal suburbs. I am not sure if the New Jersey legislature would go for this but since it would help keep the 10th African American majority, they would go for it. The district still remains heavily Democratic. Status is Safe Democratic.

11th District Rodney Frelinghuysen (R) Harding

Demographics: 11% Hispanic, 9% Asian, 75% White

Partisan Data:  Obama   McCain

Morris        93001 105967 47%-53%

Somerset 35121 38936 47%-53%

Hunterdon 7565 10292 42%-58%

Middlesex 2837 3185 47%-53%

Union        8295 9195 47%-53%

Essex        15347 17252 47%-53%

Total       162166 184827 47%-53%

Communities of Interest: Dover, Morristown

I weakened Frelinghuysen a bit by removing all of Republican Sussex and Warren Counties. I also removed parts of Morris County too. The new areas I put in the district are mostly in Somerset, Union and Essex Counties. The new areas are marginal but Obama overperformed in most of the district so Frelinghuysen should still be very safe. Status is Safe Republican.

12th District Albio Sires (D) West New York

Demographics: 10% African American, 53% Hispanic, 7% Asian, 30% White

Partisan Data: Obama 76% McCain 23%

Communities of Interest: Linden, Elizabeth, Jersey City, Hoboken, Newark

Since I split too many towns in this district, I had to estimate the partisan data. Overall, the district experiences few changes. I added all of North Bergen as well as Fairview in Bergen County. I also added a few neighborhoods in Elizabeth but besides this, I made few changes. Sires’s district gets more Hispanic and he remains safe. Status is Safe Democratic.

Contest Entry: A Mostly Compact 27-1 Redistricting of New York

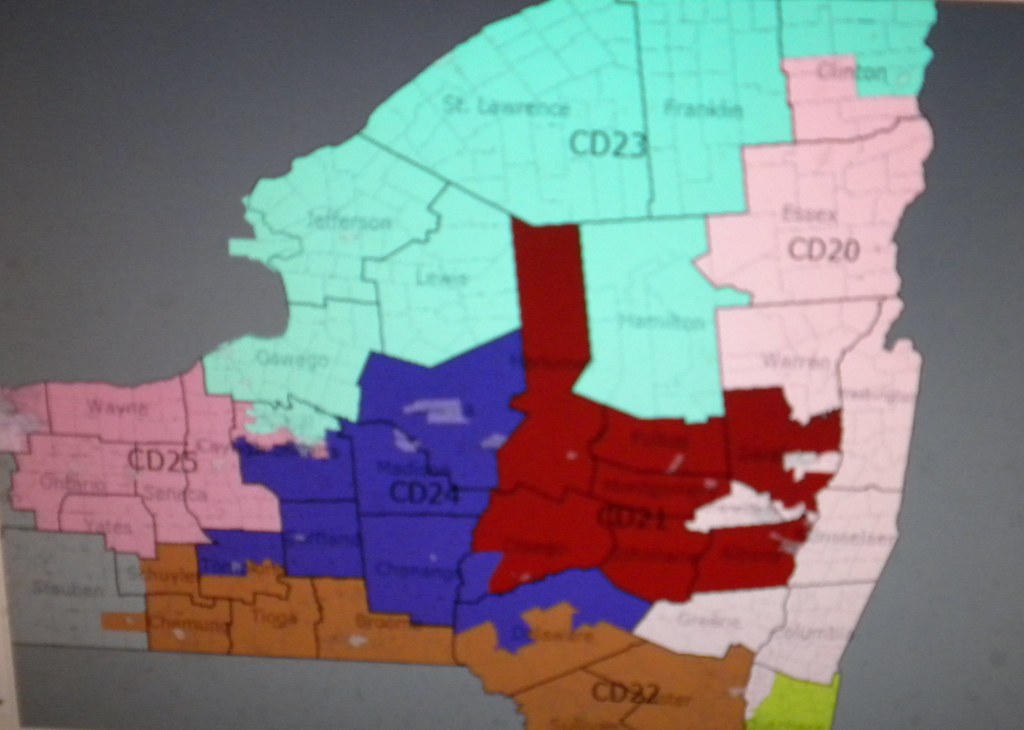
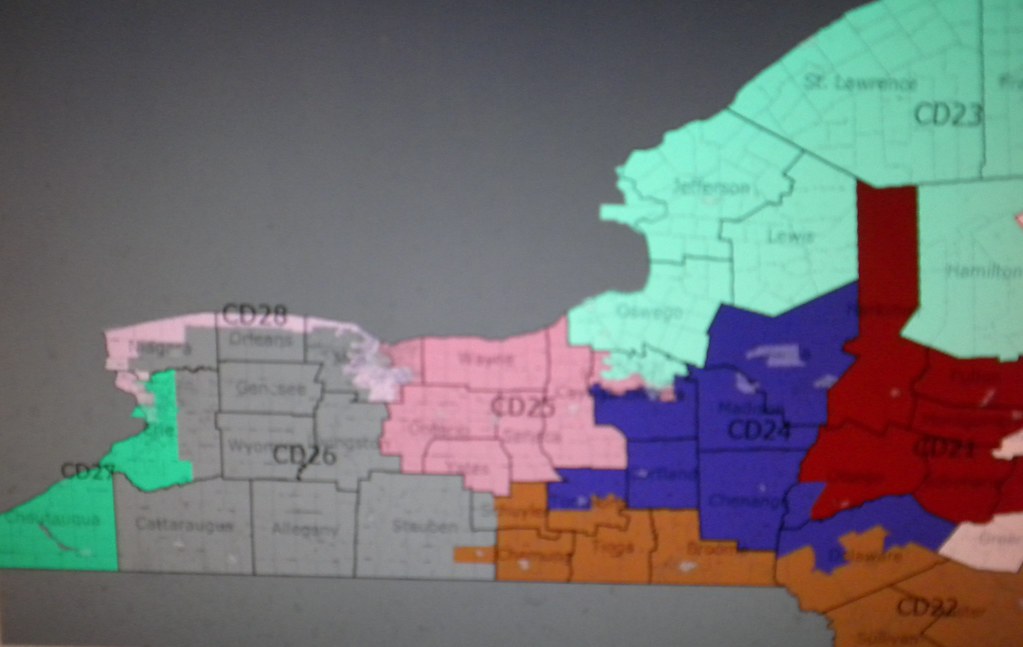
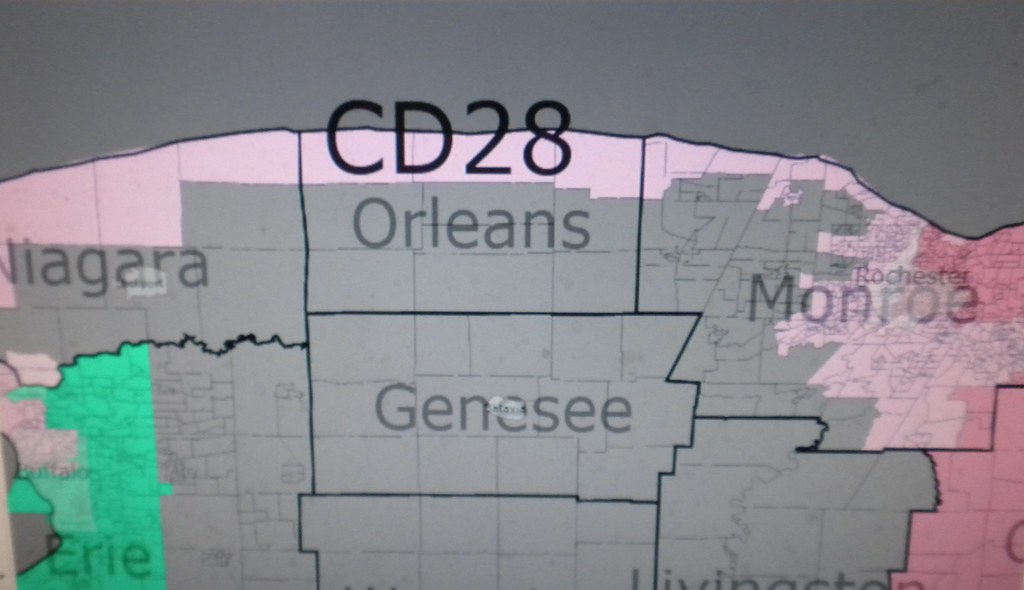
I aimed for a 27-1 district so I could shore up all the Democrats. I thought about going for a 28-0 district but I believe the main priority should be protecting the Democrats in Upstate New York because many of them hold marginal districts. Chris Lee is the only Republican in the Upstate New York Congressional delegation. I strengthened him while I gave Peter King (R) who represents the 3rd Congressional district a very tough time in Long Island. He lives in Seaford which is in eastern Nassau County along the coast. It is possible he could win but it is very unlikely. I also aimed to retain the African American majority of the 6th, 10th and 11th districts and increase the African American population of the 15th district. I also kept the 16th district’s heavy Hispanic majority, and made the 12th and 7th Hispanic majority districts. I also made sure no district (except the 26th which Chris Lee represents) fell below 53% for Obama (only the 2nd district was 53% for Obama.) The 1st, 20th, 22nd, 23rd and 24th were all 54% for Obama, though. The district I eliminated was Freshman Eric Massa’s (D) 29th district which contained some rural areas and part of Monroe County (Rochester.) Massa lived in Corning which is far away from Rochester, McCain won the district and I had to eliminate someone so I chose him. Just for your info, the home of each representative is next to his or her name. Also, current percentages show how well each presidential candidate performed in the current lines of a congressional district. The change shows how better or worse Obama’s performance is in the district I drew compared to the old one. “Important areas” refers to important areas inside the district I drew. Also, I tried to not draw convoluted districts except I did not succeed with the 4th. I did not want to make big changes because in my opinion, realistically, the map if the Democrats control the State Senate should not be too different from the current map but it should still strengthen Democrats. Here are some helpful links:

For maps and information on current Congressional districts: http://en.wikipedia.org/wiki/N…

For election results by county: http://www.uselectionatlas.org…

For demographic data by county: http://quickfacts.census.gov/q…

where you can find locations of certain towns and neighborhoods: http://maps.google.com/

Long Island

Long Island

1st District Tim Bishop (D) Southampton

Vote totals: Obama 162,072 54%, McCain 135,928 45%

Demographics: 6% African American, 11% Hispanic and 79% White    

Current percentages: Obama 52% McCain 48% Change: Obama +5

Population: 701,151

Important areas: Suffolk County, Riverhead, Port Jefferson and Islip. I removed Smithtown from the district which is politically marginal. I added in heavily Democratic neighborhoods in Islip to help strengthen Bishop. These changes are not foolproof protections but he is much safer than he currently is so I expect him to be fine. Status is Safe/Likely Democratic

2nd district Steve Israel (D) Huntington Village

Vote totals: Obama 157,988 53%, McCain 139,528 47%

Demographics: 7% African American, 10% Hispanic and 77% White

Current percentages: Obama 56% McCain 43%

Change: Obama -7

Population:700,773              

Important areas: Suffolk County, Nassau County, Brentwood, part of Huntington, part of Oyster Bay, part of Islip, Smithtown, and Babylon. I weakened Israel a bit by removing Democratic parts of Islip and adding in more of the Republican South Coast, including part of Peter King’s current district. I retained Jewish neighborhoods in Oyster Bay and a few Hispanic neighborhoods in Islip. Peter King does not live in this district and since only a bit of his current district is in the 2nd, I do not see him running here. He may try but since he is running in mostly unfamiliar territory, he should not have the best shot. Israel’s district has the lowest Obama performance (except for the 26th.) Still, he has faced token opposition in recent years winning 67% of the vote in 2008. His strong stance on Israel should keep him strong among Jewish voters. Unless a very strong challenger such as Peter King challenges Israel, he should be fine. Status is Likely Democratic, Lean Democratic if Peter King runs.

3rd District Peter King (R)

Vote totals: Obama 184,548 58%, McCain 134,192 41%

Demographics: 18% African American, 11% Hispanic and 66% White

Current percentages: McCain 52% Obama 47%

Change: Obama +22

Population: 700,433

Important areas: Nassau County, a tiny slice of Queens County, Hempstead, South Oyster Bay and Long Beach. Peter King has no good options with the new map. This district contains large parts of his old district so if I were him, I would probably chose to run here. There are just a few problems for him: his district is now 68% White instead of 86% White, the district has heavily Democratic neighborhoods in Hempstead, Valley Stream and a few precincts in Queens where Obama won 98% of the vote (no, I am not kidding.) McCain won 52% under the current lines and even though King has most of his base here, about half of the district is new territory and the new territory is heavily Democratic. King may put up a strong fight but he is unlikely to make inroads in the district’s new territory so he should lose by a few points. If Andrew Cuomo (D) runs for Governor, he should boost up the Democratic ticket and King will certainly lose. Status is Lean Democratic if Peter King runs, Likely Democratic if he does not.

4th District Carolyn McCarthy (D) Mineola

Vote totals: Obama 170,373 56%, McCain 134,300 43%

Demographics: 8% African American, 10% Hispanic, 11% Asian and 68% White Current percentages: Obama 58% McCain 41% Change: Obama -4

Population:700,400

Important areas: Nassau County, Queens County, Suffolk County, Huntington, Glen Cove, Oyster Bay, Oakland Gardens and Mineola. McCarthy should not be overjoyed with her district but she should be safe. It is a bit convoluted because I had it take marginal parts of Huntington and then I sent the district into Queens to get some Democratic neighborhoods. Most of those neighborhoods were in the 60’s for Obama. McCarthy would have to get used to her new territory but it is Democratic enough to keep her safe. Status is Safe/Likely Democratic

5th District Gary Ackerman (D) Rosalyn Heights vs. Joseph Crowley (D) Elmhurst

Vote totals: Obama 127,658 59%, McCain 85,585 40%

Demographics: 18% Hispanic, 26% Asian and 50% White

Current percentages: Obama 63% McCain 36% Change: Obama -8

Population: 701,084  

Important areas: Queens County, Nassau County, Great Neck, Little Neck, Beechcrest and Rosalyn Heights. The Queens portion of the district used to be very white and working class but now it is one of the most diverse areas in the country. Still, the district is not minority majority yet but in a few years, it will be. Ackerman gains some Republican parts of Nassau County while losing some heavily Hispanic areas in Queens to the 12th district. Still, he is very safe and he has a smaller chance of a minority candidate giving him a strong primary challenge. The only part of Crowley’s district that the 5th has is Crowley’s home Elmhurst so I expect him to run in the current 7th district which has most of his old district. He would probably lose to Ackerman in a primary if he ran here. Status is Safe Democratic.

New York City

New York City and close in suburbs

6th District Gregory Meeks (D) Far Rockaway

Vote totals: Obama 195,708 78%, McCain 52,681 21%

Demographics: 50% African American, 13% Hispanic, 6% Asian and 25% White.

Current percentages: Obama 89% McCain 11%

Change:Obama-21

Population:701,133

Important areas: Queens County, Nassau County, Rockaway, Jamaica, Queens Village and Locust Manor. The old 6th district has many Democrats to spare so I gave the 6th district Republican parts of the Rockaway Peninsula and Nassau County. The district’s numbers are pretty polarized because although Obama crushes McCain at a first glance, there are some precincts on Breezy Point (Rockaway Peninsula) that are 70% for McCain or more that I added here. To be able to take Republican parts of Nassau County while keeping the population African American majority, I had to extend the district across Jamaica Bay to include African American areas in Canarsie. Meeks has his home in this district; he should have absolutely no problem here. Status is Safe Democratic

7th District Vacant

Vote totals: Obama 155,777 84%, McCain 26,639 15%

Demographics: 21% African American, 52% Hispanic, 5% Asian and 19% White

Current percentages: Obama 79% McCain 20% Change: Obama +10

Population:701,275

Important areas: Queens County, Bronx County, Westchester County, Jackson Heights, Westchester Village and Eastchester Bay. Due to New York City’s growing Hispanic population, I realized it needed another Hispanic majority district. I removed College Park and Elmhurst while adding Longwood and other Hispanic neighborhoods in the Bronx. This increased the Hispanic population from 40% to 52%. If Crowley wanted to run, he would probably head here since this contains most of his old district. Since the district has a Hispanic majority, a Hispanic candidate should have a good shot even though Hispanics tend to have lower turnout than other groups of voters so they probably will not make up the majority of the district’s votes. I am expecting a three way race with an African American candidate, Joseph Crowley and a Hispanic candidate. I am not sure if Ruben Espinosa, a conservative Democrat who represents New York’s 32nd Senate district will run here but he may be too conservative for voters who are unfamiliar with him. Then again, there may not be a brawl if the establishment gets behind a candidate. The establishment should not be pleased with Espinosa because he was an advocate for preventing same sex couples from obtaining equal marriage rights. Anyway, no Republican should win here. Status is Safe Democratic.

8th District Vacant

Vote totals: Obama 135,904 66%, McCain 69,115 33%

Demographics: 9% Hispanic, 19%Asian and 65% White

Current percentages: Obama 74% McCain 26%

Change: Obama -15

Population: 700,805

Important areas: Brooklyn, Manhattan, Borough Park, Bay Ridge and Flatiron. Other changes I made included adding Bay Ridge and part of Chinatown while removing Coney Island, Chelsea and the Upper West Side. Besides water contiguity, the Brooklyn Bridge also connects the district. I removed Nadler’s home from the district but since the 8th still contains most of the old district, he will probably run here and win. Something interesting is how polarized certain parts of the district are. Borough Park has voting district BK48 022 where Obama only won 2% of the vote. This is probably because there is an Orthodox Jewish community there and they sometimes vote almost simultaneously for certain candidates. Anyway, the district is too Democratic for the Borough Park precincts to have an effect. Status is Safe Democratic.

9th District Anthony Weiner (D) Forest Hills

Vote totals: Obama 125,869 64%, McCain 69,328 35%

Demographics: 11% African American, 18% Hispanic, 13% Asian and 52% White

Current percentages: Obama 55% McCain 44% Change: Obama +18              

Population: 701,194

Important areas: Queens, Brooklyn, Forest Hills, Brighton Beach and Ozone Park. I increased Obama’s percentage here from 55% to 64% by removing the Rockaway Peninsula and other not heavily Democratic neighborhoods. I also added African American neighborhoods in Flatlands, increasing the African American percentage here from 4% to 11%. Anyway, I do not see a Republican winning with these new changes. Status is Safe Democratic.

10th District Edolphus Towns (D) East New York

Vote totals: Obama 189,570 84%, McCain 34,120 15%

Demographics: 53% African American, 16% Hispanic and 24% White                            

Current percentages: Obama 91% McCain 9% Change: Obama -14

Population: 700,447

Important areas: Brooklyn, East New York, Brownsville and Bedford-Stuyvesant. This district undergoes a few changes by taking some primarily white neighborhoods and losing parts of Canarsie. I exchanged the neighborhoods with the 9th district to make the 9th safer for Weiner. The 10th still is heavily Democratic and complies with the VRA. Status is Safe Democratic.

11th District Yvette Clarke (D) Flatbush

Vote totals: Obama 190,135 88%, McCain 24,313 11%

Demographics: 52% African American, 14% Hispanic, 7% Asian and 24% White.

Current percentages: Obama 91% McCain 9%

Change: Obama -5

Population: 700,427

Important areas: Brooklyn, Flatbush and Crown Heights. The 11th district does not change much either, remaining heavily African American and Democratic even though there a few precincts that voted 90% for McCain here. Status is Safe Democratic.

12th District Nydia Velazquez (D) Williamsburg

Vote totals: Obama 153,958 85%, McCain 26,105 14%

Demographics: 9% African American, 52% Hispanic, 12% Asian and 22% White.

Current percentages: Obama 86% McCain 13%

Change: Obama -2                

Population: 700,906

Important areas: Queens, Brooklyn, Manhattan, Williamsburg, Fresh Pond Junction, and Lower East Side. The district is contiguous with Manhattan not just throughout water but also through a bridge. I shifted the district north to include some Hispanic neighborhoods east of Astoria and while removing some neighborhoods in Brooklyn for population purposes. These changes give this district a Hispanic majority even though they probably do not make up the majority of the voters yet. I assumed this because Hispanics usually have lower turnout levels than other voters’ turnout levels. I barely kept Velazquez’s home in this district by keeping it one voting district away from the 14th but at least she will not have to move. Overall, Velazquez should have no trouble in an election or a primary. Status is Safe Democratic.

13th District Michael McMahon (D) Staten Island

Vote totals: Obama 165,015 62%, McCain 100,172 37%

Demographics: 8% African American, 13% Hispanic, 7% Asian and 70% White

Current percentages: Obama 49% McCain 51% Change: Obama +27

Population:700,828

Important areas: all of Richmond County (Staten Island,) Manhattan, Chelsea, Hell’s Kitchen and the Financial District. In 2008, McMahon was elected into the current 13th district which McCain narrowly won. I made sure McMahon has no trouble here by connecting the district to Manhattan by the Hudson River and the Staten Island Ferry route. Even though about 1/3 of the district is in Manhattan, that portion voted more than 80% for Obama so it makes the district Democratic overall. Staten Island barely voted for McCain. McMahon should win easily. Status is Safe Democratic.

14th District Caroline Maloney (D) Upper East Side vs. Jerrold Nadler (D) Upper West Side

Vote totals: Obama 234,406 80%, McCain 56,462 19%

Demographics: 12% Hispanic, 8% Asian and 73% White

Current percentages: Obama 78% McCain 21% Change: Obama +5  

Population: 700,489

Important areas: Queens, Manhattan, Upper West Side, Upper East Side and Astoria. This district loses some minority majority areas in Queens but is kept contiguous with the Queens portion by the Queensboro Bridge and the East River. I gave the district the Upper West Side with Nadler’s home but since most of his current district is in the 8th, I expect him to move there and run in it. Maloney should be safe from any challenge. Status is Safe Democratic.

15th District Charlie Rangel (D) Harlem

Vote totals: Obama 220,118 92%, McCain 18,510 7%

Demographics: 36% African American, 42% Hispanic and 17% White.

Current percentages: Obama 93% McCain 6% Change: Obama -2                          

Population: 700,237

Important areas: Manhattan, Bronx, Hamilton Heights, Harlem and Woodlawn Heights. I made the district more African American by adding in Woodlawn Heights and removing heavily Hispanic Washington Heights. The Triborough Bridge connects the small slice of Queens. Rangel should retire soon and I wanted to make it easier for an African American to replace him. Hispanics should soon cast more votes in the Democratic primary here but right now, African Americans probably make up the majority. Status is Safe Democratic.

16th District Jose Serrano (D) South Bronx

Vote totals: Obama 157,529 94%, McCain 10,205 5% Demographics: 26% African American, 63% Hispanic and 6% White.

Current percentages: Obama 95% McCain 5%Change: Obama -1

Population: 700,237

Important areas: Bronx, South Bronx, University Heights, Mt. Hope and Yankee Stadium! Serrano’s district shifts west a bit to pick up Washington Heights and a few other primarily Hispanic neighborhoods from the 15th. Besides these adjustments, the district remains mostly the same, heavily Hispanic and Democratic. Status is Safe Democratic.

Westchester

Westchester County and Vicinity

17th District Eliot Engel (D) Riverdale

Vote totals: Obama 169,832 61%, McCain 104,965 38%

Demographics: 24% African American, 12% Hispanic and 58% White.

Current percentages: Obama 73% McCain 26% Change: Obama -24

Population: 700,317

Important areas: Bronx, Westchester County, Rockland County, Orange County, Wakefield, Mt. Vernon, and Yonkers. Engel’s district adds all of Rockland County where Obama won 53% of the vote and it adds parts of Orange County that lean Republican (Orange County in 2008 was not colored orange, Obama won it by a few points.) I had to take out parts of the Bronx for population purposes. Overall, I reduced Obama’s percentage from 73% to 61%. This is still a safe enough district for Engel so he should have no trouble with reelection. Status is Safe Democratic.

18th District Nita Lowey (D) Harrison

Vote totals: Obama 187,681 61%, McCain 116,591 38%

Demographics: 10% African American, 16% Hispanic, 5% Asian and 68% White

Current percentages: Obama 62% McCain 38%

Change: Obama -1

Population: 698,674

Important areas: Westchester County, Yonkers, New Rochelle and White Plains. I removed all of Rockland County, pushed the district to the Putnam County border and removed some Democratic precincts along the river. Lowey’s district is a few points less Democratic but she should have no problem winning reelection. Status is Safe Democratic.

19th District John Hall (D) Dover

Vote totals: Obama 164,634 55%, McCain 134,119 44%

Demographics: 8% African American, 10% Hispanic and 77% White

Current percentages: Obama 51% McCain 48% Change: Obama +8

Population: 700,453

Important areas: Westchester County, Putnam County, Orange County, Dutchess County, Newburgh, Poughkeepsie and Middletown. Hall keeps his home in the district but it shifts north a bit. It loses southern Orange County while picking up Democratic Newburgh and Poughkeepsie. I also extended a finger into southern Westchester County to pick up Democratic areas there. These changes shift the district a few points to the left. Hall could have a tough race with a strong challenge but for now, he looks very safe. Status is Safe/Likely Democratic.

Upstate

East Upstate

East Upstate

Western Upstate

Western Upstate

20th District Scott Murphy (D) Glen Falls

Vote totals: Obama 176,409 54%, McCain 146,305 45%

Demographics: 91% White

Current percentages: Obama 51% McCain 48% Change: Obama +6

Population: 700,742

Important areas: Dutchess County, Columbia County, Renneslar County, Schenectady County, Saratoga County, Washington County, Warren County, Essex County, Clinton County, Schenectady, Troy and Saratoga Springs. Jim Tedisco (R) ran against Scott Murphy for this seat and lost by a few hundred votes. Since Tedisco is from Saratoga County, I removed all the Republicans parts of it. Due to population growth, I needed to move the district north into Clinton County for population purposes but since Clinton County is Democratic, this helps strengthen the district. Adding Schenectady while removing Republican parts of Delaware County helped make this district safer. Murphy is a freshman in Congress so a strong challenge can still unseat him but he is safer now. Status is Likely Democratic.

21st District Paul Tonko (D) Amsterdam

Vote totals: Obama 180,169 55%, McCain 144,547 44%

Demographics: 5% African American, 90% White

Current percentages: Obama 58% McCain 40% Change: Obama -6

Population: 700,462

Important areas: Albany County, Schohane County, Otsego County, Herkimer County, Fulton County, Montgomery County, Saratoga County, Albany. The 21st district grows more Republican by losing Schenectady and Troy. I added Otsego and Herkimer Counties. Otsego is marginal but Herkimer is heavily Republican. These changes drop Obama’s percentage from the high 50’s to 54%. Tonko is also new but since he has heavily Democratic Albany in his district, it should protect him unless he faces a very strong challenge. Status is Safe/Likely Democratic.

22nd District Maurice Hinchey (D) Hurley vs. Eric Massa (D) Corning

Vote totals: Obama 172,318 54%, McCain 142,676 45%

Demographics: 89% White

Current percentages: Obama 59% McCain 39% Change: Obama -11

Population: 698,990

Important areas: Ulster County, Orange County, Sullivan County, Delaware County, Broome County, Tioga County, Tompkins County, Chemung County, Steuban County, Kingston and Binghamton. I weakened Hinchey to protect other Democrats. I removed heavily Democratic Ithaca in Tompkins County while adding some rural territory nearby that leans Republican. Hinchey retains his home and it should be hard for a Republican challenger to unseat him since he is entrenched here. I slipped in Eric Massa’s home in Corning but since I placed almost no other territory here currently in Massa’s district, Hinchey should win a primary against Massa who was elected in 2008. Status is Safe Democratic.

23rd District Bill Owens (D) Plattsburgh

Vote totals: Obama 154,639 54%, McCain 124,322 44%

Demographics: 92% White

Current percentages: Obama 52% McCain 47% Change: Obama +5

Population: 698,458

Important areas: Clinton County, Franklin County, St. Lawrence County, Hamilton County, Jefferson County, Lewis County, Oswego County, Onondaga County, Syracuse and Watertown. Owens is the newest Democrat in Congress due to his upset victory here over Conservative Doug Hoffman in a special election last November. To protect Owens, I removed all of Oneida County which leans Republican while adding about 1/3 of heavily Democratic Syracuse. These changes bolster Obama’s performance by five points and although they do not completely protect Owens, he should be safe enough. Status is Safe/Likely Democratic

24th District Michael Arcuri (D) Utica

Vote totals: Obama 166,172 54%, McCain 134,215 44%

Demographics: 6% African American, 88% White

Current percentages: Obama 51% McCain 48% Change: Obama +7

Population: 698,920

Important areas: Onondaga County, Oneida County, Madison County, Chenango County, Otsego County, Delaware County, Cortland County, Tompkins County, Ithaca, Syracuse and Rome (not in Italy.) Arcuri won only 51%-49% when I thought he would have no trouble winning reelection. He was elected only in 2006 so he needs time to get entrenched. I helped protect Arcuri by removing some rural counties that Obama or McCain barely won. The district used to be primarily rural. I added in Cornell University in heavily Democratic Ithaca and I added in heavily Democratic parts of Syracuse too. These changes make Obama’s margin seven points larger than the current district. If the district did not include Oneida County, Obama’s performance would be higher. Since Arcuri lives in Oneida County, he is pretty popular there so he needed to worry about candidates pilling up margins in the rural counties. Not anymore, Arcuri looks safe here. Status is Safe Democratic.

25th District Dan Maffei (D) Dewitt

Vote totals: Obama 186,077 57%, McCain 136,799 42%

Demographics: 11% African American, 5% Hispanic, and 82% White

Current percentages: Obama 56% McCain 43% Change: Obama +2

Population: 697,859

Important areas: Onondaga County, Cayuga County, Seneca County, Ontario County, Yates County, Wayne County, Monroe County, Rochester and Syracuse. Maffei won this district easily in 2008 so his district did not much strengthening. I removed most of Syracuse to protect the 23rd and 24th districts but I had to extend the 25th through Syracuse to connect to Dewitt, Maffei’s home. I added in the rural counties such as Cayuga, Seneca, Ontario and Yates so other districts would not hold them. Those counties are marginal. Maffei should have no trouble winning under the new lines because I added in most of heavily Democratic Rochester. Maffei should have no complaints. Status is Safe Democratic

Buffalo/Rochester area

Buffalo/Rochester Area

26th District Chris Lee (R) Clarence

Vote totals: Obama 136,910 42%, McCain 183,059 56%

Demographics: 94% White

Current percentages: Obama 46% McCain 52% Change: Obama -8

Population: 698,474

Important areas: Erie County, Cattaraugus County, Niagara County, Genesee County, Wyoming County, Livingston County, Monroe County, Allegany County, Steuban County, Schuyler County, Batavia and Hornell. I wanted to make Lee very safe so he could take away areas that could weaken Democratic incumbents. I removed some Democratic Buffalo suburbs in Erie County while adding in Republican suburbs in Erie County. I removed a few voting districts in Monroe County too. The new territory I added was rural counties along the Pennsylvania border that are currently in the 29th district. These changes make Lee safer and hopefully the only Republican in the New York Congressional delegation. Status is Safe Republican.

27th District Brian Higgins (D) South Buffalo District

Vote totals: Obama 187,563 55%, McCain 145,799 43%

Demographics: 7% African American, 87% White

Current percentages: Obama 54% McCain 44% Change: Obama +2

Population: 698,914

Important areas: Chautauqua County, Erie County, Buffalo and Tonawanda. Higgins seems safe in his district but to strengthen him, I removed Republican precincts in eastern Erie County to put them in the 26th district. I added suburban territory that leans Democratic around Tonawanda. These changes increase Obama’s performance just a bit and protect Higgins who appears to be popular in this district. Status is Safe Democratic.

28th District Louise Slaughter (D) Fairport

Vote totals: Obama 193,491 61%, McCain 119,737 38%

Demographics: 15% African American and 76% White

Current percentages: Obama 69% McCain 30% Change: Obama -16

Population: 698.682

Important areas: Erie County, Niagara County, Orleans County, Monroe County, Buffalo, Niagara Falls and Rochester. To strengthen the 25th and 27th districts, I made the 28th much more Republican. I removed most of Rochester while adding marginal suburban areas currently in the 26th and the 29th districts. Even though Obama’s performance drops by 16 points, this is still the most Democratic district in Upstate New York. Status is Safe Democratic

By what margin will Bob Shamansky win?

View Results

Loading ... Loading ...
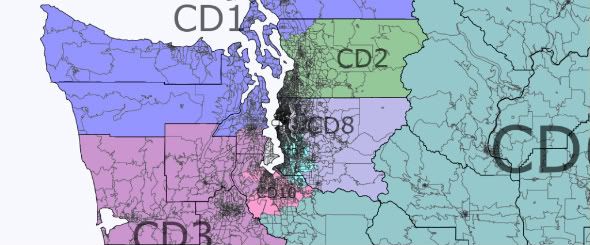
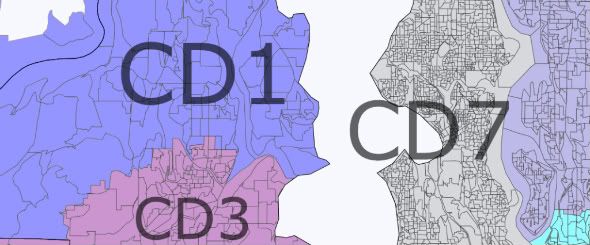
New York Redistricting

This is my first diary since July 24th. This time, I am redistricting New York assuming the Democrats still control the New York State Senate. I drew this map assuming New York will lose one vote. I tried to create a 27-1 Democratic delegation. I decided 28-0 was too risky but I made the 1 Republican district competitive. I know 2010 should be a Republican year but 2012 will not be because Obama should be reelected. He will probably rebound like Bill Clinton did in 1995 and win reelection easily. Back to redistricting: even though the 6th district is no longer Black majority, I made two Hispanic majority districts. I also increased the 5th district’s minority population so a minority candidate will probably elected when Ackerman retires. In this diary, I am going to focus mostly on LI and Upstate Democrats because NYC Democrats are pretty safe. I gerrymandered Downstate New York a bit but in Upstate, I tried not to split counties except for population and contiguity. This is what my rankings mean: Safe means safe for the incumbent party, Likely means currently safe but possibly competitive, Lean means competitive but not a nail biter, Toss Up means a nail biter. Here are the maps.

New York Redistricting Long Island

New York City

Westchester County Area

Hudson Valley

Northern New York

Buffalo Rochester Area

District 1 Tim Bishop (D) (Dark Blue)

Even though Bishop has won easily recently, he could eventually face a real challenge. That is why I sent a finger to take in some heavily Hispanic areas. That should help protect him. Besides that, his district does not change much. Obama probably won 53% of the vote here. Racial stats are 5% Black, 13% Hispanic and 77% White. Status is Likely Democrat.

District 2 Steve Israel (D) (Green)

I weakened Israel a bit by adding the white northern and southern parts of Suffolk County. Unless he faces a tough challenger, he should win. Obama probably won 53% of the vote here. Racial stats are 7% Black, 13% Hispanic and 73% White. Status is Likely Democrat.

District 3 Peter King (R) (Purple on Long Island)

With the exclusion of white areas in northern Nassau County, the inclusion of heavily Democratic Hempstead and putting 8% of the district in Queens, this district appears to be unfavorable territory for King. Even though I include King’s base, the Democratic areas I included should offset margins from his base. I wonder if King will agree with me and run in the 2nd district instead of retiring. I bet Israel can hold off King. I know that I kept most of King’s base here but since I raised the minority population alot, King should still be in jeopardy. I am not too familiar with local candidates in Nassau County so if anyone can tell me about some, that would be great. I think Obama won 55%-56% of the vote here. Racial stats are 19% Black, 16% Hispanic and 60% White (down from 86% White in the old district.) Status is Likely Democrat if King retires, Lean Democrat if he runs.

.

District 4 Carolyn McCarthy (D) (Red)

I changed her district around a lot so King would think that her district is too Democratic to win. With the inclusion of some Queens neighborhoods, I am not too worried about McCarthy’s chances. Obama probably won 56%-58% of the vote here. Racial stats are 7% African American, 12% Hispanic, 11% Asian and 66% White. Status is Likely Democrat if King runs, Safe Democrat if he does not run.

District 5 Gary “Caroline Kennedy is no more qualified to be president than Sarah Palin” Ackerman (D) (Yellow)

Reducing the white population from 44% to 37% was partly motivated by my personal opinions and that minority groups will try to get more minorities elected to Congress. I had to remove white areas, put them in the 9th and snake the district closer to Manhattan. Unless Ackerman faces a strong challenge, he should keep his seat because whites are a plurality. To protect other districts such as the 7th and the 12th, I could not increase his minority population much more. Besides the Kennedy/ Palin issue, this guy is pretty Conservative. He submitted H.Con.Res.362; a bill which is basically declares war on Iran. Racial stats are 25% Hispanic, 30% Asian and 37% White. Status is Safe Democrat.

District 6 Gregory Meeks (D) (Teal)

Meeks’s district is no longer Black majority but they still make up the majority of the primary voters. Minority groups might sue but Charlie Rangel whose district is 30% Black seems pretty content with his district. Blacks are the definite plurality so Meeks has no worries. I sent his district into LI to weaken Peter King. Racial stats are 46% Black, 18% Hispanic, 12% Asian and 18% White. Status is Safe Democrat.

District 7 Joseph Crowley (D) (Gray)

Personally, I have no problem with Crowley but his district was the best suited to make Hispanic majority. Even though they do not make up the majority of the voters, this district will probably elect a Hispanic when he retires. Racial stats are 22% Black, 50% Hispanic, 8% Asian and 18% White. Status is Safe Democrat.

District 8 Jerrold Nadler (D) (Purple)

Nadler does not actually live in this district. He lives in the Upper West side but he will probably run here because it contains most of his old district. The Brooklyn parts of the district lean Democratic but the Manhattan part of this district raises its Democratic percentage. Racial stats are 9% Hispanic, 21% Asian and 65% White. Status is Safe Democrat.

District 9 Anthony Weiner (D) (Bright Blue along Jamaica Bay)

His district looks more convoluted now. It still stays the same politically: competitive at a national level but heavily Democratic at a local level. Racial stats are 5% Black, 15% Hispanic, 15% Asian and 62% White. Status is Safe Democrat.

District 10 Edolphus Towns (D) (Fuchsia)

The African American population drops but not nearly enough to alter the voting in this district. Racial stats are 53% Black, 21% Hispanic and 21% White. Status is Safe Democrat.

District 11 Yvette Clarke (D) Light Green

Not much change here either. Racial stats are 57% Black, 11% Hispanic, 5% Asian and 23% White. Status is Safe Democrat.

District 12 Nydia Velazquez (D) (Light Blue)

Velazquez seems safe but I made this district Hispanic majority so a Hispanic has an easier time getting elected when she retires. Racial stats are 8% Black, 50% Hispanic, 18% Asian and 21% White. Status is Safe Democrat

District 13 Michael McMahon (D) (Tan)

Since he was elected in 2008, I made his district solidly Democratic while keeping Staten Island within one district. With 30% of the district in Manhattan, McMahon’s only problem should be a very strong moderate Republican running here. Obama probably won 56% of the vote here. Racial stats are 8% Black, 14% Hispanic, 7% Asian and 68% White. Status is Likely Democrat depending on the challengers.

District 14 Carolyn Maloney (D) (Dirty Green)

She loses some Hispanic precincts to the 12th district and her district extends to the Hudson River. It is still heavily Democratic. Racial stats are 10% Hispanic, 11% Asian and 74% White. Status is Safe Democrat.

District 15 Charlie Rangel (D) (Orange)

It extends further south into Manhattan and into Riverdale. Minorities are still the overwhelming majority here. The Chairman of the Ways and Means Committee should be happy with this new district. I reduced the Hispanic population from 48% to 44% to strengthen Hispanic representation in the 7th and 16th districts. Even though the Hispanic turnout is not very high, there should be a close contest between a Black and a Hispanic when Rangel retires. The reason is that the Hispanic population will keep growing. Racial stats are 30% Black, 44% Hispanic and 20% White. Status is Safe Democrat.

District 16 Jose Serrano (D) (Light Green)

The district gets whiter and less Hispanic but Serrano should be safe. Racial stats are 27% Black, 58% Hispanic and 9% White. Status is Safe Democrat.

District 17 Eliot Engel (D) (Purple above New York City)

Due to population growth, I had to remove parts of Bronx and add in parts of Orange County. Heavily Democratic neighborhoods in the Bronx and Yonkers should keep this district in the Democratic column. Obama probably won 60% of the vote here. Racial stats are 22% Black, 15% Hispanic, and 55% White. Status is Safe Democrat.

District 18 Nita Lowey (D) (Yellow in Westchester County)

This district is now completely in Westchester County, extending all the way to the Putnam County border. Obama probably won 60% of the vote here. Racial stats are 8% Black, 16% Hispanic, 6% Asian and 67% White. Status is Safe Democrat.

District 19 John Hall (D) (Light Green)

Hall seems safe in his current district because he won 58% of the vote there in 2008 even though he was elected in 2006. I solidified his hold by extending his district into some heavily Democratic precincts in Westchester County. I also kept in the cities in Orange County while removing more rural areas. These changes should keep Hall safe. Obama probably won 55%-57% of the vote here. Racial stats are 10% Black, 16% Hispanic and 68% White. Status is Safe Democrat or Likely Democrat depending on the challengers.

District 20 Scott Murphy (D) (Light Pink along eastern New York border)

Murphy was elected to Congress against Republican State Assembly Minority Leader Jim Tedisco by a hair. Democrats will probably remove Tedisco’s home in Saratoga County and send the district up to the Canadian border to take in some Democratic counties. Here are the vote totals for the district except for the chunks of Dutchess and Otsego Counties: Barack Obama 159,784 and John McCain 143,853. Obama won about 52% of the vote in this district including the Dutchess and Otsego County chunks. Obama’s percentage rose by one point but with Tedisco’s base removed and Murphy’s home base in the district, Murphy appears safe. Racial stats are 91% White. Status is Likely Democrat.

District 21 Paul Tonko (D) (Mahogany Brown)

To protect the 20th and 22nd district, I removed Democratic Schenectady and Troy while adding some marginal rural counties. The voting totals for this district except for Chenango County are Obama 182,927 and McCain 137,887. It should be about two hundred votes less for Obama and McCain because the 20th district contains 900 people in Otsego County. Obama won about 56%-57% of the vote in the district. Racial stats are 5% Black and 86% White. Status is Safe Democrat.

District 22 Maurice Hinchey (D)vs. Eric Massa (D) (Dirt Brown)

I made a few changes by removing Cornell University and adding Schenectady. Except for Broome and Steuben Counties, the vote totals for this district are Obama 154,312 and McCain 127,453. Hinchey is still safe. Massa is a freshman Democrat so he may run in the 25th district. Obama probably won 55% of the vote overall. Racial stats are 5% Black, 5% Hispanic and 85% White. Status is Safe Democrat.

District 23 Michael Arcuri (D) (Light Turquoise)

I eliminated Republican John McHugh’s vacant seat assuming a Republican wins it. Arcuri loses most of his old 24th district but keeps Oneida County. The numbers for the district excluding Onondaga County are: Barack Obama, 120,726 votes and John McCain with 116,679 votes. Yes, I know it is close but Onondaga has heavily Democratic and Arcuri splits the city with the 24th district. Obama only wins about 52% of the vote here but Arcuri will probably win his Oneida County home base. His Republican challenger in 2008 Richard Hanna gave him a close race but I removed his home from the district. Racial stats are 87% White. Status is Likely Democrat but could change to Lean in a Republican year.

District 24 Dan Maffei (D) (Purple in Upstate)

I move his district around a bit but with heavily Democratic areas in Broome and Onondaga Counties, Maffei should have no worries. Obama probably won 56% of the vote here. Racial stats are 6% Black and 86% White. Status is Safe Democrat.

District 25 Vacant (Pink but NOT the district in Rochester)

Except for Tompkins County (Cornell University,) this district is mostly Republican. Since Maffei has all the Democrats he needs, Cornell has to go somewhere and I wanted to split as few counties as possible. Excluding split counties (Steuben and Wyoming) Obama has 127,859 votes to McCain’s 127,339 votes. Yep, equally divided between the parties but McCain is the overall winner. Steuben and Wyoming Counties are heavily Republican so they would make McCain carry the district. Chris Lee, the Republican Congressman from the 26th does not live here but he may run here because his home is in the Democratic 27th. 2012 should be an Obama year so Tompkins County should have high turnout which could propel a Democrat into office. Lee seems to be a good campaigner so he would be the frontrunner. Eric Massa may run here even though the district tilts Republican. Racial stats are 91% White. Status is Lean Republican.

District 26 Brian Higgins (D) vs. Chris Lee (R) (Gray)

I put this district entirely in Erie County and increased the minority population. These changes strengthen Obama’s performance. Higgins’s only problem is Chris Lee who would probably run in the more Republican 25th. Higgins has won easily in 2006 and 2008 so he should be safe. Obama probably won 56% of the vote here. Racial stats are 9% Black and 82% White. Status is Safe Democrat if Lee does not run, Likely Democrat if Lee runs.

District 27 Louise Slaughter (D) (Light Green)

It gets less Democratic but with the inclusion of Rochester and Buffalo central cities, this district remains Democratic. Obama probably won 58% of the vote here. Racial stats are 17% Black and 74% White. Status is Safe Democrat.

District 28 Vacant (Pink District in Rochester)

I tinkered with the district a bit by including more of Monroe County (Rochester) and splitting Rochester with the 27th. Republican Wyoming, Genesee and Wayne Counties should not be enough to offset Democratic margins. Eric Massa is the current representative of the 29th. He does not live here but since it contains part of his current district and it is Democratic, he might take a run at it. A Democrat should win it anyway. Obama probably won 55% of the vote here. Status is Safe Democrat.

By what margin will Bob Shamansky win?

View Results

Loading ... Loading ...
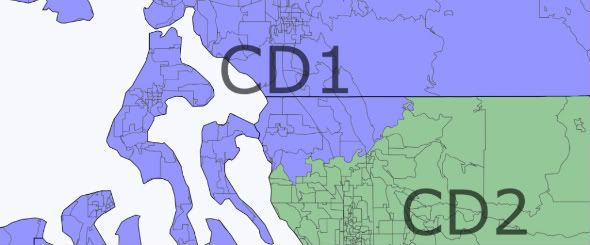
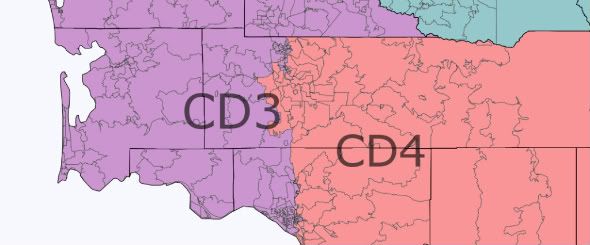
Pennsylvania Democratic Gerrymander

Here is another Democratic gerrymander, this time in Pennsylvania. I am not sure if we can pick up the entire legislature and retain the governorship. If we did, they would probably try to protect new Democrats instead of heading for an all out gerrymander. In my opinion, my map is not too realistic but just in case the Democrats have total control…. This map protects new Democrats while eliminating one Republican seat and endangering the incumbents of two others. I eliminated Charlie Dent’s seat assuming he survives 2010.I am aiming for a 14-4 Democratic delegation as a revenge for the planned 13-6 Republican delegation. My only worry for the Democrats is the 11th district with Paul Kanjorski but even there he should be safe. Here are the maps.

East Pennsylvania

East Pennsylvania

West Pennsylvania

West Pennsylvania

Philadelphia Area

Philadelphia Area

Pittsburgh Area

Pittsburgh Area

District 1 Robert Brady (D) Dark Blue

Robert Brady’s district was safe with the old map and will remain safe this time, even though his district is less safe. I removed some African American areas in western Philadelphia and Delaware County. I added some white parts of Delaware County but they should not affect the voting habits of this district much. Obama probably won 73% of the vote here. Racial stats are 19% African American, 18% Hispanic, 6% Asian and 53% White. Status is Safe Democrat.

District 2 Chaka Fattah (D) Dark Green

For population purposes, I had to send this district up into some white parts of Montgomery County but that should not alter the voting of this district. It stays mostly the same. Obama probably won 85% of the vote here. Racial stats are 58% African American and 32% White. Status is Safe Democrat.

District 3 Kathy Dahlkemper (D) Dark Purple

I was worried about her because she is a freshman. To protect her, I removed all of heavily Republican Butler County and substituted it with some marginal territory along the border. I extended it into the middle of the state to pick up Elk County which Obama barely won. I probably raised Obama’s performance to 53%. She should be safe without a strong challenge. Racial stats are 92% White. Status is Likely Democrat.

District 4 Jason Altmire (D) vs. Tim Murphy (R) Red

To strengthen Altmire, I removed all of Butler County and added some of marginal Washington County. I slipped in some precincts in Pittsburgh as well. He appeared safe in 2008 and he should be even safer. Murphy will probably run in the heavily Republican 17th district so Altmire should not worry. McCain probably won 50% of the vote here. Racial stats are 5% African American and 91% White. Status is Likely Democrat.

District 5 G.T Thompson (R) Yellow

I made this district more Republican to strengthen Democrats in the 3rd and 10th districts. This district basically goes further east, loses Penn State and stays heavily Republican. McCain probably won 63% of the vote here. Racial stats are 95% White, the whitest district in Pennsylvania. Status is Safe Republican.

District 6 Open (Gerleach) (R) Teal

Trust me; this district is not electing a Republican anytime soon. With Gerleach out, this new district would oust any Republican who might have won in 2010. That will probably not be necessary because the Democrats have some good candidates here. The changes I made were removing most of Chester County while giving the district more of Montgomery County. For good measure, 9% of the district is in Philadelphia. The part it has is 75% African American. I see almost no way for a Republican to win here. Obama probably won 64% of the vote here. Racial stats are 13% African American and 78% White. Status is Safe Democrat.

District 7 Open Joe Sestak (D) Gray

I’m a bit worried about this district because I had to extend it all the way out into Republican areas in Lancaster County. I definitely offset Republican margins from Lancaster by putting in heavily African American parts of Philadelphia in this district. Since Chester County is trending Democratic, this district should stay with the Democrats. Obama probably won 57% of the vote here. Racial stats are 14% African American and 77% White. Status is Safe/Likely Democrat.

District 8 Patrick Murphy (D) Light Purple

All I did here was help shore up Murphy by putting in more of Philadelphia which is now 22% of the district’s population. I also removed part of northern Bucks County. Murphy should be fine now. Obama probably won 57% of the vote here. Racial stats are 86% White. Status is Safe Democrat.

District 9 Bill Shuster (R) Bright Blue

I kept the district pretty much the way it is. All I did was move it east so that it is only a few miles away from Harrisburg. I took in Snyder and Union Counties to help strengthen Chris Carney. Anyway, Shuster is safe in the most Republican district in Pennsylvania. McCain probably won 65% of the vote here. Racial stats are 94% White. Status is Safe Republican.

District 10 Chris Carney (D) Pink

If Chris Carney does not represent this district, he probably lost in a primary, retired or the Republicans found the strongest candidate possible. I took out all the heavily Republican western counties and snaked the district into Northampton County (Bethlehem) and Monroe County which voted for Bush but McCain lost it by 17 points. The rural counties to the north lean Republican but they only gave McCain a combined 6,000 vote margin. The only worry I have is that Dent will run but the Democratic margins from Lackawanna, Luzerne and Monroe Counties should offset Dent’s margins from his old district. With the inclusion of most of Lackawanna County are more of Luzerne, Carney is safe. Obama probably won 55% of the vote here. Racial stats are 87% White and 5% Hispanic. Status is Safe Democrat, Likely Democrat if Dent runs.

District 11 Paul Kanjorski (D) Light Green

I am a bit worried about Kanjorski. I had to shore up other Democrats so he lost a few Democratic areas. I tried to help him by sending his district into Lehigh County (Allentown) which Obama won by 15 points. Republican Charlie Dent who represents the 15th district in Allentown may want to run here. Kanjorski had a tight race in 2008 but if he loses, a strong Democrat will probably beat the Republican who won it. Obama probably won 56% of the vote here. Racial stats are 84% White and 9% Hispanic. Status is Lean Democrat.

District 12 John Murtha (D) Indigo

Due to calling his constituents “racists,” Murtha had a ‘tough’ race in 2008 but won by 16 points. The Republicans probably will challenge him again. I’m not the biggest fan of John Murtha myself but we need as many Democrats as possible and a safe district when he retires. To shore him up, I removed all of Armstrong County and part of Westmoreland County. I added in a slice of Alleghany County, all of marginal Fayette County and Penn State. Murtha should be happy. Obama probably won 52% of the vote here. Racial stats are 92% White. Status is Safe Democrat.

District 13 Allyson Schwartz (D) Tan

I had to change Schwartz’s district quite a bit. First, I took out much of Philadelphia and replaced it with part of Bucks and Northumberland Counties. Since those areas both voted Democratic, Schwartz should be safe. She should worry about a primary challenge from the Bethlehem area but her Philadelphia base should probably keep her in Congress. Obama probably won 58-59% of the vote here. Racial stats are 7% African American, 6% Hispanic and 80% White. Status is Safe Democrat.

District 14 Mike Doyle (D) Algae Green

To help protect Altmire, I had to remove the western part of Pittsburgh from this district and substitute it with more Conservative suburbs to the north and south. They should not be nearly enough to endanger Doyle, he appears safe. Obama probably won 65% of the vote here. Racial stats are 19% African American and 74% White. Status is Safe Democrat.

District 15 Tim Holden (D) Orange

Even though Holden seems pretty safe (he won by 28 points in 2008,) I figured that the Republicans would eventually field a strong candidate against him. To help Holden, I added part of Allentown and removed part of Republican Lebanon County. Holden should have no problem at all now that his district is more Democratic. If Charlie Dent ran here, he would probably lose. Obama probably won 51%-52% of the vote here. Racial stats are 7% African American and 5% Hispanic. Status is Safe Democrat.

District 16 Joe Pitts (R) Light green (in Lancaster County)

I am not completely sure if we can knock off Pitts but we definitely have a good shot at it. I removed some of the rural areas in Lancaster County making the district more centered on the city Lancaster. Even though I included part of Republican Lebanon County, I added more of Democratic Reading. The final blow to Pitts is that even though he loses part of Democratic leaning Chester County, he gets heavily Democratic areas in Delaware County and even a couple of precincts in Philadelphia. This should attract some Delaware County Democrats to run. It should be a tight race because Pitts is pretty entrenched yet his margins are dropping. Obama probably won 52% of the vote here. Racial stats are 9% African American, 14% Hispanic and 73% White. Status is Toss Up.

District 17 No Incumbent (R) Dark Purple

If I were Tim Murphy, I would move to this district and run here. It contains part of his old district and takes in the heavily Republican areas of Butler and Armstrong Counties. Other Republicans will probably aim for this seat but Murphy should probably beat them. McCain probably won 61% of the vote here. Racial stats are 95% White. Status is Safe Republican.

District 18 Todd Platts (R) Yellow (on the southern border)

This district stays basically the same. All I changed was that I shrank the district and added some rural areas in Lancaster. Platts is fine. McCain probably won 59% of the vote here. Racial stats are 89% White. Status is Safe Republican.

By what margin will Bob Shamansky win?

View Results

Loading ... Loading ...
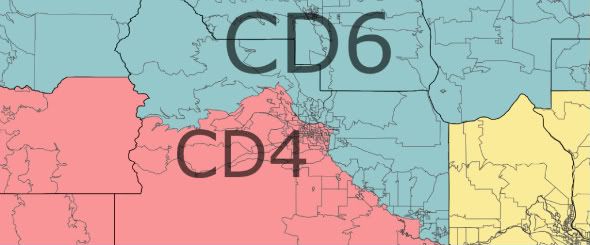
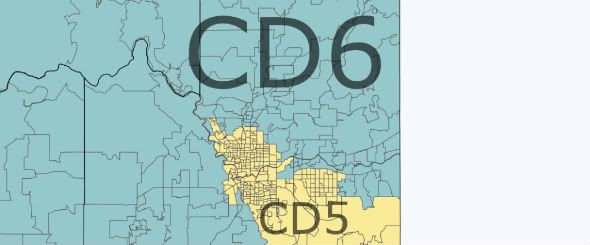
South Carolina Redistricting with Republicans in Control

I finally decided to create a map that is realistic. Since Republicans seem to be in control of South Carolina, I think they will aim for a map like this one. It is 5-2 Republican even though some of the Republicans should have shaky holds on their districts. I decided to think like a Republican would to draw this map. My main objectives were to strengthen Republicans Henry Brown and Joe Wilson while creating a new Republican district. I also strengthened John Spratt because it is almost impossible to weaken him enough to beat him while protecting the other Republicans. Anyway, Spratt is heavily entrenched. Also, I want to say thanks to Dave of Dave’s Redistricting App for enhancing the feature. Now here are the maps.

South South Carolina

Southern South Carolina

Up Country

Up Country

Eastern South Carolina

Eastern South Carolina

Charleston Area

Charleston Area

District 1 Henry Brown (R) Blue

The Republicans biggest worry should be that Brown has not been strengthened enough by redistricting. Yes, he does have most of Charleston County but the parts he has are mostly Republican. I did not alter the old district boundaries there much. Also, he has Republican Horry County to offset Democratic margins. I am not sure if I strengthened Brown enough. McCain probably won 55%-57% of the vote here. The racial stats are 17% African American and 75% White. Status is Likely Republican.

District 2 Joe Wilson (R) Green

Wilson also had a surprisingly competitive race even though he won by 10 points. I helped shore him up and reduced the African American percentage of the population by three points. I removed most of the Democratic rural counties and the parts I included were only to connect the coastline to Aiken and Lexington Counties. I strengthened Wilson even more by putting in Republican parts of Berkeley and Dorchester Counties. McCain probably won 56% of the vote here. Racial stats are 23% African American, 5% Hispanic and 68% White. Status is Likely Republican if Democrats want to challenge this district.

District 3 Gresham Barrett (R) Purple

There is not much difference here. Barrett is pretty safe with heavy Republican margins from Oconee and Pickens Counties. Even with McCormick County which leans Democratic, Barrett has no worries. I even reduced the African American population by two points. McCain probably won 64%-65% of the vote here. Racial stats are 18% African American and 76% White. Status is Safe Republican.

District 4 Bob Inglis (R) Red

I did not alter this district much either. Inglis is pretty safe without any worries. The only changes I made were removing Union County and part of Spartanburg County, mostly for population purposes. McCain still probably won about 60% of the vote here. Racial stats are 18% African American, 6% Hispanic and 71% White. Status is Safe Republican.

District 5 No Incumbent (R) Yellow

This is the new district I created for the Republicans. It basically contains Republican areas in the Up Country, Conservative Lexington County and some white parts of Richland County. I slipped in part of Chester County which Obama barely carried but this should still be Republican. I do not know who the new Republican congressman might be here. I found the names Jeff Duncan and Mac Toole, Republican members of the South Carolina State House whose districts contain part of the 5th. I have no idea if they are potential candidates or not. It would be great if someone who knows South Carolina better could elaborate on it. McCain probably won 62% of the vote here. Racial stats are 21% African American and 71% White. Status is Safe Republican.

District 6 James Clyburn (D) Teal

Since Clyburn is pretty safe, I left him alone pretty much. All I did was remove some northeastern precincts to strengthen John Spratt. All I can really say about this district is that it is still African American majority and Republicans have no shot at winning it. Obama probably won 67% of the vote here. Racial stats are 57% African American and 37% White. Status is Safe Democrat.

District 7 John Spratt (D) Gray

Since the Republicans would be pushing all the Republican areas into other districts, they had to leave behind some Democratic areas and many of them went here. Spratt is strengthened by the removal of most of York County and the inclusion of some African American precincts from the old 6th district. This increases the African American population from 32% to 39%. The changes do not matter much because Spratt is pretty safe. They do help elect a Democrat when he retires. Obama probably won 53% of the vote here. Racial stats are 39% African American and 56% White. Status is Safe Democrat.

By what margin will Bob Shamansky win?

View Results

Loading ... Loading ...