Virginia fair maps, Congress, State Senate and State House

With all the talk by Virginia Gov Bob McDonnell about fair redistricting, I thought it would be interesting to make a map that is actually fair. However, instead of just doing a congressional map, I did a State House and State Senate map as well. Do to the fact that it is 150 districts, I will not be giving information on each like i usually do. Instead, i just did a count and classified each district. Any district with less than 45% Obama is Safe R, 45-49.9 is Likely R, 50-53.9 is Lean R, 54-56 is Toss-Up, 56.1-59.9 is Lean D, 60-64.9 is Likely D, 65 and up is Safe D.

First up, the plan for the Congressional seats.


3 Safe R, 3 Likely R, 1 Toss Up, 2 Lean D, 2 Safe D.

That would be 3 Probably R, 2 Probably D, and 3 Competitive seats.

State Senate Plan


15 Safe R, 3 Likely R, 5 Lean R, 4 Toss-Ups, 2 Lean D, 7 Likely D, 4 Safe D.

That would be 18 Probably Republican, 11 Probably Democrat, and 11 Competitive.

State House


31 Safe R, 16 Likely R, 8 Lean R, 9 Toss-Ups, 10 Lean D, 12 Likely D, 14 Safe D.

47 Probably Republican, 26 Probably D, 27 Competitive.

My initial reaction was one of surprise, as I thought the seat count would be more even. But as I thought about it, Virginia was closer than the nation as a whole, so if we use the nation as a whole as the way to determine how safe a district is, we of course get this result. If you assume 08 is closer to the truth, dems would win almost all of the “competitive” districts. If we assume it is more like 2010, than those would go to republicans. If you want more info on any districts or VRA or any of that good stuff, lemme know.

Virginia State Senate Map

As has been mentioned repeatedly here on SSP, Virginia redistricting will apparently be done through a deal where in exchange for an incumbent protection map for an 8-3 in-favor-of-Republicans Congressional delegation and allowing the GOP-led House of Delegates (HoD) to draw its own map, the Democratic State Senate will get to draw its own map to protect its slight 22-18 advantage. While the circumstances of this deal may change if the Department of Justice does indeed force Virginia to have a second minority-majority district (read: African-American) in the southeast part of the state, for the time being this deal is the basis for redistricting.

Due to the off-year nature of elections in Virginia, it is more difficult to predict turnout and momentum, particularly with the 2011 election coming up in November affecting all 40 Senate seats and the 100 seats in the HoD. While the 2009 election had the governor’s race at the top of the ticket, it did not impact the State Senate because its seats are elected in non-gubernatorial years. Considering the disastrous performance of the Democratic candidates on top of the ticket which contributed to the loss of five Democratic seats in the HoD, we can be thankful that this is the case. Otherwise, the GOP would likely have taken control of the State Senate in addition to the governorship and thus controlled the entire redistricting process.

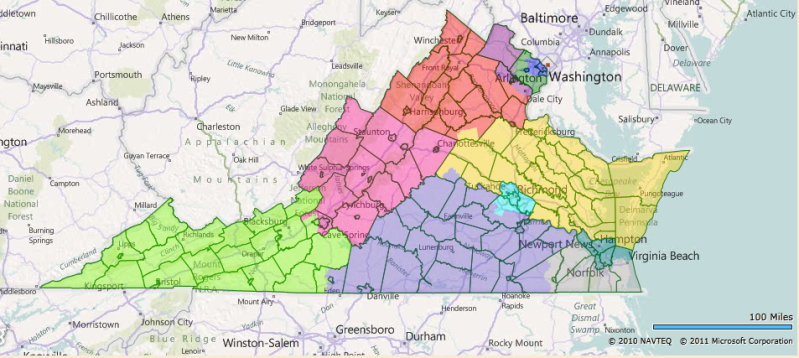
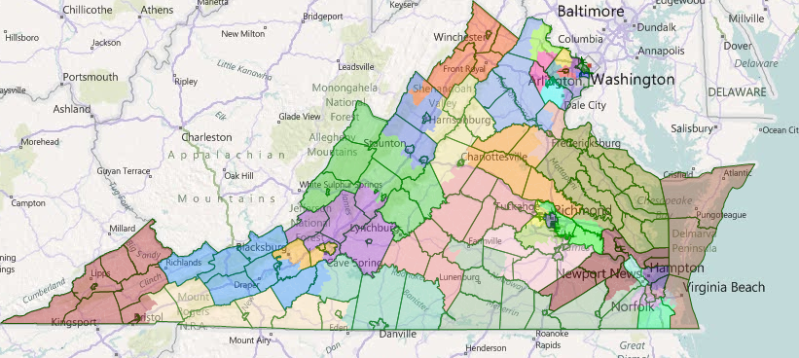
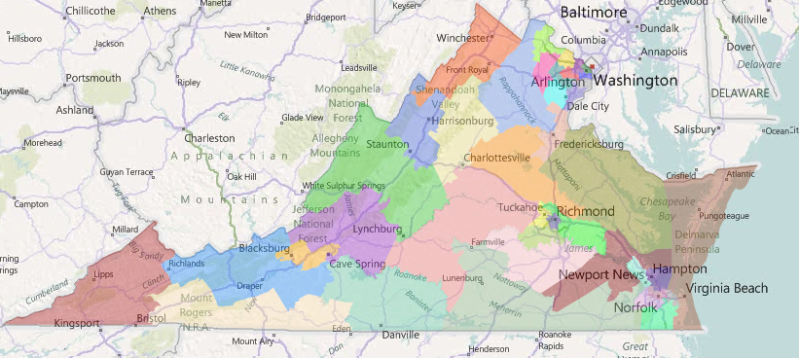
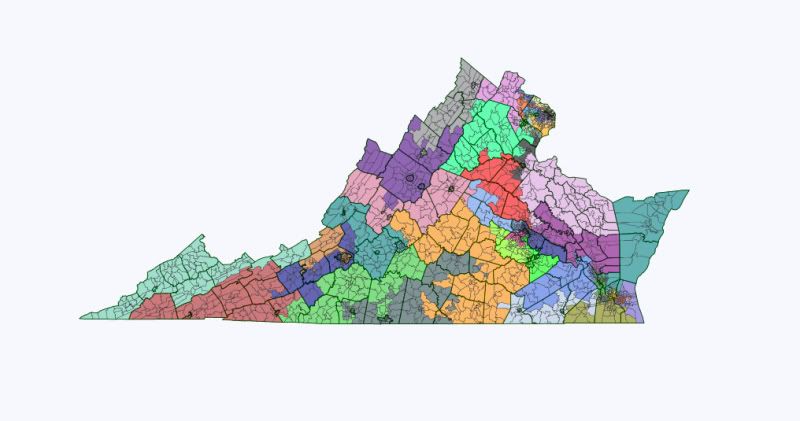
With all of this in mind, I have been formulating a State Senate map that both protects the Democratic majority and gives it a chance to increase its lead given the right circumstances. In doing so, I’ve attempted to not draw GOP incumbents out of their districts because of how this would likely engender resentment and could upset the redistricting deal. I’ve also tried to draw realistic districts though my map is certainly a gerrymander – however, based on the previous State Senate map, I don’t think it’s any worse in terms of compactness or ignoring communities of common interest. Additionally, I preserved all black majority-minority districts in the Tidewater and around Richmond, as well as the same number of white plurality districts in Northern Virginia (NoVA). In reviewing the new districts I drew, I will refer to their old Dem-GOP and Obama-McCain numbers based on an attempted sketch that I made of the current districts on Dave’s Redistricting App. I have also kept every district’s population total inside of 1,000 from the ideal number. The final result of my efforts is this map, which creates a good chance for a 24-16 Democratic edge after 2011 (if everything goes according to plan):

Photobucket

Unfortunately, I couldn’t manage to draw my home town of Harrisonburg into a Democratic district, but you can’t win them all. Anyway, details on my map are after the jump.

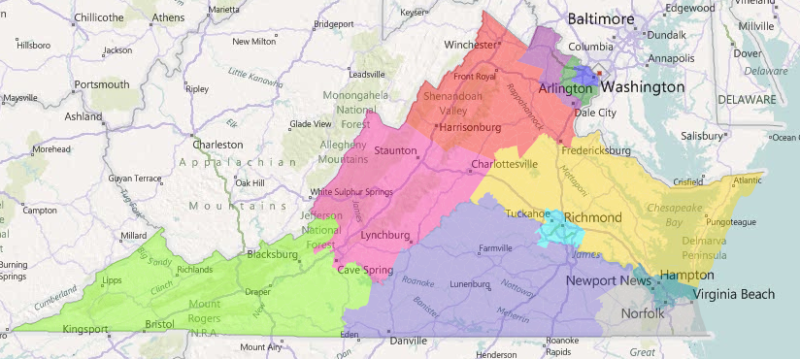
We’ll begin with the districts from the western side of Virginia. Here’s a map that stretches from  Southwest Virginia (SWVA) north into the Shenandoah Valley and east into what is known as Southside Virginia. I’ll discuss districts 40, 38, 22, 21, 19, and 23 here.

Photobucket

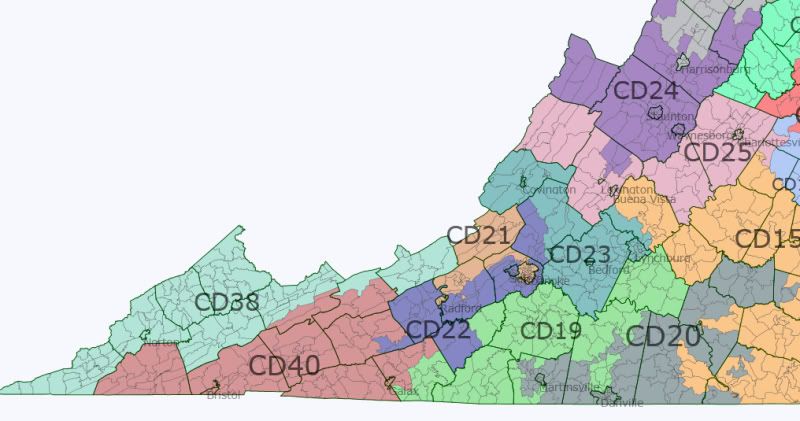
VA-40 (Brown) – GOP Incumbent, Safe GOP

In its current form, this district is one of the most Republican districts in Virginia. However, on my map it is now the most GOP-heavy based on 2008 numbers. This ought to please William Wampler, Jr., who represents this district.

Before – Dem average: 38.1%,  Obama: 33.2%

After – Dem average 37.1%, Obama 32.9%, Race: 94.2% W, 2.4% B, 2% H

VA-38 (Aquamarine or Light Blue) – DEM Incumbent, Likely DEM with Incumbent and Likely GOP otherwise

The Democratic representation in this district is a holdover from the days when coal unions still held more power and plenty of Southern and Appalachian Democrats were still consistent voters for the party. Phil Puckett, the incumbent here, took office in 198 and went unopposed in 2007. He ran unsuccessfully for the Lieutenant Governor’s nomination in 2005. As a conservative Democrat who Johnny Longtorso compared in his recent diary on the State Senate to Bobby Bright, Puckett is the only kind of Dem who can hold this district. Luckily, he’s only 63 and could probably hold this district for a while longer. I am confident that the day he retires, the district will fall into Republican hands. For that reason and the fact that there weren’t exactly many Democratic areas to extend the district into, I didn’t really alter the complexion of the district very much. We can see the 2008 shift in Appalachian voters in the numbers:

Before – Dem avg.: 46.5%, Obama: 39.8%

After – Dem avg.: 46.7%, Obama: 39.5%, Race: 93.7% W, 3.7% B, 1% H

VA-22 (Navy Blue) – GOP Incumbent, Safe GOP

This district was extended down into the southwest some while losing Radford, a town with college students in it and therefore more blue. However, everything else about this district is red except the color I gave it on the map. It incorporates the city of Salem which is famous for its appearance in the movie Borat where he’s at the rodeo and sings the national anthem incorrectly. Yeah, it’s a conservative area. Its northeastern edge contains half of Botetourt County, which is where the incumbent, Ralph K. Smith, lives. Hopefully, he lives in the western half of the county that’s still in this district.

Before – Dem avg.: 40.2%, Obama: 39.1%

After – Dem avg.: 39.7%, Obama: 37.9%, Race: 91.7%, 3.7% B, 1.7% H, 1.4% A

VA-21 (Chocolate) – DEM Incumbent, Lean/Likely DEM

Originally, I extended Phil Puckett’s district over to Radford to attempt to pick up more Dem voters. However, I realized that was something of a dummymander so instead I included Radford in the new VA-21 which joins the other college town of Blacksburg, where Virginia Tech is located, in the southern part of the district. The most important Dem source of votes is the city of Roanoke, which is entirely in this district, and is the largest city in western Virginia, and is where incumbent John Edwards lives.

Before – Dem avg.: 54.2%, Obama: 56.2%

After – Dem avg.: 54.7%, Obama: 57.4%, Race: 74% W, 15.9% B, 4.1% H, 3.7% A

VA-23 (Teal) – GOP Incumbent, Safe GOP

This district was mostly unaltered, though it became slightly more Democratic. However, it is still solidly red for incumbent Steve Newman. It’s home of Lynchburg, where Liberty University is, so I guess that’s appropriate.

Before – Dem avg.: 38.1%, Obama: 37%

After – Dem avg.: 40.9%, Obama: 39.3%, Race: 78.8% W, 15.7% B, 2.1% H, 1.4% A

VA-19 (Lime Green) – GOP Incumbent, Safe GOP

Fresh incumbent William Stanley took over this district after Robert Hurt defeated Congressman Tom Perriello in the 2010 election for the Virginia 5th Congressional District. However, the 19th has been greatly altered, losing all of Danville and part of Pittsylvania County while adding the rest of Campbell County and parts of Carroll, Floyd, Henry, and all of Patrick counties. What’s left is a redder district:

Before – Dem avg.: 41.3%, Obama: 41.6%

After – Dem avg.: 36.6%, Obama: 34.1%, Race: 85.2% W, 10.5% B, 2.2% H

Sticking with the Southside area, we’ll move along the southern border of the state towards Richmond and the Tidewater. Here’s a picture of the area, and I will talk about districts 20 and 15:

Photobucket

VA-20 (Gray) – Dem Incumbent, Safe DEM with Incumbent, Lean DEM/Toss-up otherwise

Roscoe Reynolds has represented this district since winning a special election to replace then-Democrat and later everyone’s favorite “blame ‘Anchor babies’ for all of America’s problems” Congressman Virgil Goode. He’s a Blue Dog but not too far to the right. His district originally went over to the city of Galax and into SWVA. I have shifted it towards the center, grabbing many heavily African-American areas and the Dem-leaning city of Danville to join Reynold’s hometown Martinsville. Considering he won with over 60% of the vote in a district where Obama got 40%, I’m confident he can hold the bluer district I’ve built.

Before – Dem avg.: 42.5%, Obama: 40%

After – Dem avg.: 50.3%, Obama: 52.7%, 57.7% W, 37.2% B, 3% H

VA-15 (Gold) – GOP Incumbent, Safe GOP

VA-20 stole major blue areas from VA-15, and in the meantime, VA-15 became both redder and the largest district in the state. Incumbent Frank Ruff, who lives in Clarksville, right at both the border of Virginia and North Carolina and where the VA-15 meets VA-20, should be pleased with it.

Before – Dem avg.: 44.9%, Obama: 46.9%

After – Dem avg.: 43.2%, Obama: 45%, Race: 66.4% W, 29% B, 2.3% H

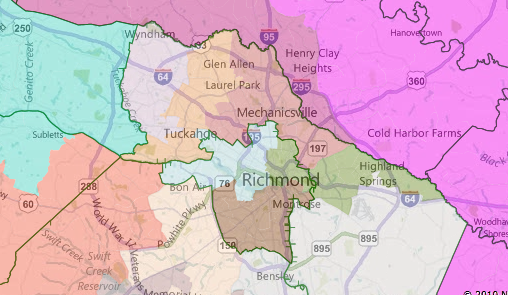
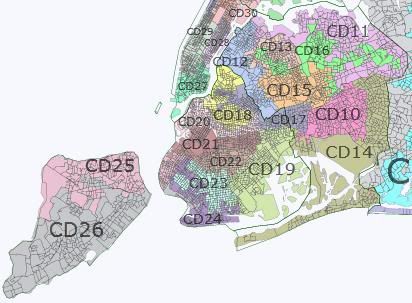
Continuing east, we will now discuss the Richmond area. We’ll discuss districts 12, 11, 10, 9, and 16. Here’s a map:

Photobucket

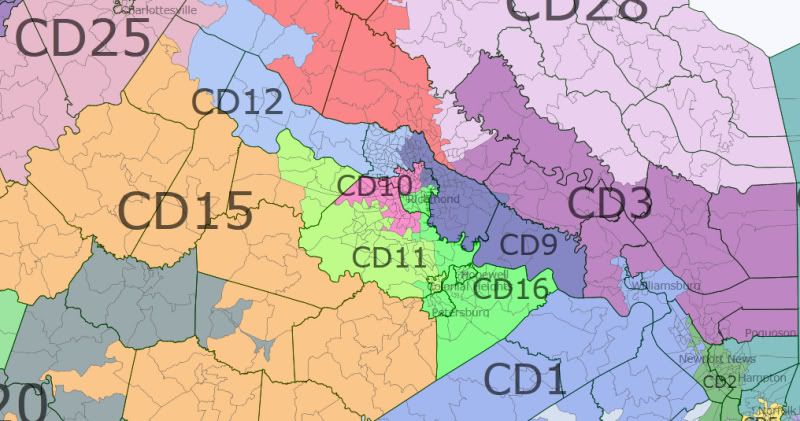
VA-12 (Light Blue) – GOP Incumbent, Safe GOP

This district used to contain a small part of Richmond but no more. The growth in Henrico County guaranteed that the district would have to shift boundaries and it has. Former GOP Majority Leader, Walter Stosch, represents this district, and while he’s getting up in years, I’m sure he’ll be fine with this district.

Before – Dem avg.: 41.4%, Obama: 45.2%

After – Dem avg.: 40.5%, Obama: 43.7%, Race: 72.8% W, 12.2% B, 4.3% H, 8.4% A

VA-11 (Chartreuse) – GOP Incumbent, Safe GOP

Outside of NoVA, few areas of the state had larger growth than Chesterfield County. This created an opportunity to shrink VA-10 to make it more Democratic while leaving VA-11 with most of the redder areas. VA-11 stretches into the GOP stronghold city of Colonial Heights and stretches into Powhatan County in the west to create one of the reddest districts on this new map.

Before – Dem avg.: 42.6%, Obama: 47.2%

After – Dem avg.: 35.8%, Obama: 38.5%, Race: 75% W, 15.5% B, 4.4% H, 2.8% A

VA-10 (Pink) – GOP Incumbent, Lean DEM, DEM PICK-UP +1

VA-10 was reduced in geographic scope more than any other district on the map from its original form as far as I can tell, becoming perhaps one-third of its previous size due to the large growth in Chesterfield County. By slightly increasing the parts of Richmond that are in the district and by putting all of the Dem-leaning areas of Chesterfield County in the district, I’ve created the first real Dem pick-up opportunity without drawing out the incumbent, John Watkins, who lives in Midlothian which remains in the district.

Before – Dem avg.: 41%, Obama: 43.2%

After – Dem avg.: 53.3%, Obama: 58.3%, Race: 63.4% W, 24.4% B, 6.7% H, 3.2% A

VA-9 (Navy Blue) – DEM Incumbent, Safe DEM

The first majority-minority district to discuss, VA-9 did not change much, holding onto a part of Richmond and all of Charles City County while only adding a small part of Henrico to leave the county in only two districts and a tiny part of New Kent County for population reasons. It remains a 50%+1 black district.

Before – Dem avg.: 73.3%, Obama: 78%

After – Dem avg.: 68.4%, Obama: 73.9%, 34% W, 56.4% B, 4.1% H, 2.6% A

VA-16 (Lime Green) – DEM Incumbent, Safe DEM

Another majority-minority district, the VA-16 incorporates parts of Richmond and Chesterfield County while having all of Prince George and African-American-heavy Petersburg and Hopewell.

Before – Dem avg.: 67.1%, Obama: 73.9%

After – Dem avg.: 62.4%, Obama: 70.5%, Race: 35.1% W, 51.7% B, 9.2% H, 1.6% A

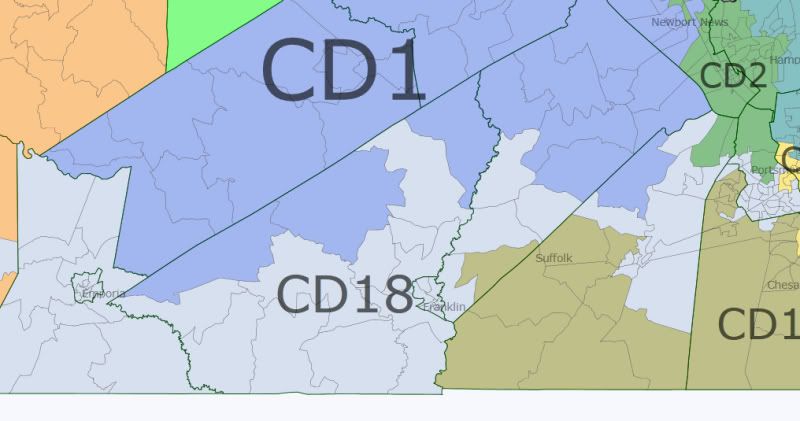
VA-18 (White, picture below) – DEM Incumbent, Safe DEM

Moving on to the Tidewater area, I’ll first give us a picture of the most gerrymandered district on this map, VA-18, which was drawn for VRA reasons originally. It has been slightly shifted east but remains an awkward construction whose sole purpose is to create a 50%+1 black district stretching from eastern Southside to Portsmouth in the Tidewater.

Photobucket

The statistics for VA-18:

Before – Dem avg.: 64.9%, Obama: 67.9%

After – Dem avg.: 61.6%, Obama: 65%, Race: 41.2% W, 52.4% B, 2.8% H, 1.2% A

VA-1 (Royal Blue, picture below) – DEM Incumbent, Lean DEM

Right above VA-18 is VA-1, which used to include the city of Poqouson to the east along with Newport News and parts of Hampton. Now it runs down into where VA-13 used to be (I’ll get that to that momentarily), taking in sections of Southampton and Isle of Wight counties and all of Surry and Sussex. At the same time, it stretches up to take in the college town of Williamsburg and the Dem-leaning areas right around it in James City County and southern York County. As incumbent John Miller lives in Newport News, most of the city is located in VA-1 but the part of Hampton that was in it has been removed.

Photobucket

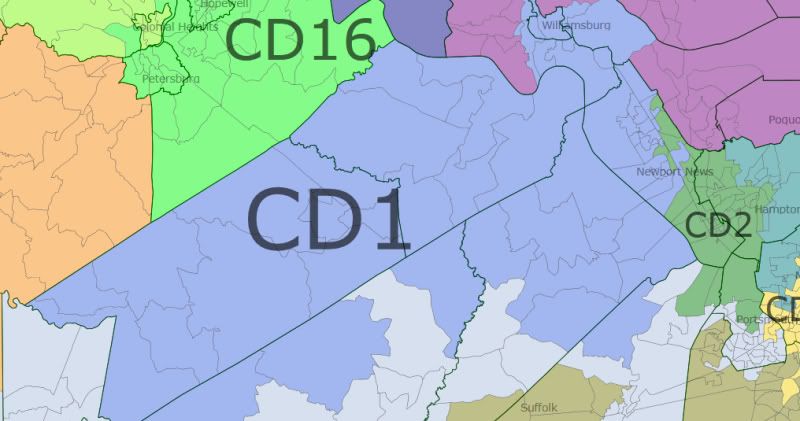
As I said a moment ago, VA-13 was once located in this area, running from Hopewell, through Suffolk and into part of Portsmouth. However, NoVA clearly needed another district somewhere and this seemed like an appropriate district to ax as its incumbent is 75-year old Fred Quayle, who while powerful, could easily be close to retirement. He apparently teaches at Old Dominion University and could be coaxed into spending his time doing that for his remaining years. Remember, the Dems get to draw this map, and doing it this way certainly helps Miller, whose district had a GOP-majority average.

Before – Dem avg.: 43.8%, Obama: 47.1%

After – Dem avg.: 50.7%, Obama 55.7%, Race: 57.1% W, 30.4% B, 6.3% H, 2.8% A

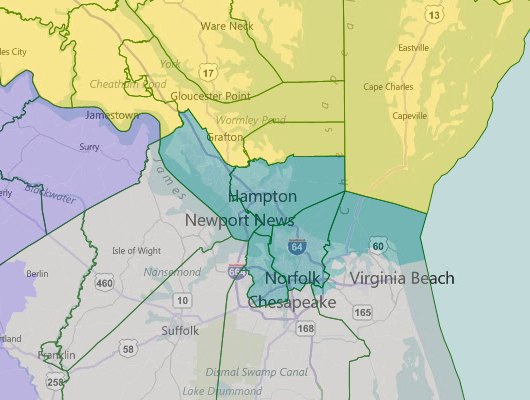
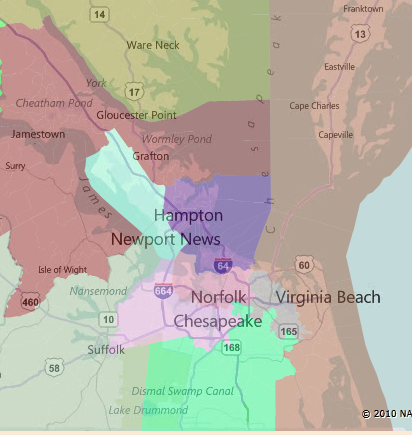
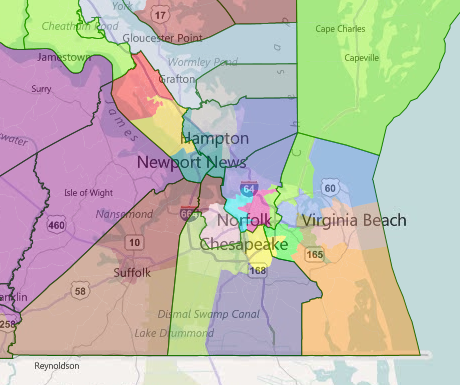
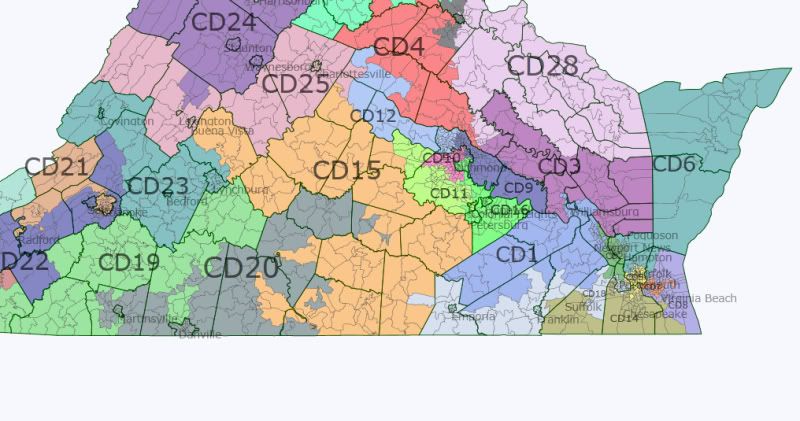
Now, for the rest of the Tidewater districts. We’ll cover districts 2, 5, 6, 7, 8, and 14 here:

Photobucket

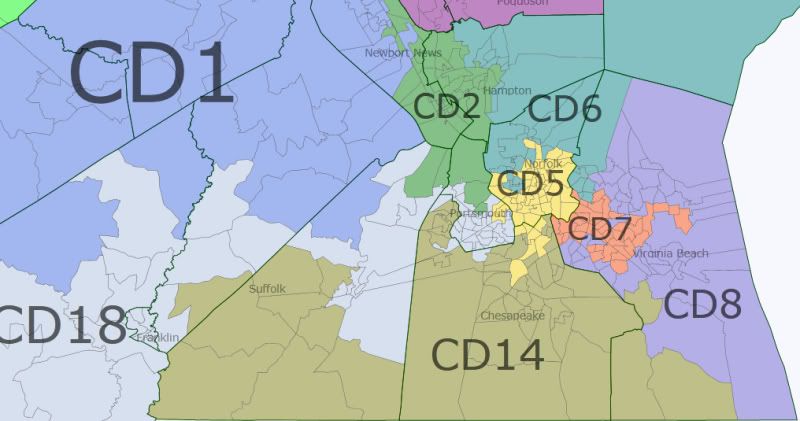
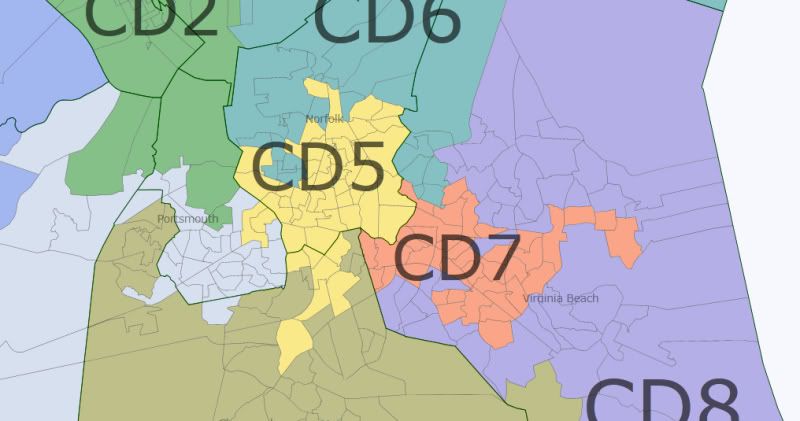
And a further zoom in:

Photobucket

VA-2 (Green) – DEM Incumbent, Safe DEM

VA-2 is home to incumbent Mamie Locke, who lives in Hampton, and the district is another majority-minority one. This district was not greatly altered from its original form, just picking up some GOP and less-blue parts of Newport News to help out VA-1.

Before – Dem avg.: 68.3%, Obama: 73.7%

After – Dem avg.: 64.6%, Obama: 69.8%, Race: 38.2% W, 51.2% B, 4.9% H, 2.2% A

VA-5 (Yellow) – DEM Incumbent, Safe DEM

Another majority-minority district, VA-5 is represented by Yvonne Miller of Norfolk, who ranks 4th overall in seniority in the Senate, and chairs the Transportation committee. Needless to say, her district is very safe. While it originally included a small part of Virginia Beach, it instead has part of Portsmouth now to accompany its sections in Norfolk and Chesapeake, where it dips down to take in the heavily African-American areas of that city.

Before – Dem avg.: 72.3%, Obama: 77.4%

After – Dem avg.: 70.7%, Obama: 75.5, Race: 37.1% W, 51.1% B, 5.7% H, 2.9% A

VA-6 (Teal) – DEM Incumbent, Lean DEM

Another swing district that needed to be aided. Originally, VA-6, which includes the entire Eastern Shore, crossed the Chesapeake Bay and included Mathews County (now in VA-3) while also jutting down into Norfolk, where incumbent Ralph Northam lives, and Virginia Beach. However, the district has been shifted to remove the very red Mathews Co., and now incorporates the eastern half of Hampton city while removing some redder areas of Norfolk from it. Hopefully, Northam lives in the part of Norfolk in the district. If not, it could be altered slightly without affecting its numbers much to do so.

Before – Dem avg.: 50.5%, Obama: 53.5%

After – Dem avg.: 53.8%, Obama: 57.7%, Race: 55.7% W, 30.6% B, 7.4% H, 2.8% A

VA-7 (Orange) – GOP Incumbent, Lean DEM/Toss-up, DEM PICK-UP +1

Drawn to include only Virginia Beach still, this district has been designed to take in all the Dem-leaning and Dem-heavy parts of the biggest city in Virginia. In doing this, the diverse district has become a toss-up or possible Democratic pick-up, and given the shifting demographics here, it should continue moving in a blue direction. It’s not clear if the incumbent, Frank Wagner, lives in this part of Virginia Beach, but I’m going to guess he does.

Before – Dem avg.: 46.3%, Obama: 49.6%

After – Dem avg.: 51.4%, Obama: 56.4%, Race: 55.5% W, 24.6% B, 7.9% H, 7.7% A

VA-8 (Slate Blue) – GOP Incumbent, Safe GOP

VA-8 takes up most of the rest of Virginia Beach, particularly the wealthiest areas and the areas to the east, south, and southwest of the Naval Air Station Oceana with a large military presence.

Before – Dem avg.: 42.7%, Obama: 44.5%

After – Dem avg.: 41%, Obama: 40.7%, Race: 76.5% W, 10.3% B, 5.1% H, 5% A

VA-14 (Olive Green) – GOP Incumbent, Safe GOP

This district stretches into the edge of Virginia Beach, contains almost all of Chesapeake as well as the southern half of Suffolk, and a little part of Isle of Wight County. It is possible that if the aforementioned Fred Quayle wants to run again, he could move a little south from where (I’m assuming based on the old VA-13 and Wikipedia) he lives in upper Suffolk down into VA-14 and challenge incumbent Harry Blevins. It’s possible that VA-14 could be drawn to include both, forcing a primary.

Before – Dem avg.: 40.7%, Obama: 41.9%

After – Dem avg.: 40.1%, Obama: 39.7%, Race: 69.9% W, 20.2% B, 4.1% H, 2.9% A

Moving north in the direction of the Northern Neck region, we have VA-3 and 28.

Photobucket

VA-3 (Purple) – GOP Incumbent, Safe GOP

Home to Minority Leader Tommy Norment, this district clearly had to protected in a sense, and definitely needed to include his home in James City County. Most of the county is still in this district so hopefully he doesn’t live right next to Williamsburg. By stealing Williamsburg and the rest of Newport News for VA-1, the district had to move north. At the same time, by way of water contiguity I was able to include the incredibly red city of Poqouson in the district as well, helping out VA-1 as well.

Before – Dem avg.: 44.6%, Obama: 46.4%

After – Dem avg.: 36.5%, Obama: 35.6%, Race: 81.9% W, 10% B, 3% H, 2.4% A

VA-28 (White) – GOP Incumbent, Safe GOP

You can see on other maps on here that VA-28 stretches up around Fredericksburg into Stafford and Spotsylvania Counties. However, most of the district covers the rest of the Northern Neck area. While not unbelievably red, it would take a conservative Democrat to have a chance here.

Before – Dem avg.: 43.2%, Obama: 46.1%

After – Dem avg.: 42.3%, Obama: 44.3%, Race: 71.2% W, 21.2% B, 4% H, 1.2% A

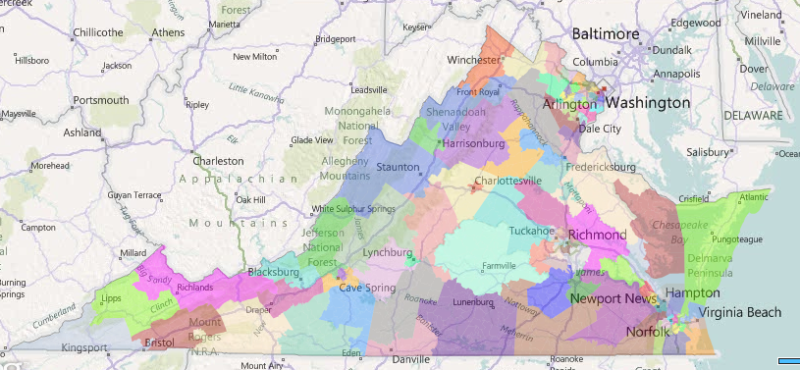
The rest of the area above Southside and moving towards NoVA needs to be covered – districts 24, 25, 26, 27, 4, and 13-so here’s a picture:

Photobucket

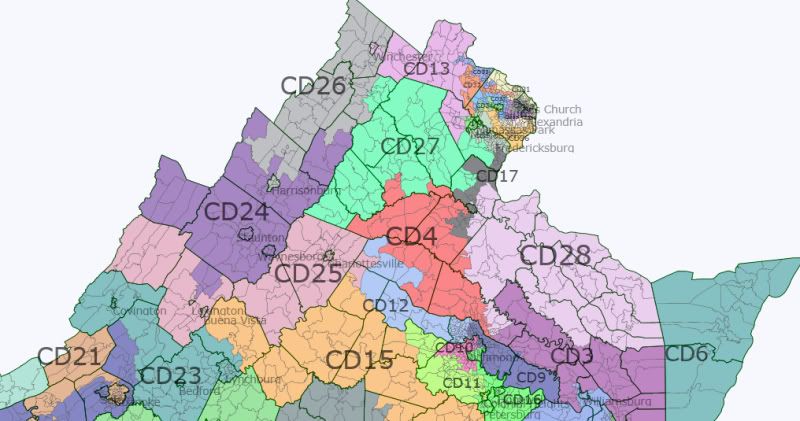
VA-24 (Purple) – GOP Incumbent, Safe GOP

Bland, conservative district where part of my family is from, represented by Emmett Hanger. He’s a staunch conservative but willing enough to talk to the other side that he faced a major primary challenge in 2007, holding on in a close one.

Before – Dem avg.: 36.4%, Obama: 37.7%

After – Dem avg.: 33.6%, Obama: 35.1%, Race: 89.9% W, 4.7% B, 3.3% H

VA-25 (Pink) – DEM Incumbent, Likely DEM

The district of failed 2009 gubernatorial candidate Creigh Deeds, the district has been altered slightly to keep Deeds’ home of Bath County in the western part but loses trending-red Alleghany and Covington city within it. Lexington has been added from VA-24 with its college population, and the district now fully encompasses Albemarle County, which is generally trending blue, and of course the best little city on Earth, Charlottesville (UVA graduate so I’m biased).

Before – Dem avg.: 56.9%, Obama: 59.3%

After – Dem avg.: 56.7%, Obama: 59.5%, Race: 77.8% W, 11.4% B, 4.5% H, 3.9% A

VA-26 (Gray) – GOP Incumbent, Safe GOP

The only notable thing about this district is that it had to keep Harrisonburg to appease incumbent Mark Obenshain. I’m from Harrisonburg originally and it is painful to be have my hometown represented by one of the probably two most conservative members of the Senate. If you’re a Republican and you want a crazy bill to be sponsored, call up Mr. Obenshain. He’s a nice guy but definitely not politically desirable in any way.

Before – Dem avg.: 37.6%, Obama: 41.5%

After – Dem avg.: 36.8%, Obama: 40.7%, Race: 85% W, 3.6% B, 8.1% H, 1.5% A

VA-27 (Spring Green) – GOP Incumbent, Safe GOP

Another fairly solid GOP district that dips into part of Prince William County to take in some of the red areas still on the outer part of that county in NoVA.

Before – Dem avg.: 41.1%, Obama: 43.3%

After – Dem avg.: 39.9%, Obama: 42.2%, Race: 81.1% W, 9% B, 5.6% H, 1.7% A

VA-4 (Red) – GOP Incumbent, Safe GOP

And yet another solid GOP district.

Before – Dem avg.: 38.3%, Obama: 39.8%

After – Dem avg.: 38.7%, Obama: 40.7%, Race: 78.3% W, 12.9% B, 4.9% H, 1.4% A

VA-13 (Purplish Pink) – Open Seat, Likely GOP (for now)

Having more or less seen a doubling of its total population in the last ten years, Loudon County presents a great challenge to redistricting. The eastern half of the county is more liberal and more urban, and is where most of the growth has occurred. However, growth has happened everywhere in the county to some degree, with the western and northern parts of the county still more GOP-flavored. Interestingly, the southwest and middle of the southern part of the county are bluer. Anyway, by getting rid of VA-13 in the Tidewater, I was able to create a new district in NoVA that stretches from Loudon and Prince William Counties over to Winchester at the top of the Shenandoah Valley. While this district is currently more Republican, it is possible that continued growth in Loudon could make the district more and more competitive. It is my hope that the district will eventually become a swing district where the Dems can make a play; in a sense, it is something of an anti-dummymander.

Before – old district in the Tidewater

After – Dem avg.: 43.5%, Obama: 46.5%, Race: 73.2% W, 7.9% B, 9.1% H, 6.7% A

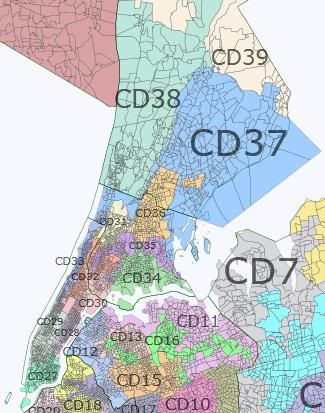
Before moving into NoVA directly, we need to cover VA-17:

Photobucket

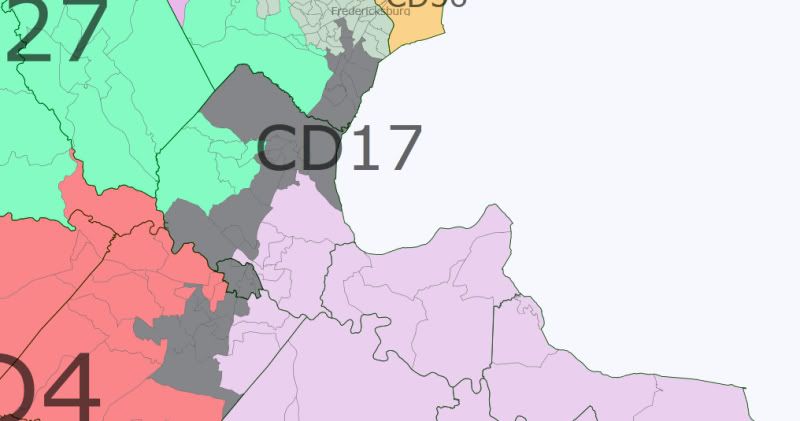
VA-17 (Black) – DEM Incumbent, Safe DEM (considering he has been in office awhile)

This district may not be realistic because of its narrowness. However, the current VA-17 has a Democratic incumbent, Edd Houck, in a fairly red district who needs to have much better numbers. Thus, the new district includes all of Fredericksburg now, and stretches from its bottom in Spotsylvania, VA (where Houck lives), to its top in Prince William County. This drastically alters the old district Houck was in, which President Obama lost by 10 points and was 75% white or so, to a new one that is not far away from being simply white-plurality and Obama won by 13 points.

Before – Dem avg.: 42.5%, Obama: 45.5%

After – Dem avg.: 51%, Obama: 56.5%, Race: 55.1% W, 24.2% B, 12.5% H, 4.2% A

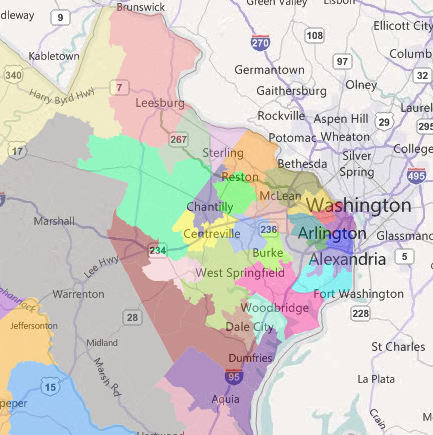
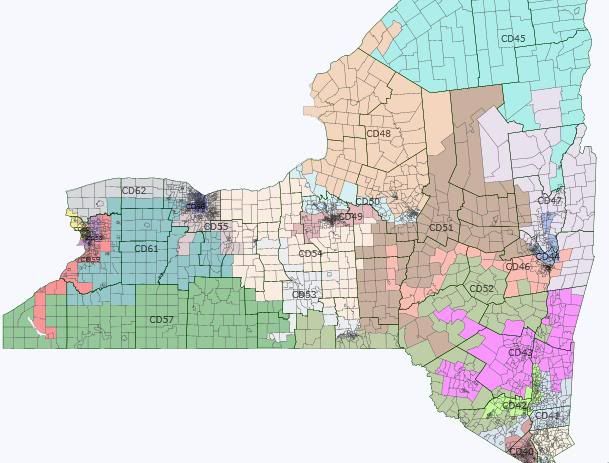
Northern Virginia is the last task at hand. Currently, every district in this region is held by a Democrat, so the project is very much to shore up some districts.

Photobucket

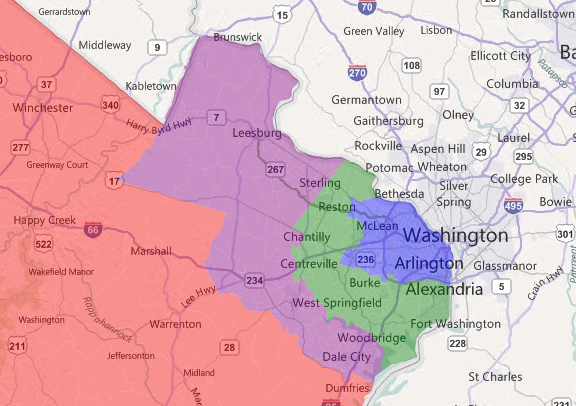
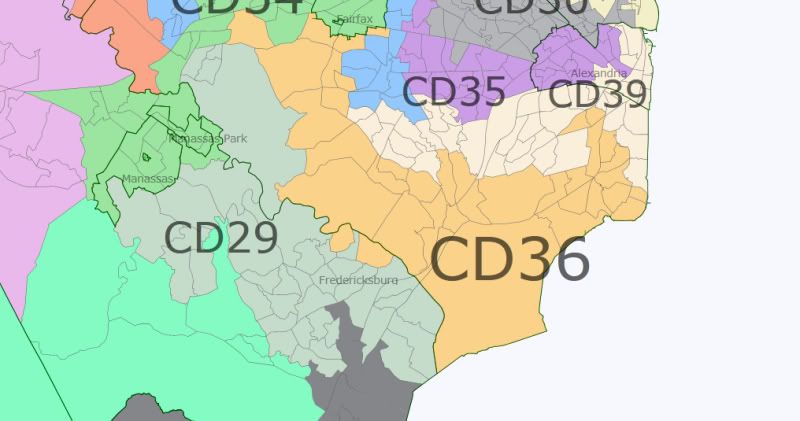
The southern half of NoVA:

Photobucket

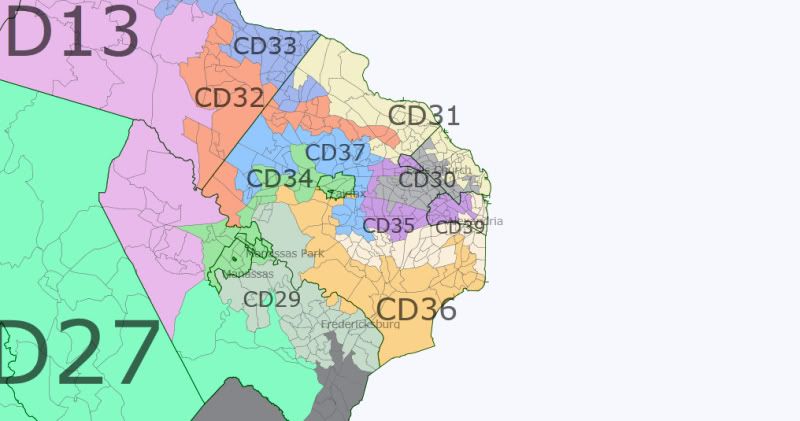
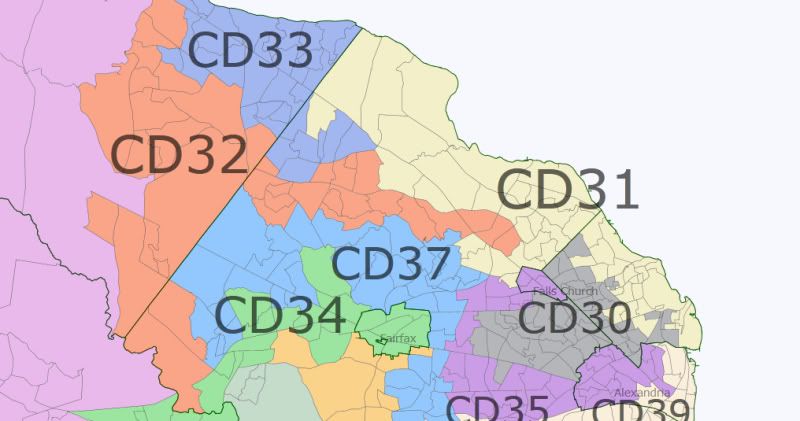
The northern half of NoVA:

Photobucket

VA-29 (Sea Green) – DEM Incumbent/Possibly Open, Lean/Likely DEM

Chuck Colgan, the incumbent, is the Senate Pro Tempore, and is 84 years old. He wanted to retire before the 2007 election but Governor Tim Kaine coaxed him to hang around. It seems likely that he is waiting to see what his district looks like before announcing his retirement. Via Johnny Longtorso, the former mayor of Manassas, a popular Republican, is probably waiting for him to retire. Given this information, I have redrawn VA-29, which had way too many people due to the explosive growth in Prince William County, to avoid keeping Manassas and Manassas Park. It may be a stretch (mainly because of what VA-34 looks like) but I thought I would give it a shot. By the way, this district becomes a majority-minority district with a white plurality.

Before – Dem avg.: 46.7%, Obama: 52.4%

After – Dem avg.: 51.2%, Obama: 58%, Race: 47% W, 19.4% B, 21.7% H, 8% A

VA-30 (Gray) – Open, Safe DEM

Given that incumbent Patsy Ticer has announced that she will not run for another term, this district ought to see heavy competition for the Democratic nod considering it is essentially a sure-thing for Democrats. So really, you could draw this district in a variety of ways because she’s out. I drew it to not include Alexandria, which it had before, and to only include Arlington and Fairfax Counties. It also remains a slightly minority-majority district with a white plurality.

Before – Dem avg.: 67.7%, Obama: 69.5%

After – Dem avg.: 65.8%, Obama: 66.9%, Race: 49.7% W, 9.5% B, 24.6% H, 13.2% A

VA-31 (Khaki) – DEM Incumbent, Safe DEM

Another relative given for the Democrats, I drew Falls Church out of this district, which makes it less Democratic but still pretty solidly blue.

Before – Dem avg.: 68.4%, Obama: 68.8%

After – Dem avg.: 61.2%, Obama: 62.1%, Race: 70.2% W, 4.6% B, 9% H, 13% A

VA-32 (Orange Red) – DEM Incumbent, Likely DEM

This district snakes into Fairfax to pick up some bluer areas closer to Arlington while taking up part of Loudon County. It’s possible that this district would need to be redrawn because I have no clue where in Fairfax incumbent Janet Howell lives. Then again, a couple could probably switch districts.

Before – Dem avg.: 57.1%, Obama: 60.2%

After – Dem avg.: 54.3%, Obama: 58.7%, Race: 55.4% W, 7.8% B, 10.2% H, 22.8% A

VA-33 (Royal Blue) – DEM Incumbent, Likely DEM

With its new shape, this district becomes more solidly blue, shoring up incumbent Mark Herring’s position.

Before – Dem avg.: 49.6%, Obama: 55.4%

After – Dem avg.: 51.3%, Obama: 57.2%, Race: 57.2% W, 7.8% B, 18.6% H, 13% A

VA-34 (Green) – DEM Incumbent, Likely DEM

Chap Petersen, who represents this district, is probably one of the most well-known State Senators in Virginia and is probably bound for higher office some day. He lives in Fairfax City, and this district has been drawn to take that in and snake out to pick up the cities of Manassas and Manassas City. In the process, it becomes a majority-minority district with a white plurality.

Before – Dem avg.: 54.4%, Obama: 57.4%

After – Dem avg.: 51.6%, Obama: 58.5%, Race: 47.9% W, 10.5% B, 22.6% H, 15.5% A

VA-35 (Purple) – DEM Incumbent, Safe DEM

Senate Majority Leader Dick Saslaw occupies this seat, meaning that it will probably stay very blue. It stretches from the western part of Alexandria around the VA-30 to take in Falls Church, remaining a majority-minority district with a white plurality.

Before – Dem avg.: 61.8%, Obama: 65.3%

After – Dem avg.: 63.6%, Obama: 66.9%, Race: 46.8% W, 15.4% B, 20.1% H, 14.5% A

VA-36 (Gold) – DEM Incumbent, Likely DEM

This district loses Dem-heavy areas to VA-17 and VA-39, but is still pretty solidly blue.

Before – Dem avg.: 57.8%, Obama: 63.9%

After – Dem avg.: 53.9%, Obama: 58.5%, Race: 51.6% W, 16.4% B, 16.5% H, 11.8% A

VA-37 (Dodger Blue) – DEM Incumbent, Leans/Likely DEM

This district winds around Fairfax, from Burke (where just-elected-in-a-special-election incumbent Dave Marsden lives), to part of Centreville, making it bluer.

Before – Dem avg.: 51.3%, Obama: 56.2%

After – Dem avg.: 53.6%, Obama: 57.1%, Race: 60.3% W, 5% B, 12.1% H, 19.2% A

VA-39 (White) – DEM Incumbent, Safe DEM

Incumbent George Barker only won in 2007 in his first race by 151 votes so making his district bluer was very important. In the process, given its original position, it became much bluer, mainly due to taking parts of VA-36.

Before – Dem avg.: 51.8%, Obama: 55.9%

After – Dem avg.: 58.9%, Obama: 61.5%, Race: 59.8% W, 11.9% B, 13.9% H, 11.2% A

And there it is, folks. Hopefully the Democrats can pick up VA-7 and VA-10 to take two extra seats in this set up to increase their majority to 24-16. And in the long run, knowing that eventually VA-38 will be lost to the GOP, it’s nice that VA-13 is hopefully going to continue trending towards being very much a toss-up district.

Maryland Population Shifts by State Senate District

So yeah, lately in my few spare moments I’ve been working on the perfect Maryland legislative redistricting map. Before I release that though, I want to talk a little about the thought process that goes into such a map. Today’s diary will show how the population in Maryland has shifted over the past decade, and what this will mean for redistricting in my beloved home state.

To start, I made a map using Census 2010 colors, that shows how the state’s districts have grown over the past decade.

From this map we can make several conclusions:

– Given that the state growth rate was around 9%, it makes sense that most districts would be in the 5-15% range.

– Growth in traditionally high-growth exurbs of Baltimore (Carroll, Harford, northern Baltimore County) slowed to the state average this decade.

– Many of Baltimore’s inner suburbs stagnated (although this is an improvement for Essex/Dundalk, which had been losing population for decades)

– 5 of Baltimore City’s 6 districts lost significant population, guaranteeing the loss of a State Senate district. The one that actually did post a modest gain, District 46, is the one most likely to be abolished given that it’s the only non-majority black district in Baltimore City.

– The only district to lose population outside of Baltimore City was majority-black District 24 in Prince George’s County. Every district in MD that lost population over the past decade was majority-black.

This might be worth exploring in a later diary, but the correlation coefficient between %black and %growth was -.54, while for whites it was .42, Asians .39, and Hispanics .05

– The highest growth area of the state by far is the I-270 corridor in Frederick/Montgomery Counties. District 15 gained an amazing 28%, while District 3 gained 25%.

– Other areas growing significantly faster than the state average include:

     – the western Baltimore suburbs (9 and 11)

     – Gaithersburg/Rockville (17)

     – Southern Maryland (27, 28, and 29)

     – Outer Prince George’s County (21 and 23)

     – the Upper Eastern Shore (36) – mostly from high growth around Elkton and Kent Island

– Although growth stagnated in the inner DC suburbs, the balance of power in the state continues to shift towards DC.

Redistricting Implications

Growth isn’t everything. Another important consideration is the extent to which current districts are over or under population. Under the law, districts must be within 5% deviation of the mean population. The following map shows what districts are over, under, or acceptable.

From this map, one can see that inner Baltimore and DC suburbs districts will need to expand, while the outer suburban and rural districts will need to contract.

Side Note about Deviation

It’s important to note that a lot of the underpopulated districts started out with fewer people in 2000. Here’s a map showing which districts were drawn to be over and under the median (but within 5%) in 2000.

As you can see, the Democratic Party has used acceptable deviation as way to slightly maximize the influence of its most loyal counties – Prince George’s, Montgomery, and Baltimore City. Expect to see deviation put to good use in my map, as well as in the map that eventually gets drawn.

Conclusion

So yeah, that’s it. I hope this gets a few people talking and/or thinking. Before I release my perfect legislative map, I’m thinking about writing a diary on the history of Maryland legislative redistricting, so be on the lookout for that as well.

Redistricting California (Part 2): State Senate

Here is my attempt at redistricting the California State Senate. With over 936,000 people per district, satisfying communities of interest becomes a bit more challenging. Here are the districts I ended up drawing.

Majority-White: 22

Majority-Hispanic: 8

Majority-Minority: 10

Safe Dem: 19

Likely Dem: 1

Lean Dem: 3

Toss-Up: 7

Lean GOP: 3

Likely GOP: 6

Safe GOP: 1

Outer NorCal

Photobucket

SD-01: Coastal NorCal (Previously SD-02) (Noreen Evans)

Description: Similar shape to the old district, plus added Del Norte County and the westernmost part of Solano to satisfy district size

Demographics: 68.4% White, 16.1% Hispanic, 5.6% Asian

2008 President: Obama 69.1%, McCain 28.5% (SAFE DEM: D+16)

SD-02: Central Valley and Yolo County (Previously SD-04) (Doug LaMalfa and Lois Wolk unless she moves to the new SD-05)

Description: Similar to previous configuration only I added Yolo County to satisfy population size. Lois Wolk (from Davis and currently in SD-05) would be put into this district and would lose to LaMalfa unless she moved to the new SD-05.

Demographics: 71.8% White, 16.1% Hispanic, 5.5% Asian

2008 President: McCain 49.9%, Obama 47.9% (LEAN GOP: R+4)

SD-03: All of Marin, eastern San Francisco, and SE Sonoma (Mark Leno)

Demographics: 56.4% White, 17.8% Asian, 15.6% Hispanic, 6.7% Black

2008 President: Obama 82.2%, McCain 15.8% (SAFE DEM: D+29)

SD-04: Mountain counties along most of the Nevada border plus some Sacramento suburbs (Previously SD-01) (Ted Gaines)

Demographics: 80.8% White, 10.0% Hispanic

2008 President: McCain 54.1%, Obama 44.9% (LIKELY GOP: R+8)

SD-05: Most of Solano and Sacramento, NW San Joaquin (Lois Wolk if she moves here from SD-02)

Description: Removed Yolo and included more of Sacramento

Demographics: 59.5% White, 18.2% Hispanic, 10.2% Asian, 7.2% Black

2008 President: Obama 53.4%, McCain 44.9% (TOSS-UP: EVEN)

SD-06: Sacramento and some inner suburbs (Darrell Steinberg)

Demographics: 50.3% White, 17.9% Hispanic, 14.2% Asian, 11.8% Black

2008 President: Obama 65.1%, McCain 33.0% (SAFE DEM: D+12)

San Francisco Bay Area

Photobucket

SD-07: Oakland, Berkeley, Richmond, Martinez (Previously SD-09) (Loni Hancock)

Demographics: 36.0% White, 24.2% Black, 18.5% Hispanic, 16.7% Asian

2008 President: Obama 86.7%, McCain 11.3% (SAFE DEM: D+33)

SD-08: Western half of San Francisco, most of San Mateo (Leland Yee)

Demographics: 46.4% White, 27.6% Asian, 18.3% Hispanic

2008 President: Obama 75.4%, McCain 22.8% (SAFE DEM: D+22)

SD-09: Inland Alameda and Contra Costa (Previously SD-07) (Mark DeSaulnier)

Demographics: 67.9% White, 14.5% Hispanic, 9.3% Asian

2008 President: Obama 63.0%, McCain 35.3% (SAFE DEM: D+10)

SD-10: Western Alameda County and Milpitas in Santa Clara County (Ellen Corbett)

Demographics: 32.9% White, 31.4% Asian, 24.6% Hispanic, 6.1% Black

2008 President: Obama 72.7%, McCain 25.4% (SAFE DEM: D+20)

SD-11: Silicon Valley and Santa Cruz County (Joe Simitian)

Demographics: 58.4% White, 20.2% Asian, 15.9% Hispanic

2008 President: Obama 73.7%, McCain 24.2% (SAFE DEM: D+21)

SD-12: San Jose and part of Stanislaus County (Previously SD-13) (Elaine Alquist)

Demographics: 42.4% White, 31.0% Hispanic, 19.6% Asian

2008 President: Obama 67.4%, McCain 30.9% (SAFE DEM: D+14)

SD-13: Stockton, Modesto, Merced (Previously SD-12) (Anthony Cannella)

Demographics: 50.0% White, 34.1% Hispanic, 6.8% Asian

2008 President: Obama 52.1%, McCain 46.2% (TOSS-UP: R+1)

Central

Photobucket

SD-14: Eastern Central Valley and northern half of Fresno (Tom Berryhill)

Demographics: 57.9% White, 28.7% Hispanic, 5.6% Asian

2008 President: McCain 53.6%, Obama 44.7% (LIKELY GOP: R+8)

SD-15: Central Coast (Sam Blakeslee)

Description: Still a Central Coast-centric district, only I removed Santa Cruz, put Monterey completely within the district, and stretched a little further into Santa Barbara

Demographics: 55.1% White, 33.9% Hispanic

2008 President: Obama 57.0%, McCain 41.0% (LEAN DEM: D+4)

SD-16: Western Central Valley (Michael Rubio)

Description: Did some tweaking to keep it sufficiently Hispanic to satisfy the VRA

Demographics: 60.1% Hispanic, 24.6% White, 5.9% Asian, 5.8% Black

2008 President: Obama 55.6%, McCain 42.8% (TOSS-UP: D+2.5)

SD-17: Inyo County, Tulare, Bakersfield (Previously SD-18) (Jean Fuller)

Demographics: 57.0% White, 32.1% Hispanic

2008 President: McCain 60.8%, Obama 37.4% (SAFE GOP: R+15)

SD-18: Remainder of Santa Barbara and most of Ventura (Previously SD-19) (Tony Strickland)

Description: This time I was able to keep Thousand Oaks and Simi Valley in the same district and not go over in population

Demographics: 58.5% White, 31.0% Hispanic, 5.5% Asian

2008 President: Obama 59.3%, McCain 38.9% (LEAN DEM: D+6)

SD-19: Antelope Valley, keeping Lancaster and Palmdale together (Previously SD-17) (Sharon Runner)

Demographics: 54.1% White, 27.2% Hispanic, 8.2% Asian, 6.8% Black

2008 President: Obama 53.3%, McCain 44.6% (TOSS-UP: EVEN)

Los Angeles/Orange County

Photobucket

SD-20: Hispanic side of the San Fernando Valley (Alex Padilla)

Demographics: 54.2% Hispanic, 30.4% White, 6.9% Asian

2008 President: Obama 73.2%, McCain 24.7% (SAFE DEM: D+20)

SD-21: Burbank, Glendale, Pasadena (Carol Liu)

Demographics: 37.2% White, 32.8% Hispanic, 20.0% Asian, 5.2% Black

2008 President: Obama 67.3%, McCain 30.6% (SAFE DEM: D+14)

SD-22: From Monterey Park to Diamond Bar (Kevin De Leon)

Demographics: 53.9% Hispanic, 26.0% Asian, 14.8% White

2008 President: Obama 64.9%, McCain 33.2% (SAFE DEM: D+12)

SD-23: West Side L.A. without the Ventura portion (Fran Pavley)

Demographics: 70.4% White, 13.0% Hispanic, 9.4% Asian

2008 President: Obama 72.9%, McCain 25.4% (SAFE DEM: D+20)

SD-24: South Central: Culver City, Inglewood, Compton (Previously parts of SD-25 and 26) (Rod Wright) (Curren Price)

Description: Due to demographic trends, it looks like the black populations of the current SD-25 and 26 will be merged into this district, which means Curren Price and Rod Wright will likely be in the same district.

Demographics: 41.8% Hispanic, 41.7% Black, 7.9% White, 5.8% Asian

2008 President: Obama 89.7%, McCain 9.1% (SAFE DEM: D+37)

SD-25: South Central (Previously parts of SD-25 and 26)

Description: Here I took the Hispanic parts of the current SD-25 and 26. Either of Wright or Price may run here, but an Hispanic candidate is far and away the favorite here

Demographics: 61.4% Hispanic, 14.0% Black, 11.4% Asian, 10.4% White

2008 President: Obama 84.2%, McCain 13.8% (SAFE DEM: D+31)

SD-26: Downtown L.A., Whittier, Pico Rivera (Previously SD-24) (Probably Ed Hernandez)

Description: Hernandez’s home is in the new SD-22, though he may move and run here.

Demographics: 79.0% Hispanic, 11.4% White, 5.6% Asian

2008 President: Obama 73.1%, McCain 24.8% (SAFE DEM: D+20)

SD-27: Beach Cities, Carson, and Palos Verdes Peninsula (Previously SD-28) (Ted Lieu)

Demographics: 39.3% White, 31.7% Hispanic, 16.4% Asian, 8.9% Black

2008 President: Obama 62.0%, McCain 36.0% (LIKELY DEM: D+9)

SD-28: South Gate, Norwalk, Artesia, part of Long Beach (Previously parts of SD-27 and SD-30) (possibly Alan Lowenthal and Ron Calderon)

Description: I shifted Long Beach to the coastal OC district and found that I had too many people in that one, so I shifted part of Long Beach into this district. Part of Lowenthal’s and Calderon’s districts are put here, so they may face a primary unless one decides to retire.

Demographics: 55.7% Hispanic, 18.2% White, 12.3% Asian, 10.9% Black

2008 President: Obama 70.9%, McCain 27.0% (SAFE DEM: D+18)

SD-29: Northern L.A. suburbs (Previously parts of SD-29 and SD-31) (Bob Dutton and Bob Huff?)

Description: In L.A. and San Bern Counties to satisfy population size, from Arcadia to my hometown Rancho Cucamonga. Huff’s home in Diamond Bar was shifted to the 22nd so he may move here.

Demographics: 43.8% White, 34.3% Hispanic, 9.3% Asian, 8.9% Black

2008 President: Obama 54.2%, McCain 43.8% (TOSS-UP: D+1)

SD-30: Fontana, Ontario, Chino, Montclair, Pomona (Previously SD-32) (Gloria Negrete-McLeod)

Demographics: 55.7% Hispanic, 25.0% White, 9.9% Black, 6.2% Asian

2008 President: Obama 63.7%, McCain 34.5% (SAFE DEM: D+10)

SD-31: Most of San Bernardino and in Riverside (Open)

Demographics: 64.2% White, 23.9% Hispanic, 5.2% Black

2008 President: McCain 55.2%, Obama 42.6% (LIKELY GOP: R+9)

SD-32: Coastal Orange County and part of Long Beach (Previously SD-35 and part of SD-27) (Tom Harman and Alan Lowenthal?)

Demographics: 69.3% White, 13.5% Hispanic, 12.6% Asian

2008 President: Obama 49.5%, McCain 48.6% (LEAN GOP: R+4)

SD-33: Garden Grove, Anaheim, Santa Ana (Previously SD-34) (Lou Correa)

Demographics: 54.2% Hispanic, 23.5% White, 17.5% Asian

2008 President: Obama 54.6%, McCain 43.5% (TOSS-UP: D+1)

SD-34: Inland Orange County (Previously SD-33) (Mimi Walters)

Demographics: 53.7% White, 27.2% Hispanic, 13.9% Asian

2008 President: McCain 53.1%, Obama 45.0% (LIKELY GOP: R+7)

SD-35: Riverside, Norco, Moreno Valley, Corona (Previously part of SD-37) (Open)

Description: Rapid growth in Riverside County led to this district being excised off the eastern end of the old SD-37

Demographics: 43.0% White, 38.3% Hispanic, 9.2% Black, 5.6% Asian

2008 President: Obama 55.4%, McCain 42.7% (TOSS-UP: D+2)

Outer SoCal and San Diego

Photobucket

Photobucket

SD-36: Most of the rest of Riverside County (Previously SD-37) (Bill Emmerson)

Demographics: 53.7% White, 36.9% Hispanic

2008 President: McCain 49.6%, Obama 48.8% (LEAN GOP: R+3)

SD-37: Temecula, Southern OC, NW San Diego County to Carlsbad (Previously SD-36) (Joel Anderson?)

Demographics: 66.4% White, 21.4% Hispanic, 5.6% Asian

2008 President: McCain 53.5%, Obama 44.7% (LIKELY GOP: R+7)

SD-38: Imperial County and as much of Eastern San Diego as could fit (Previously SD-37 and SD-40) (Mark Wyland)

Demographics: 57.8% White, 31.2% Hispanic

2008 President: McCain 53.2%, Obama 45.1% (LIKELY GOP: R+7)

SD-39: Northern San Diego (Christine Kehoe)

Description: Northern half of San Diego, Solana Beach, Encinitas, Del Mar, Lemon Grove

Demographics: 63.2% White, 14.9% Hispanic, 13.7% Asian

2008 President: Obama 56.9%, McCain 41.4% (LEAN DEM: D+4)

SD-40: Southern San Diego (Previously part of SD-39) (Juan Vargas)

Description: Southern half of San Diego, Coronado, National City, Chula Vista, Imperial Beach

Demographics: 42.4% Hispanic, 32.5% White, 12.0% Asian, 9.4% Black

2008 President: Obama 66.3%, McCain 32.0% (SAFE DEM: D+13)

Wisconsin Senate: What was lost and what remains

With the Wisconsin Senate’s Democratic caucus in the news recently, I thought I would look at its composition and, since the chamber flipped in 2010, what the “lost” seats looked like geographically/demographically.

Wisconsin has 8 Congressional districts and 33 Senate districts, each of which contains 3 Assembly districts.  That works out to about 4 Senate districts per Congressional districts, and that’s how I’m going to loosely divide them up, although it will be rougher in places than others.

The Congressional districts: http://legis.wisconsin.gov/lts…

and the Senate districts:

http://legis.wisconsin.gov/lts…

Gwen Moore’s Milwaukee Congressional district corresponds to state Senate districts 3, 4, 6, and 7.  All are Democratic-held, although Ballotpedia points out that District 7’s Chris Larson was one of a small handful of candidates to beat an incumbent state Senator in a primary.  (District 7 snakes around covering coastal Milwaukee).  A number of Assembly districts in these Senate districts are actually Republican-held, and some seem to be suburban, but I’m going to look at that in another diary.

Jim Sensenbrenner’s affluent suburban Milwaukee district can correspond to state Senate districts 5, 8, 33, and 20 (as well as some of 13).  All are Republican-held, and District 5 flipped in 2010.  From its appearance I guessed that it was a classic ritzy inner-ring suburban district, and so it appears to be (although one of its assembly districts is actually in Milwaukee proper).  Check out the median income map: http://legis.wisconsin.gov/lrb…

Paul Ryan’s district in the southeast corner of the state can correspond to districts 11, 21, 22, and 28 (as well as some of 15).  All are Republican-held except for District 22, more or less coterminous with Kenosha County.  According to Wiki, it’s actually considered part of the Chicago metro area.  District 21, right above it, flipped in 2010.  It also appears affluent, although less so than District 22.

Tammy Baldwin’s Madison-area district can correspond to districts 15, 16, 26, and 27 (as well as some of 13 and 14).  All are Democratic-held.  Interesting note: District 26, covering Madison proper, is represented by Fred Risser.  As per Ballotpedia, he is the longest-serving state legislator in the United States, having first been elected in 1963.

The northern, Green Bay-ish district formerly represented by Steve Kagen and now by Reid Riggle can correspond loosely to districts 1, 2, 30, and 12 (it also has some of 14, at least).  30 and 12 are Democratic (30 seems to correspond to the city of Green Bay, while 12 is very large and rural) while 1 and 2 are Republican–perhaps why it is such a swingy district.  

Tom Petri’s district stretches, presumably, between the Milwaukee and Madison suburbs.  It is the hardest to fit into Senate districts, covering parts of 9, 13, 14, 18, 19, and 20.  Anyway, all are Republican, and none flipped in 2010.

Ron Kind represents a district with a reputation for a rare combination of ruralness and Democratic-friendlishness.  I’m going to call it more or less Districts 17, 23, 31, and 32, it also has part of 10.  Districts 31 is held by a Democrat, and Districts 10, 17, 23, and 32 by Republicans.  Doesn’t make Kind’s district look like very friendly territory, but then District 23 just flipped in 2010.  It contains some of Eau Claire, but I can’t tell too much interesting about it.  I would be interested to know what explains the state/fed difference here.

Finally, Dave Obey’s old district, now represented by Sean Duffy, covers Districts 24, 25, and 29, as well as the rest of District 10 and some of Districts 23 and 12.  This Congressional district, of course, flipped in 2010, and so did one of its parts, Senate District 29 (and 23).  District 29 contains some wealthy areas, amusingly, they seem to correspond to the village of Rothschild(!).  Districts 24 and 25 remain in the D fold; District 24 is represented by unsuccessful 2010 Congressional nominee Julie Lassa.

In short, the Wisconsin Senate Dem caucus seems to unsurprisingly mirror its Congressional delegation.  Of its 14 seats, 8 more or less line up with the Milwaukee and Madison areas represented by Moore and Baldwin.  Of the remaining 6, one is in Chicagoland, one covers Green Bay, one includes much of Eau Claire, and the remaining three include two large, Canada-bordering rural districts and Lassa’s 24th.  Of note, only odd-numbered seats were up in 2010, so it is possible that 12 and 24, two of these last three, got spared by chance  while the adjacent 23 and 29 flipped.

Anyway, I am always wondering where state-level Dems are, so I thought I would summarize it up for y’all.  I welcome corrections and comments from more Wi-knowledgeable readers.

New York State Senate Redistricting: 43-19

After only two years of a slim 32-30 Democratic majority in the New York State Senate, Republicans in this past election barely took back the chamber that they had previously held continuously for more than forty years. People around the country endlessly ask the question: how is it possible that Republicans have a majority of state senators in a state as “blue” as New York?

There is no simple answer to that question. Sufficed it to say, one of the most important factors is gerrymandering. Republicans did a masterful job of redistricting a very favorable map for themselves ten years ago. The current map is littered with Republican senators holding light blue Obama districts all over Long Island (9-0 Republican) and Upstate (21-4). With the great help of Daves Redistricting App 2.0, I set about in the task of redistricting New York's State Senate districts with three main goals in mind: 1.) connect Democratic towns and cities in Long Island, 2.) preserve majority-minority districts in New York City, and 3.) consolidate small cities Upstate. Much of the basis for my analysis comes from jeffmd's excellent post on the State Senate written in 2009 in which he looked at the numbers for the current districts. Inspecting the presidential toplines, it was determined that the cutoff between Republican and Democratic districts is about 58-60% Obama. My map uses that percentage as the benchmark. It would create 10 Democratic districts at over 58% in Upstate New York and another four at over 62% in Long Island. Combined with New York City, this would be more than enough to give Democrats a two-to-one majority in the State Senate. So without further ado, here is what I came up with:

New York 


District Pop. Center Pop. Wh% Bl% Asn% Hisp% Oth%
O% M%
D 1 Hamptons 318633 66 11 3 17 2
62 38
R 2 Brookhaven 318569 89 2 2 6 1
49 51
R 3 Lindenhurst 318229 89 2 1 6 1
47 53
D 4 Huntington 318189 60 17 3 18 2
63 36
R 5 Smithtown 318668 91 1 3 4 1
46 54
R 6 Massapequa 318525 90 0 3 5 1
44 56
D 7 Great Neck 318243 67 12 8 11 2
64 35
D 8 Hempstead 318681 51 26 3 18 2
69 31
R 9 Garden City 318620 86 1 5 7 1
43 56
D 10 Jamaica 317030 9 55 9 15 12 Black Majority 92 8
D 11 Bayside 317619 60 5 18 13 3
62 37
D 12 Astoria 315924 42 5 13 34 5
78 21
D 13 East Elmhurst 318053 15 9 16 57 3 Hispanic Majority 81 18
D 14 St. Albans 318613 22 55 4 13 5 Black Majority 82 17
D 15 Forest Hills 316488 59 5 15 17 5
63 36
D 16 Flushing 317432 24 3 48 21 4 Asian Plurality 68 31
D 17 Bushwick 317715 13 13 7 60 6 Hispanic Majority 87 12
D 18 Bedford-Stuyvesant 317273 26 51 2 17 4 Black Majority 90 9
D 19 Canarsie 317538 28 52 3 14 3 Black Majority 83 17
D 20 Brooklyn Heights 318797 25 51 3 18 3 Black Majority 93 6
D 21 Prospect 318898 19 51 5 22 3 Black Majority 92 7
D 22 East Flatbush 317890 21 56 6 12 5 Black Majority 85 14
R 23 Homecrest 316816 81 1 11 6 2
33 67
D 24 Brighton Beach 317711 56 6 21 13 3
55 44
D 25 North Shore 318201 49 13 10 24 4
66 34
R 26 Arden Heights 323582 84 1 6 7 1
37 62
D 27 East Village 311559 45 6 27 19 3
84 15
D 28 Upper East Side 309905 83 3 8 5 2
75 24
D 29 Upper West Side 310495 73 5 8 11 2
85 14
D 30 Spanish Harlem 309111 22 23 3 50 2 Hispanic Majority 91 8
D 31 Bedford Park 308720 12 19 5 61 3 Hispanic Majority 90 9
D 32 Harlem 309836 2 61 1 33 2 Black Majority 97 2
D 33 Washington Heights 309056 22 12 4 60 2 Hispanic Majority 90 9
D 34 Soundview 309592 10 28 3 55 3 Hispanic Majority 90 10
D 35 Belmont 308704 21 21 3 53 2 Hispanic Majority 84 16
D 36 Mount Vernon 309493 14 60 2 20 4 Black Majority 92 8
D 37 Harrison 309361 73 7 5 13 2
61 38
D 38 Yonkers 309287 56 14 5 21 3
64 35
D 39 Ossining 309454 76 7 3 13 1
59 40
D 40 Clarkstown 317946 72 10 5 10 2
53 47
R 41 Carmel 321768 88 3 2 6 1
46 53
D 42 Poughkeepsie 317728 71 12 2 13 2
58 41
D 43 Kingston 320216 85 6 1 6 2
60 38
D 44 Troy 317388 86 6 3 3 2
58 40
D 45 Plattsburgh 317612 94 2 1 2 2
58 40
D 46 Albany 315314 84 9 2 3 1
63 35
R 47 Moreau 317511 96 1 1 1 1
49 49
R 48 Rome 317470 91 4 1 3 1
44 54
D 49 Syracuse 317634 80 12 2 3 3
62 36
R 50 Utica 317412 91 4 1 2 1
54 45
R 51 Herkimer 316544 96 1 0 2 1
45 53
R 52 Blooming Grove 319845 90 3 1 4 1
46 52
D 53 Ithaca 318178 87 4 3 3 2
61 38
R 54 Penn Yan 317011 95 2 0 2 2
47 51
R 55 Perinton 316789 92 3 3 2 1
51 47
D 56 Rochester 318289 60 26 3 9 2
72 27
R 57 Corning 317311 95 1 1 1 2
42 56
D 58 Amherst 317906 80 14 2 2 1
61 38
R 59 Hamburg 318084 94 1 1 2 2
49 49
D 60 Buffalo 317816 67 23 1 6 3
69 29
R 61 Batavia 318545 94 2 0 2 1
41 57
R 62 Greece 318537 93 3 1 2 1
46 52

Note, also, that I broke the state into four regions for simplicity: Upstate, Westchester/Bronx/Manhattan, Brooklyn/Queens/Staten Island, and Long Island. Here is another table that breaks down the numbers by region:

Region County Population Districts (+/-) 316280 (+/-)
Long Island Suffolk 1516544


Nassau 1349555


2866099 9 0 318323 0.6
New York City Queens 2320449


Brooklyn 2588844


Staten Island 496246


5405539 17 1 317972 0.5

Manhattan 1646675


Bronx 1415056


Westchester 961565


4023296 13 1 309484 -2.1
Ustate New York Rockland 301308


Other 7010169


7311477 23 -2 317890 0.5

As you can see from the table, I redraw the map so that NYC gained two seats at the expense of Upstate New York, while Long Island remained the same at 9 districts. The population of each district in each region is very equal with the greatest deviation of -2.1% below the ideal population in the region of Westchester/Bronx/Manhattan. The rest of the seats compensate for this by being about .5% above the ideal. Before discussing the statewide changes that would occur under this redistricting plan, first let me go through the four regions themselves…

Long Island


District Pop. Center Pop. Wh% Bl% Asn% Hisp% Oth% O% M%

D 1 Hamptons 318633 66 11 3 17 2 62 38

R 2 Brookhaven 318569 89 2 2 6 1 49 51 Ken LaValle-1, Port Jefferson
R 3 Lindenhurst 318229 89 2 1 6 1 47 53 Lee Zeldin-3, Shirley Owen Johnson-4, West Babylon
D 4 Huntington 318189 60 17 3 18 2 63 36

R 5 Smithtown 318668 91 1 3 4 1 46 54 John Flanagan-2, East Northport Carl Marcellino-5, Syosset
R 6 Massapequa 318525 90 0 3 5 1 44 56

D 7 Great Neck 318243 67 12 8 11 2 64 35

D 8 Hempstead 318681 51 26 3 18 2 69 31 Charles Fuschillo-8, Merrick Dean Skelos-9, Rockville Centre
R 9 Garden City 318620 86 1 5 7 1 43 56 Kemp Hannon-6, Garden City Jack Martins-7, Mineola

(The table above is a portion derived from the table in the intoduction. However, included in this table and the three that are to follow it, the number for each district has a link to a picture of that district's new boundaries. Also, I included the incumbent senators in whichever district that they would live in if my map went into affect. Each senator's party is denoted by the font color, and the data entries include the number district that each senator currently represents in the State Senate, as well as where they live and a link to their official biographies.)

Long Island has been the province of Republicans in the New York State Senate for many decades. At the height of the Democratic wave in 2008, Long Island elected only two Democratic senators out of nine total. Both of them lost their seats in this last election, returning Long Island to its usual position of having only Republicans represent them in the State Senate. It's not as though Long Island is that conservative overall — indeed, all but one of the current nine senate districts in Nassau and Suffolk Counties was won by Obama. Republicans have been very effective in diluting Democratic votes, thereby allowing many independents who fear a complete Democratically-controlled Albany to elect Republican candidates for the State Senate.

Of the eight Obama-voting Long Island Senate districts, none of them were won by more than about 55%, which is a very managable percentage for incumbent GOP senators, including the new Majority Leader Dean Skelos, who hails from Rockville Centre in Nassau County. In this region, the goal was to be realistic about what could be achieved and very cautious in achieving it. I drew up four Democratic districts each at over 62% for Obama.

Three out of the four new Democratic districts that I created are left open for any Dem who wants them. The most Democratic district in the region — SD-8, based in Hempstead and Long Beach — is occupied by Skelos and Senator Charles Fuschillo. As the Black and Hispanic populations are spread throughout Long Island, each district retains their white majority.


Queens, Brooklyn, and Staten Island


District Pop. Center Pop. Wh% Bl% Asn% Hisp% Oth%
O% M%


D 10 Jamaica 317030 9 55 9 15 12 Black Majority 92 8 Shirley Huntley-10, Jamaica

D 11 Bayside 317619 60 5 18 13 3
62 37 Tony Avella-11, Whitestone

D 12 Astoria 315924 42 5 13 34 5
78 21 Michael Gianaris-12, Astoria

D 13 East Elmhurst 318053 15 9 16 57 3 Hispanic Majority 81 18

Jose Peralta-13, East Elmhurst


D 14 St. Albans 318613 22 55 4 13 5 Black Majority 82 17 Malcolm Smith-14, St. Albans

D 15 Forest Hills 316488 59 5 15 17 5
63 36


D 16 Flushing 317432 24 3 48 21 4 Asian Plurality 68 31 Toby Ann Stavisky-16, Flushing

D 17 Bushwick 317715 13 13 7 60 6 Hispanic Majority 87 12 Joseph Addabbo-15, Ozone Park Martin Malave Dilan-17, Bushwick
D 18 Bedford-Stuyvesant 317273 26 51 2 17 4 Black Majority 90 9


D 19 Canarsie 317538 28 52 3 14 3 Black Majority 83 17 John Sampson-19, Canarsie

D 20 Brooklyn Heights 318797 25 51 3 18 3 Black Majority 93 6 Valmanette Montgomery-18, Boerum Hills Eric Adams-20, Crown Heights Daniel Squadron-25, Brooklyn Heights
D 21 Prospect 318898 19 51 5 22 3 Black Majority 92 7 Kevin Parker-21, Flatbush

D 22 East Flatbush 317890 21 56 6 12 5 Black Majority 85 14


R 23 Homecrest 316816 81 1 11 6 2
33 67 Martin Golden-22, Bay Ridge

D 24 Brighton Beach 317711 56 6 21 13 3
55 44 Carl Kruger-27, Sheepshead Bay

D 25 North Shore 318201 49 13 10 24 4
66 34 Diane Savino-23, Staten Island

R 26 Arden Heights 323582 84 1 6 7 1
37 62 Andrew Lanza-24, Great Kills

While much of Staten Island remains a stubborn Republican bulwark, Queens and Brooklyn voted overwhelmingly for Barack Obama in 2008. They are home to most of New York City's black population, as well as significant Hispanic and Asian communities. Since this area of the state is so heavily Democratic, the overriding goal for this region was not to squeeze out more Democratic seats, but to strengthen a few shaky ones and create new Voting Rights Act (VRA) districts wherever possible. Under my plan, this region would gain one additional seat as a result of new population estimates given by the Census Bureau. 

This map preserves the two African-American majority districts in Queens and adds a fifth black majority district to the four that already exist in Brooklyn. One of the best things about this map is that it creates an Asian plurality district that is based in Flushing and spread throughout many parts of Queens. The 16th district is currently represented by Sen. Toby Ann Stavisky, but if the Asian community were able to unite around a consensus candidate, she could well be displaced in a primary. I found it impossible to make the 16th District any more heavily Asian than 48%, but the next largest racial community was 24% of the population, so if Stavisky were to retire, this would most likely go to an Asian candidate. It also preserves the two Hispanic majority districts in Queens and Brooklyn.

The recently-flipped 11th and 15th Districts would be strengthened for the Democrats. Carl Kruger's 27th district in southern Brooklyn would be radically changed into the 24th district, both strengthening our vote there and also allowing for a primary challenge to the less-than-venerable “Amigo.” At 55% for Obama, the 24th is one of two districts that I created below the magic 58% line that I still counted in the Democratic column — largely because presidential voting patterns in southern Brooklyn are volatile and not necessarily indicative of a broader ideological differentiation. What Republican-leaning communities that do exist here would be consolidated into two large McCain majority districts: the 23rd in southern Brooklyn and the 26th in southern Staten Island, both of which are currently represented by Republican Senators anyway.


Manhattan, Bronx, and Westchester County


District Pop. Center Pop. Wh% Bl% Asn% Hisp% Oth%
O% M%

D 27 East Village 311559 45 6 27 19 3
84 15

D 28 Upper East Side 309905 83 3 8 5 2
75 24 Liz Krueger-26, Upper East Side
D 29 Upper West Side 310495 73 5 8 11 2
85 14 Thomas Duane-29, Upper West Side
D 30 Spanish Harlem 309111 22 23 3 50 2 Hispanic Majority 91 8 Jose Serrano-28, Spanish Harlem
D 31 Bedford Park 308720 12 19 5 61 3 Hispanic Majority 90 9 Gustavo Rivera-33, Kingsbridge Heights
D 32 Harlem 309836 2 61 1 33 2 Black Majority 97 2 Bill Perkins-30, Harlem
D 33 Washington Heights 309056 22 12 4 60 2 Hispanic Majority 90 9 Adriano Espaillat-31, Washington Heights
D 34 Soundview 309592 10 28 3 55 3 Hispanic Majority 90 10 Ruben Diaz-32, Soundview Jeffrey Klein-34, Throgs Neck
D 35 Belmont 308704 21 21 3 53 2 Hispanic Majority 84 16

D 36 Mount Vernon 309493 14 60 2 20 4 Black Majority 92 8 Ruth Hassel-Thompson-36, Williamsbridge
D 37 Scarsdale 309361 73 7 5 13 2
61 38 Suzi Oppenheimer-37, Mamaroneck
D 38 Yonkers 309287 56 14 5 21 3
64 35 Andrea Stewart-Cousins-35, Yonkers
D 39 Ossining 309454 76 7 3 13 1
59 40

This region, encompassing Manhattan, Bronx, and Westchester County, is the most strongly Democratic area in one of the most Democratic-leaning states in the Union. It is home to the largest Hispanic communities in the Northeast United States — mostly Peurto Rican, but also Dominican, Mexican, and other Latin American heritages. The white communities here also tend to be much more liberal than their counterparts in Brooklyn, Queens, and Staten Island. That is especially the case in Manhattan and Westchester, which are home to many educated urban white professionals.

All twelve districts here are represented by Democrats in the State Senate. That would stay the same under my plan, except for the addition of a thirteenth Democratic district. This is the second distric that comes at the expense of Upstate New York — the other one being in Brooklyn.

Both majority African-American districts would remain intact. The map also adds another Hispanic-majority district to the four that currently exist.

Upstate New York


District Pop. Center Pop. Wh% Bl% Asn% Hisp% Oth% O% M%

D 40 Clarkstown 317946 72 10 5 10 2 53 47 David Carlucci-38, Clarkstown
R 41 Carmel 321768 88 3 2 6 1 46 53 Greg Ball-40, Patterson

D 42 Poughkeepsie 317728 71 12 2 13 2 58 41 Bill Larkin-39, New Windsor Stephen Saland-41, Poughkeepsie
D 43 Kingston 320216 85 6 1 6 2 60 38

D 44 Troy 317388 86 6 3 3 2 58 40 Hugh Farley-44, Schenectady
D 45 Plattsburgh 317612 94 2 1 2 2 58 40 Betty Little-45, Queensbury Patty Ritchie-48, Heuvelton
D 46 Albany 315314 84 9 2 3 1 63 35 Neil Breslin-46, Albany James Seward-51, Milford
R 47 Moreau 317511 96 1 1 1 1 49 49 Roy McDonald-43, Stillwater
R 48 Rome 317470 91 4 1 3 1 44 54 Joseph Griffo-47, Rome
D 49 Syracuse 317634 80 12 2 3 3 62 36 David Valesky-49, Oneida John DeFrancisco-50, Syracuse
R 50 Utica 317412 91 4 1 2 1 54 45

R 51 Herkimer 316544 96 1 0 2 1 45 53

R 52 Blooming Grove 319845 90 3 1 4 1 46 52 John Bonacic-42, Mount Hope
D 53 Ithaca 318178 87 4 3 3 2 61 38 Thomas Libous-52, Binghamton Michael Nozzollio-54, Fayette
R 54 Sodus 317011 95 2 0 2 2 47 51

R 55 Perinton 316789 92 3 3 2 1 51 47 James Alesi-55, East Rochester
D 56 Rochester 318289 60 26 3 9 2 72 27

R 57 Corning 317311 95 1 1 1 2 42 56 Thomas O'Mara-53, Big Flats Catharine Young-57, Olean
D 58 Amherst 317906 80 14 2 2 1 61 38 Tim Kennedy-58, Buffalo
R 59 Hamburg 318084 94 1 1 2 2 49 49 Pat Gallivan-59, Elma Mike Ranzenhofer-61, Clarence
D 60 Buffalo 317816 67 23 1 6 3 69 29 Mark Grisanti-60, Buffalo
R 61 Batavia 318545 94 2 0 2 1 41 57

R 62 Greece 318537 93 3 1 2 1 46 52 Joe Robach-56, Greece George Maziarz-62, Newfane

Here more than anywhere else in the state, Republicans dominate in local and state politics. Recently, Democrats lost five of their ten Upstate congressional districts. This is also where Republicans picked up two Senate seats and gained about a half-dozen Assembly seats last fall. Nevertheless, there are still many strongly Democratic areas of Upstate New York: mostly medium- and small-sized cities and liberal inner-suburbs that dot the landscape from the Hudson Valley to the Great Lakes. The goal was to consolidate those areas and churn out as many new Democratic districts as possible. Here again, as in Long Island, the minority ethnic populations are too spread out to create any VRA districts. Instead, this is where the great bulk of Republican Senate seats would hit the buzz-saw.

The region as a whole would lose two seats, mostly from the equalization of populations in each Senate district — which Republicans largely disregarded during the last redistricting ten years ago — as well as the much greater population growth downstate.

I was able to get about half of these 23 districts in the Democratic column. The 40th District, based in Rockland County, is the second of only two districts in this entire map (the other being in southern Brooklyn) that I counted as a Democratic district even though Obama's vote there was less than 58%. The reason is that this seat was one of very few elected offices around the country that Democrats actually gained from the Republicans in this last election. The seat would also bolster its Democratic vote through redistricting, so I figured, if David Carlucci could pick it up for the Dems in a year like 2010, odds are pretty good that he'll be able to hold it in a lot of other political environments.

I was able to get ten of these districts at over 58% for Obama. One of the most certain Democratic gains under this plan would be my native 56th Senate District, based in the City of Rochester and the Town of Brighton. Republican Senator Joe Robach has vexingly been able to hold onto this district for years despite the fact that it voted by a two-to-one margin for Barack Obama in 2008 (66%-33%). Under this plan, Robach's hometown of Greece would be removed from the 56th and replaced by the Democratic-leaning suburbs of Gates and Irondequoit.

The four seats that we do hold here would be strengthened. The 60th District, which is even more Democratic district than the 56th, voted out a Democratic incumbent last fall. This district would remain largely unchanged in the hope that a different Dem might likely be able to win it back from freshman Republican Senator Mark Grisanti.

As is convention when State Senate seats are redistricted in Upstate New York, I left every town intact. In addition, only two cities are divided between different districts: Buffalo and Tonawanda (just south of Niagra Falls). The self-imposed requirement that towns be left undivided was a major constraint, but it would probably help a plan like this to survive a court challenge.


Summary:

A major drawback of this map is that without realizing it, I redraw the lines with no attention paid to which district each senator lives in. Hence, a lot of Democratic primaries and games of musical chairs would happen in this plan that might otherwise have been avoided. But, by the time I realized it, it was too late. In any event, many more Republicans get stuck together than Democrats, so that serves to counter-balance this problem.

This map pays tribute to the Voting Rights Act by creating three new majority-minority district: a new Black-majority district in Brooklyn, an Asian-plurality district in Queens, and a fifth Hispanic-majority district in the Bronx.

My plan also evens out the population disparities between regions by making every seat within only a few thousands residents off from the ideal population of 316,280 people per district. In applying a fairer division among the state's population and using new population estimates given by the Census, Upstate New York lost two districts to New York City.

I am confident that if this plan went into affect at the next election, Democrats would hold a large 43-19 majority in the New York State Senate for many years to come. But alas, Republicans won back this chamber last year and thus, it is not to be. However, I'm still convinced that with new population estimates, it will be extremely difficult for Republicans to redistrict another map that would allow them to retain the majority. Their luck has simply run out. They may be able to preserve many incumbents in Upstate and Long Island, but remember that Democrats only need to gain one seat for them to retake the majority (a 31-31 tie would allow Democratic Lt. Gov. Bob Duffy to act as the tie-breaker). And as I've shown through this analysis, downstate will have to gain two seats for the next redistricting plan to be in compliance with the Census.

It took many practice tries, but I believe this map provides the strongest possible plan for a large Democratic majority in the Senate that not only respects existing VRA districts, but also creates three new ones. In short, this is the ideal Democratic redistricting plan for the New York State Senate.

NY St. Senate Fair Redistricting: Let the Court Draw It

During the last redistricting, the Democrats and the Republicans allowed for a split redistricting plan: Dems redraw the Assembly, the GOP drew the Senate, and they both drew the House map. Now, with split control again, I think it would be best to allow the Courts to draw the redistricting map, even if it means Dems lose about twenty Assembly seats–Dems already control about 70% of the vote share!

So, I tried to draw the map as if I were the courts. Sorry if my naming of colors throws you off.

My plan is a fair plan:

I make as many minority-majority seats as I think would be necessary;

No district is designed specifically for any current senator;

County splitting is avoided as much as possible;

Almost all towns are kept together: no joke, there is not a single town outside of Nassau and Suffolk that is split. In Suffolk, Islip is too big, so three precincts are moved to NY-02. In Nassau, some hamlets might be split, but I’m pretty sure there aren’t that many that are;

In the City, I tired to respect racial groups;

Upstate, I tried to keep regions together.

To that end, Democrats would surely take the State Senate under this map. I’ve classified everything from R+1 to D+3 as a swing district. If you give Republicans all swing districts, they’ll only muster 25 seats. Kudos to the 2000 GOP, they made one heckuva map. Can you imagine if Dems made a Senate map? They could easily make 45 seats, but that’s a different story.

Here’s my map:

Photobucket

Photobucket

NY-1 D+1 Blue

South Hampton, Part of Brookhaven

NY-2 R+0 Green

Part of Brookhaven, Three Precincts of Islip

NY-3 D+1 Purple

Rest of Islip

NY-4 R+4 Red

Huntington, Smithtown

NY-5 R+2 Yellow

Babylon, Part of Oyster Bay

NY-6 D+2 Teal

Part of Hempstead

NY-7 D+2 Gray

Part of Hempstead

NY-8 D+3 Bluish Purple

Part of Hempstead, Part of North Hempstead

NY-9 D+1 Turquoise

Part of North Hempstead, Part of Oyster Bay

Photobucket

NY-10 D+14 Pink

Queens

NY-11 D+18 Light Green

Queens

NY-12 D+27 Light Blue

Queens

NY-13 D+27 Beige

Queens

NY-14 D+10 Mustard Green

Queens

NY-15 D+40 Dark Blue

Queens

NY-16 D+27 Orange

Queen, Brooklyn

NY-17 D+44 Lighter Green

Brooklyn

NY-18 R+5 Yellow

Brooklyn

NY-19 D+44 Green

Brooklyn

NY-20 D+42 Light Pink

Brooklyn

NY-21 D+39 Velvet Red

Brooklyn

NY-22 D+28 Brown

Brooklyn

NY-23 R+4 Darker Turquoise

Brooklyn

NY-24 D+12 Dark Purple

Brooklyn, Staten Island

NY-25 R+15 Pinkish Red

Staten Island

NY-26 D+41 Dark Gray

The Bronx

NY-27 D+31 Green

Brooklyn, Manhattan

NY-28 D+31 Dark Pink

Manhattan

NY-29 D+33 Green Gray

Manhattan

NY-30 D+23 Orange Red

Manhattan

NY-31 D+43 Yellow

Manhattan

NY-32 D+39 Red

Manhattan

NY-33 D+43 Blue

The Bronx

NY-34 D+25 Green

The Bronx, Queens

NY-35 D+32 Purple

The Bronx

Photobucket

NY-36 D+37 Orange

The Bronx, Mount Vernon

NY-37 D+9 Blue

Yonkers, New Rochelle

NY-38 D+11 Turquoise

White Plains, Rye

NY-39 D+5 Yellow

Peekskill, Clarkstown

NY-40 R+3 Red

Ramapo, Orangetown

NY-41 EVEN Gray

Middletown, Newburgh

NY-42 R+2 Light Green

Poughkeepsie, Beacon

Photobucket

NY-43 D+6 Pink

Kingston, Hudson

NY-44 D+9 Reddish

Syracuse

NY-45 D+9 Blue

Ithaca, Auburn, Cortland

NY-46 R+6 Prange

Elmira

NY-47 R+6 Light Pink

Rome, Utica, Oneida

NY-48 R+6 Orange

Watertown, Oswego

NY-49 R+1 Red

Binghamton, Vestal, Oneonta

NY-50 R+6 Gray Blue

Gloversville, Amsterdam

NY-51 D+5 Brown

Schenectady, Troy

NY-52 D+8 Dark Green

Albany, Rensselaer

NY-53 D+5 Gray

Plattsburg, Potsdam, Ogdensburg

NY-54 R+2 Light Beige

Saratoga Springs, Glens Falls

NY-55 D+4 Dark Beige

Part of Rochester, Perinton, Geneva

NY-56 D+12 Blue

Rest of Rochester

NY-57 R+11 Green

Olean, Corning

NY-58 R+5 Purple

Jamestown, Dunkirk, Pomfret, Orchard Park

NY-59 D+15 Red

Part of Buffalo, Lackawanna

NY-60 D+8 Yellow

Part of Buffalo, Niagara Falls, Tonawanda, North Tonawanda

NY-61 R+5 Turquoise

Amherst, Lockport

NY-62 R+8 Gray

Greece

Photobucket

Redistricting the New Jersey State Senate

New Jersey has 40 State Legislative districts. Each district elects 1 Senator and 2 Assemblymen. The State Legislature will be up for election in November 2011, so NJ will need to have its districts ready a year earlier than most other states. Currently the State Senate has 24 Democrats and 16 Republicans. Wikipedia has an excellent map of the State Senate makeup here. (The 14th just turned blue in a special election.) The districts are drawn by a bipartisan commission made of 5 Democrats and 5 Republicans appointed by their respective parties. Some Republicans including Governor Christie claim the current map is an unfair gerrymander favoring the Democrats. I disagree.

New Jersey has 8.7 million people (2007 estimate). Each of the 40 Senate Districts must be within 20% (43,413) of the ideal population (217,067). Municipalities can not be split unless they are more than 1/40 of the entire state’s population. Only 2 cities are that big: Newark and Jersey City. The restriction on splitting municipalities makes the 20% rule necessary.

I didn’t consider incumbents’ residency. I’ll let them figure out which district they want to run in, and if they get drawn out of a winnable district then too bad. I didn’t abuse the 20% rule to favor a political party. I tried to apply population discrepancy as fairly as possible.

The Democratic Gerrymander: 31 Democrats, 9 Republicans


1st District: Cape May Co, most of Cumberland Co. 53% Obama, +2998 people. 70% white

This is the weakest of the Democratic districts. It’s impossible to make a safe Democratic district with all of Cape May Co.

2nd District: eastern Atlantic Co. 59% Obama, -1908 people. 59% white

It got smaller (and more Democratic) due to population growth in the Atlantic City area.

3rd District: Deptfords to Bridgeton 57% Obama, +5596 people. 75% white

It’s a little bit sleeker and more Democratic.

4th District: interior Gloucester, Camden, Salem and Atlantic Co. 58% Obama, +6767 people. 75% white

Anchored by strongly Democratic towns such as Winslow and Monroe. The region between Camden and Atlantic City has grown enough to deserve its own district.

5th District: metro Camden 73% Obama, -3477 people. 51% white, 24% black, 21% Hispanic

6th District: Washington (Glo Co) to Evesham 59% Obama, +15839 people. 79% white

The outer townships are swingy, but the middle (Camden Co) part is strongly Democratic.

7th District: Pennsauken/Cherry Hill area 62% Obama, -254 people. 76% white

8th District: Delanco to Pemberton 67% Obama, -5403 people. 59% white, 27% black

Incumbent Republican Diane Allen lives here. This district should be too Democratic and too different for her to win.

9th District: southern Burlington and Ocean Co 42% Obama, +5336 people. 93% white

The biggest district on this map

10th District: Trenton, Hamilton, northern Burl Co 65% Obama, +2523 people. 54% white, 26% black, 16% Hispanic

Hamilton and Bordentown are Democratic at the presidential level but Republican the local level. Combining them with Trenton should stop them from causing trouble.

11th District: Toms River and western Ocean/Monmouth 42% Obama, +6048 people. 87% white

Almost all of the population is in the eastern part: Toms River and the shore towns.

12th District: Lakewood, Brick, Wall, and everything east 37% Obama, +15120 people. 84% white

Don’t let the small size fool you into thinking it’s urban and therefore liberal. It’s the most Republican district in NJ.

13th District: Tinton Falls and everything east except Rumson 57% Obama, -5642 people. 66% white

The Democrats’ best chance at winning part of Monmouth County. Frank Pallone lives here and you can appreciate why it’s hard to draw him into a Democratic congressional district.

14th District: Rumson/Middletown to Howell 42% Obama, -6983 people. 86% white

Republican Monmouth County in all its teabagging glory.

15th District: Old Bridge to Freehold 49% Obama, -587 people. 74% white

The Democrats’ second best chance at winning part of Monmouth County. I count it as a Republican district but maybe in a wave election it could be the Democrats’ 32nd district.

16th District: Robbinsville to East Brunswick 59% Obama, +23790 people. 66% white, 19% Asian

The current 14th but pushed further north.

17th District: Lawrence to Somerville to Frenchtown 62% Obama, +1033 people. 73% white

A Democratic district anchored in Princeton reaches into Hunterdon and Somerset Counties.

18th District: New Brunswick to Bridgewater 64% Obama, +10382 people. 48% white, 16% black, 13% Asian, 21% Hispanic

19th District: Edison to Middlesex Boro 62% Obama, +14589 people. 50% white, 29% Asian

20th District: Sayreville, South Amboy, Perth Amboy, Woodbridge 60% Obama, -9702 people. 47% white, 13% Asian, 30% Hispanic

Edison and Woodbridge are huge towns that each take up most of a Senate district so that limits where these districts can go. Sayreville and South Amboy are swingy but Woodbridge and especially Perth Amboy make it a strong Democratic district.

21st District: Warren Co and most of Hunterdon Co 42% Obama, +79 people. 87% white

1 of 4 Republican districts in the north

22nd District: southern Morris Co and northern Somerset Co 43% Obama, +5683 people. 82% white

23rd District: Plainfield to Morristown 60% Obama, -827 people. 55% white, 20% black, 19% Hispanic

1 of 2 Democratic districts that reaches into Morris Co.

24th District: Carteret to Summit 60% Obama, -4165 people. 64% white, 16% black, 14% Hispanic

This is Tom Kean Jr’s district and it’s probably too Democratic for him to win it. This map is meant to shut Republicans out of Union County.

25th District: Elizabeth, Roselle Park, Union Twp, Kenilworth 68% Obama, -9436 people. 35% white, 17% black, 43% Hispanic

26th District: West Orange to Parsippany 54% Obama, -24058 people. 71% white, 15% Asian

This is the second weakest of the Democratic districts. I hope the Democrats have the balls to go for it. This underpopulated district is balanced out by the 16th, a similar affluent suburban district that’s overpopulated.

27th District: Fairfield to Nutley 58% Obama, -10336 people. 69% white

Northern Essex county makes a clean compact district. This is the kind of district Republicans would have to win to take the State Senate under this map.

28th District: Hillside to East Orange 92% Obama, -1160 people. 70% black

Sure I could break this up and strengthen nearby suburban Democrats but that wouldn’t be fair to black voters. Even though there isn’t a VRA at the state level.

29th District: Newark except the East Ward 94% Obama, +9081 people. 58% black, 33% Hispanic

The East Ward is the part that’s most different from the rest of Newark.

30th District: Newark’s East Ward, Harrison, Kearny, northwest Jersey City 74% Obama, +7567 people. 37% white, 10% black, 15% Asian, 36% Hispanic

31st District: Bayonne, most of Jersey City, Hoboken 76% Obama, -5099 people. 43% white, 23% black, 11% Asian, 21% Hispanic

The part of New Jersey that’s facing Manhattan.

32nd District: northern Hudson Co 70% Obama, -9167 people. 26% white, 66% Hispanic

This is one of the densest places in America.

33rd District: Passaic to Prospect Park 61% Obama, -21711 people. 48% white, 39% Hispanic

34th District: Paterson to Wayne 68% Obama, +15509 people. 36% white, 19% black, 40% Hispanic

The 2 lower Passaic Co districts balance each other out in population and spread Democratic strength as evenly as possible.

35th District: North Arlington to Edgewater 55% Obama, -10610 people. 61% white, 16% Asian, 20% Hispanic

36th District: Hackensack to Wyckoff 57% Obama, +4722 people. 65% white, 19% Hispanic

37th District: Teaneck to Hillsdale 55% Obama, -6373 people. 63% white, 15% Asian, 13% Hispanic

38th District: Fort Lee to Upper Saddle River 55% Obama, -19114 people. 61% white, 21% Asian, 11% Hispanic

Democratic strength is spread evenly over 4 Bergen County districts. There is an incumbent Republican in one of these districts, Gerry Cardinale, who won’t go down without a fight. Sure it might be smarter to make Bergen Co 3-1, but 4-0 can be done if you accept the risk.

39th District: northern Morris and southeast Sussex 44% Obama, -436 people. 78% white

40th District: Sussex Co, upper Passaic Co, far west Bergen Co 42% Obama, +3767 people. 88% white

The Republican Gerrymander: 21 Republicans, 19 Democrats


1st District: Cape May Co, most of Cumberland Co, southern Atlantic Co. 49% Obama, -9122 people. 77% white

There is only so much you can do with a Cape May-Cumberland based district.

2nd District: Atlantic City to Millville 64% Obama, +15480 people. 49% white, 21% black, 24% Hispanic

A Democratic vote sink in southeast NJ.

3rd District: Salem Co, southern Gloucester Co 51% Obama, -11895 people. 84% white

2 Democratic districts grab Democratic pieces of Gloucester Co and this is what’s left. There are a lot of 51% Obama districts in this map and Republicans will have to hold all of them in order to control the State Senate.

4th District: Glassboro to Winslow to Gloucester Twp 65% Obama, +5349 people. 72% white

A Democratic vote sink in fast growing exurban Camden.

5th District: Paulsboro to Cherry Hill 73% Obama, +1310 people. 79% white

A bowtie-shaped district in suburban Camden taking the Deptfords in the west and Cherry Hill/Voorhees in the east.

6th District: metro Camden, Pennsauken 75% Obama, -1862 people. 46% white, 26% black, 24% Hispanic

7th District: northwest Burlington Co 66% Obama, -13652 people. 65% white, 24% black

A Republican district on borrowed time. Diane Allen’s district with super-Democratic Pennsauken removed and swingy Moorestown added.

8th District: mid Burlington Co 54% Obama, -5473 people, 78% white.

More Republican than the current 8th but it’s also on borrowed time.

9th District: Pinelands 45% Obama, +1626 people. 86% white

Maybe the biggest possible legislative district in NJ.

10th District: Manchester and everything east 42% Obama, +3374 people. 89% white

This is the best, most compact possible Toms River district.

11th District: Brick to Neptune/Asbury Park 47% Obama, +11385 people. 81% white

The Democratic stronghold in eastern Monmouth Co gets broken up.

12th District: Ocean Twp to Middletown 48% Obama, -2331 people. 79% white

13th District: Marlboro to Lakewood 42% Obama, +20025 people. 74% white

Lakewood makes it a very Republican district.

14th District: Bordentown to Jackson 49% Obama, +1427 people. 83% white

Hamilton, Robbinsville and Bordentown get combined with Republican territory in Monmouth and Ocean Co.

15th District: mid Mercer Co 77% Obama, -1260 people. 46% white, 28% black, 16% Hispanic

The most Democratic parts of Mercer Co get packed into 1 district.

16th District: East Windsor to North Brunswick 61% Obama, +18056 people. 63% white, 19% Asian

This is the least Democratic of the Democratic districts on this map. It has some swingy territory such as Monroe and Cranbury but it’s not practical to make another Republican district out of it.

17th District: Sayreville to Holmdel 50% Obama, -6665 people. 73% white

Holmdel is the Republican anchor in this district.

18th District: Franklin to Plainfield 73% Obama, -3410 people. 35% white, 29% black, 15% Asian, 19% Hispanic

It packs in Democrats so the rest of Somerset and western Union can go in Republican districts.

19th District: New Brunswick, Edison, South Plainfield 65% Obama, -5455 people. 45% white, 24% Asian, 19% Hispanic

20th District: Woodbridge, Perth Amboy, Carteret, Rahway 65% Obama, -9392 people. 42% white, 11% black, 12% Asian, 33% Hispanic

21st District: Hopewell to southern Warren Co 47% Obama, -14398 people. 87% white

It’s Republican enough to absorb Hopewell.

22nd District: most of Somerset Co 48% Obama, -4927 people. 74% white

23rd District: western Union Co, eastern Somerset Co, except the Plainfields 50% Obama, -15124 people. 81% white

Tom Kean Jr’s district becomes a little more Republican.

24th District: Linden, Roselle, Elizabeth, Hillside 76% Obama, +555 people. 27% white, 25% black, 43% Hispanic

Union County: the extremely Democratic 24th and barely Republican 23rd cancel each other out. Sounds fair, right?

25th District: western Essex Co, eastern Morris Co 45% Obama, +8071 people. 84% white

26th District: West Orange to Clifton 71% Obama, +24087 people. 54% white, 21% black, 16% Hispanic

This is the only white-majority Democratic district in northern NJ. Packing makes all the other Democratic districts majority-minority.

27th District: Union Twp to East Orange 85% Obama, -2308 people. 26% white, 60% black

28th District: Newark except the East Ward 94% Obama, +9081 people. 58% black, 33% Hispanic

29th District: Newark’s East Ward, Harrison, Kearny, northwest Jersey City 74% Obama, +7567 people. 37% white, 10% black, 15% Asian, 36% Hispanic

30st District: Bayonne, most of Jersey City, Hoboken 76% Obama, -5099 people. 43% white, 23% black, 11% Asian, 21% Hispanic

The Newark-to-Jersey-City districts are the same in both the Democratic and Republican gerrymanders. The region is solidly Democratic so partisan gerrymandering gets done elsewhere.

31st District: Northeast Hudson Co, Edgewater, Cliffside Park 71% Obama, +7678 people. 27% white, 64% Hispanic.

This district reaches into Bergen Co instead of Secaucus to make the Republican Meadowlands district possible.

32nd District: south Bergen Co, Secaucus, Belleville, Nutley 52% Obama, -460 people. 67% white, 12% Asian, 18% Hispanic

A tough district the Republicans have to win in order to take a majority in the State Senate.

33rd District: Passaic to Ridgefield 68% Obama, -7147 people. 38% white, 43% Hispanic

34th District: Paterson, Haledon, Fair Lawn, Elmwood Park 77% Obama, +2697 people. 29% white, 21% black, 46% Hispanic

35th District: Teaneck/Englewood area 64% Obama, +3610 people. 46% white, 12% black, 24% Asian, 17% Hispanic

36th District: northern Bergen Co to Saddle Brook 47% Obama, +3657 people. 78% white

37th District: mid Passaic Co, western Bergen Co 46% Obama, -3884 people. 85% white

38th District: southern Morris Co 47% Obama, -7357 people. 72% white

39th District: northern Morris Co and upper Passaic Co 46% Obama, -4254 people. 80% white

40th District: Sussex Co, most of Warren Co 39% Obama, -9579 people. 88% white

Conclusion

It’s possible to give the Democrats 19 to 31 seats. 25 is the logical compromise. I would suggest incumbent protection (24 Dems) plus the two Burlington County Republicans on borrowed time.

NY State Senate: Weekly Campaign Roundup #4

It’s time for the fourth edition in our weekly roundup of news from the Democratic campaigns for the New York State Senate.  This week we’ve got endorsements from NYLCV and ESPA, and our candidates go on the attack while Republicans fight amongst themselves.

As always, if you see that we missed something, please include links to more news on New York State Senate campaigns in the comments.  If you Tweet about any campaigns, please consider using the #NYSen10 hashtag.  You can find all our challengers on Act Blue at the Change Albany Now page.  If you’d like to follow these roundups on a daily basis, visit our blog or subscribe to our RSS feed.  –Mike

DEMOCRATIC CANDIDATES

The New York League of Conservation Voters, a non-partisan, policy making and political action organization that works to make environmental protection a top priority, announced their support of numerous Democratic Senators and candidates . They endorsed 14 incumbent Democrats and 5 challengers – Dave Mejias, Susan Savage, Joanne Yepsen, Kathleen Joy, and Mary Wilmot. NYLCV President Marcia Bystryn had this to say specifically about Savage: “Susan Savage is exactly the kind of 21st century leader that New York needs. Susan knows that a healthy environment, green jobs and clean energy are not luxuries for the good times – they are the ways forward to a stronger, more economically vibrant New York.”

The Empire State Pride Agenda, the statewide, bi-partisan civil rights and political advocacy organization dedicated to winning equality and justice for lesbian, gay, bisexual and transgender (LGBT) New Yorkers, endorsed seven incumbent Democratic Senators and four Democratic challengers in their second round of 2010 endorsements. Not a single Republican was endorsed by the group. “These endorsements are the product of careful consideration by the Pride Agenda’s staff and Political Action Committee,” said executive director Ross Levi in a statement. “Our decisions are not based on a single issue, but a comprehensive review of a candidate’s positions and record, as well an assessment of his or her leadership qualities.”

Joe Williams, Executive Director of Democrats for Education Reform, wrote an op-ed in The New York Daily News that argued the leadership of Senate Majority Leader John Sampson and his fellow Democratic senators are responsible for New York still being in the race for federal dollars. Going forward, Williams argued, “the commitment the Democrats demonstrated for reform needs to be matched by elected officials, school districts and unions across the state.”

Democratic Candidate Mike Kaplowitz has secured the Independence Party line in the November election. He was chosen after an interview and endorsement process. “Voters in the Hudson Valley have shown time and again that they want to be represented by legislators who are independent of the special interests as well as the Albany leadership of both the Republican and Democratic Parties,” Kaplowitz said in a statement. “As an Independent Democrat on the Westchester Board of Legislators, I have been able to lead the way toward cutting millions in waste from the budget, consolidating departments to save money, and reforming pensions.”

Democratic Candidate Dave Mejias attacked his opponent, 21-year incumbent Kemp Hannon, for opposing a $1-per-hour pay raise for Nassau health-care workers . Mejias denounced Hannon’s position, saying: “A guy who has an extra $60,000 to loan his campaign telling workers they don’t deserve a $1 an hour raise is outrageous. 34 years in Albany has made Kemp Hannon quite comfortable, and he obviously doesn’t care what it’s like to try to feed a family on $20,000 a year.” Hannon has received $19,500 in campaign contributions from the Health Care Providers PAC since 2005. After the representatives from health care providers industry failed to provide evidence that the pay raise would hurt health care providers, an attempt to block the raise was unanimously rejected by the Nassau County Legislature on July 26.

Dave Mejias also launched a new campaign site this week.  Check it out at DaveForNewYork.com.

Dan Janison, of Newsday, profiled the race between Regina Calcaterra and 34-year Republican incumbent Ken LaValle. He said Calcaterra brings a “different style” to the race, that she is” hailed by her supporters as a sharp, energetic fighter,” and mentioned her work representing the state’s pension system in the high-profile lawsuit against WorldCom.

After 26-year incumbent and Bruno-successor Dean Skelos criticized Democrats for holding an extra legislative session, Democratic Candidate George Sava hit Skelos with the sad truth of some hard facts. Sava responded by saying: “Skelos is the expert when it comes to wasting tax money. After all, he voted to double state spending over 14 years, stuck taxpayers with a bill for over $1.2 million to fund his office last year, and allowed property taxes to rise 320 percent since he was elected. Nassau County tax payers are suffering. We need public servants who don’t just point the finger but come up with real solutions.”

REPUBLICANS

The Senate GOP decided to attack one of its own this week. Republican Greg Ball, who is running for the GOP nomination in SD-40 where Democratic Candidate Mike Kaplowitz has been running a stellar campaign, woke up to quite a smackdown from the GOP. In response to his organizing a “Women for Ball” event, the SRCC issued the following statement: “This is a tired rerun of what happened two years ago when news first broke that Greg Ball had been hit with an order of protection for stalking his ex-girlfriend. The facts are the facts, and Greg Ball stands accused of groping a waitress at an Albany bar, an account several eyewitnesses confirmed. Today, he trots out a woman whose mother is on the payroll of Ball political ally Steve Katz to spread lies. Those accusations are slanderous and are subject to legal liability. The residents of Dutchess, Putnam and Westchester counties are tired of the distractions, tired of the conspiracy theories and tired of all of the excuses. You can’t take anything Greg Ball says seriously.” For once, a statement well put by the SRCC.

Incumbent Republican Martin Golden, facing his first election contest in years, dropped his petition challenge of Democratic Candidate Mike DiSanto‘. DiSanto declared that he was not surprised by the Golden campaign’s challenge, adding that it is not unusual for “entrenched” incumbent politicians to challenge opponent petition signatures. “Everyone in the community knows my signatures are valid,” said DiSanto. “We live in a democracy and do not crown kings in America. I will not be intimidated by those who seek to undermine the political freedom that our country was founded upon,” With 2,100 signatures, he collected over twice the number required.

Former New York City Council Member Anthony Como, a Republican running for State Senate against Sen. Joe Addabbo, has been ordered to repay nearly $13,000 in unspent and misspent funds to the New York City Campaign Finance Board. The charges stem from his losing 2008 general election Council loss to Elizabeth Crowley. The repayment includes $6,800 that was spent impermissibly on phone and copy machine contracts for his campaign office that spanned well beyond Election Day, repayments of unspent campaign funds, and $100 spent on a newspaper ad for the Holy Child Jesus Team Drama Club that the CFB deemed not campaign related.

NY State Senate: Weekly Campaign Roundup #3

It’s time for the third edition in our weekly roundup of news from the Democratic campaigns for the New York State Senate.  This week we’ve got a bevy of endorsements from the Women’s Campaign Forum, HRC and more.  

As always, if you see that we missed something, please include links to more news on New York State Senate campaigns in the comments.  If you Tweet about any campaigns, please consider using the #NYSen10 hashtag.  You can find all our challengers on Act Blue at the Change Albany Now page.  If you’d like to follow these roundups on a daily basis, visit our blog or subscribe to our RSS feed.  –Mike

DEMOCRATIC CANDIDATES

New York state is a finalist for up to $700 million in federal education funds as part of the Race To The Top competition. This is a direct result of the Senate Democratic majority pushing through major legislation in recent months that allow test scores to be used in teacher evaluations and that raise the number of charter schools in the state to 460 from 200.

The Women’s Campaign Forum has endorsed four Democratic candidates: Didi Barrett, Regina Calcaterra, Mary Wilmot, and Robin Wilt. The WCF is dedicated to advancing the political participation and leadership of women who support reproductive health choices for all. WCF, founded in 1974, is a non-partisan national network dedicated to achieving parity for women in public office.

The Human Rights Campaign New York endorsed numerous Democratic challengers and incumbents who are all supporters of marriage equality and whose election will “put New York on a path to fairness and equality for same-sex couples in the state.” They endorsed incumbent Senators Brian Foley, Craig Johnson, Tom Duane, and Dave Valesky — and Democratic candidates Dave Mejias, Tony Avella, and Regina Calcaterra. Not a single Republican was endorsed by the group.

Tony Avella, running against 38-year Republican incumbent Frank Padavan, was endorsed by a massive retail union . The Retail, Wholesale and Department Store Union, which represents 100,000 workers across the United States and Canada, gave Avella the nod, calling him “an independent voice for working New Yorkers and taxpayers.” “He’s exactly the kind of reformer we desperately need in Albany right now,” said Stuart Applebaum, the union’s president.

Democratic Candidate Mike Kaplowitz proposed massive pension reform, advocating for the elimination of overtime for calculating a public employee’s pension and called for creating a pension plan for new public employees that would be similar to a 401K plan. Both measures, he said, could save taxpayers an estimated $2.2 billion over the next three years. “The costs of public pensions are killing New York State taxpayers,” he said. By 2013, Kaplowitz said, public employee pensions will cost taxpayers $6.8 billion — up from $2.4 billion in 2009.

Kaplowitz was also profiled by Jimmy Vielkind on The Albany-Times Union’s Capitol Confidential blog. In the piece, Kaplowitz spoke about how the GOP primary schism in the district is sure to play to his advantage. “There’s no question that the schism between the two of them will benefit me, because there are a lot of rank and file Republicans very angry with and very unhappy with the shenanigans of Assemblyman Greg Ball,” Kaplowitz said. Those shenanigans include an allegation that Ball denies that he groped a woman at an Albany bar, sleeps with a gun under his bed and once found a dead goat on his driveway.

Dave Mejias, running against 21-year Republican incumbent Kemp Hannon on Long Island, was interviewed by The Albany Project. Readers were able to send in questions in advance to ask Mejias, a former Nassau County Legislator. Mejias started out making his case quite strongly: “After 34 years in Albany, Kemp Hannon has forgotten who he represents. He works harder for party bosses and political insiders to maintain the status quo than he does for us. Why else would he have blocked ethics reform, voted to raise taxes over 400 times and most recently voted against restoring school aid?”

Democratic Candidate Didi Barrett, running against Republican incumbent Stephen Saland, weighed in on a variety of issues in a wide-ranging interview with The Register-Star. She said “It’s not about upstate or downstate, it’s about New York state. Politics has gotten in the way of progress for New York. We need an era that doesn’t complain and blame, but gets things done.” On balancing the budget, Barrett said that’s “something someone like me brings to the mix. I’m not a politician; I spent a long time in the not-for-profit sector. I learned to stretch a dollar by thinking outside the box. Everything should be on the table as a way to explore the best solutions.”

Democratic Candidate Joanne Yepsen  has continued to fight for the future of Saratoga Race Course. Yepsen and Sen. Eric Adams, head of the state Senate’s racing committee, held a roundtable at Saratoga National Golf Club to discuss the racing industry’s impact on the local economy. Yepsen said all stakeholders – New York Racing Association, New York City Off Track Betting and the Aqueduct racino operator – should be brought together to deal with racing’s future collectively. Several years ago, NYRA had a management contract with MGM to run Aqueduct’s racino, but the state wouldn’t approve it for unexplained reasons. “We’ve got different people running the state now,” Yepsen said.

Sen. Darrel Aubertine said that he is honored to have the endorsement of independent voters throughout his district. “I’m so pleased and honored to have the endorsement of the local independent voters and the Independence Party ballot line this fall,” Sen. Aubertine said. “Working for all of us means working together. I want to thank all nine members of the local Independence Party Committee and all of the local voters who signed petitions for your support and endorsement.” Over the past year, more than 50 pieces of legislation sponsored or co-sponsored by Sen. Aubertine passed the Senate.

REPUBLICANS

Showing just how out of touch he really is, Republican incumbent Stephen Saland attended a $19,000 black-tie dinner  for his re-election campaign that was thrown by a politically connected couple in April at their Rhinebeck, Dutchess County, estate.  The $19,000 dinner was listed as an in-kind donation to Saland’s campaign. That means it was for services rendered for a political function, but not a direct monetary contribution. “There’s a lot of trust with the reporting by the campaigns,” said Dick Dadey, executive director of Citizens Union, a good-government group. “There’s very little if any verification.”