Maryland Redistricting Map

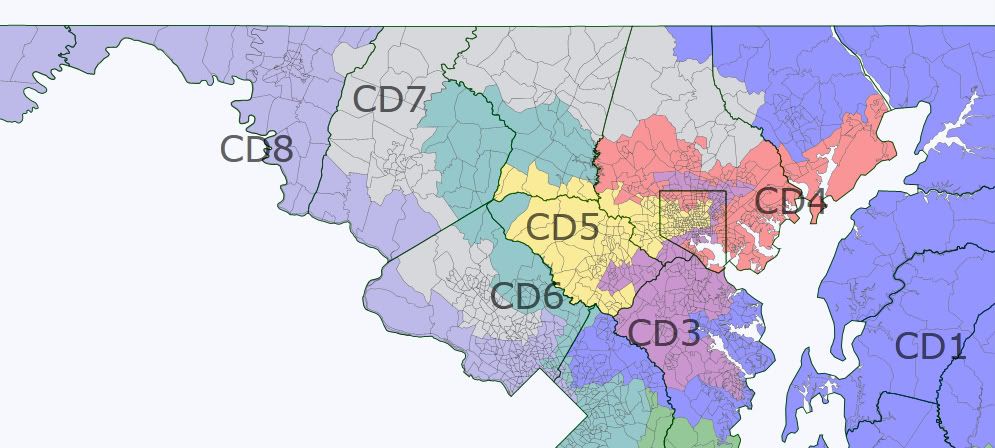
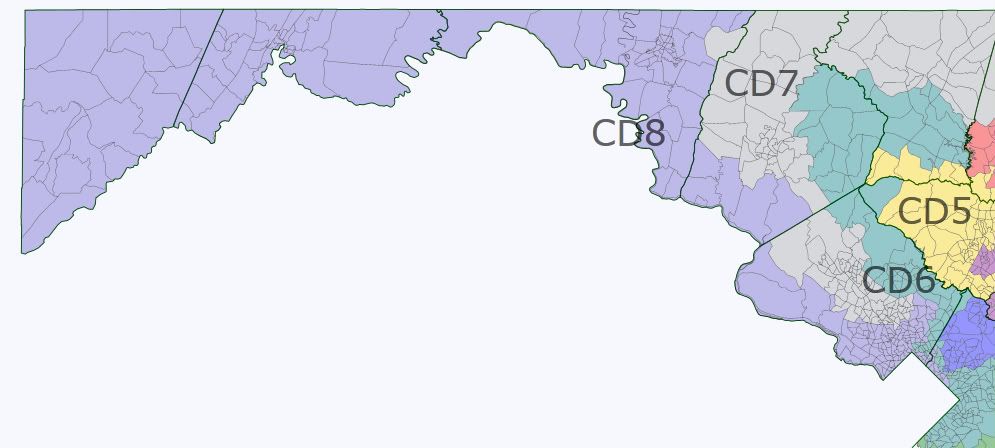
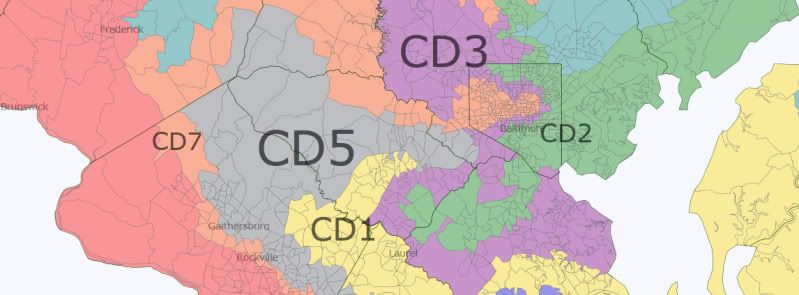
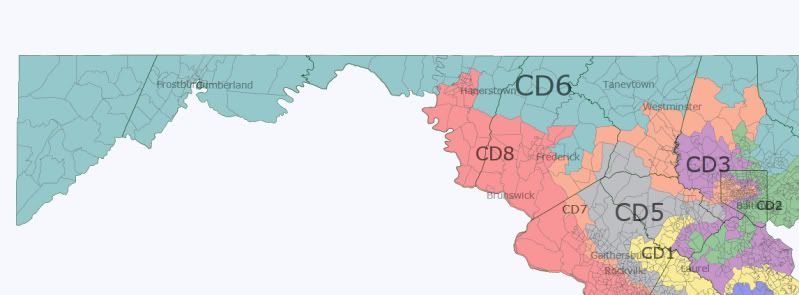
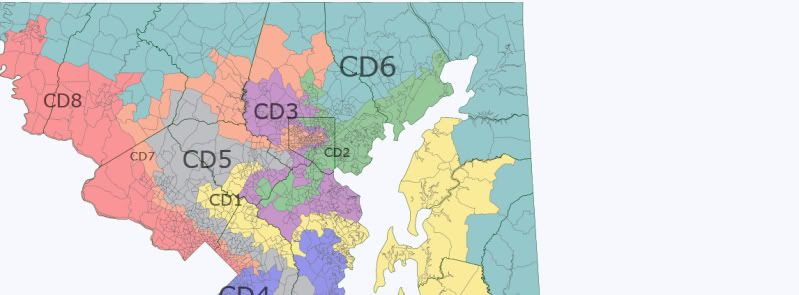
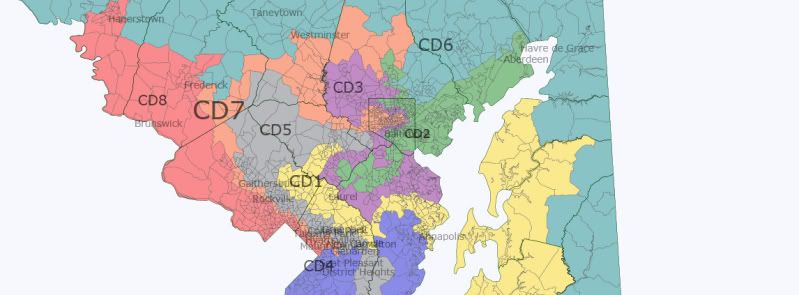
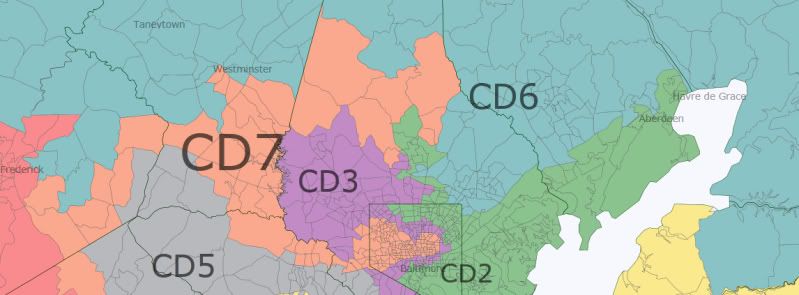
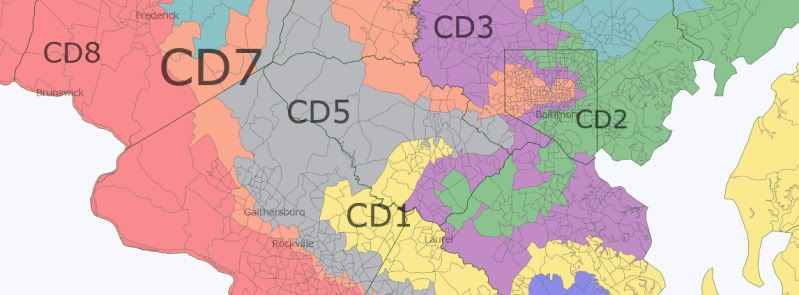
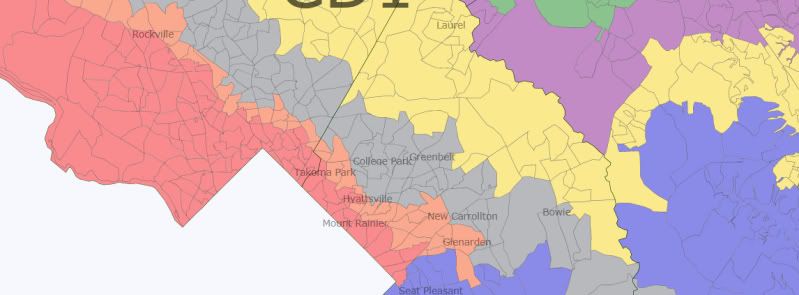
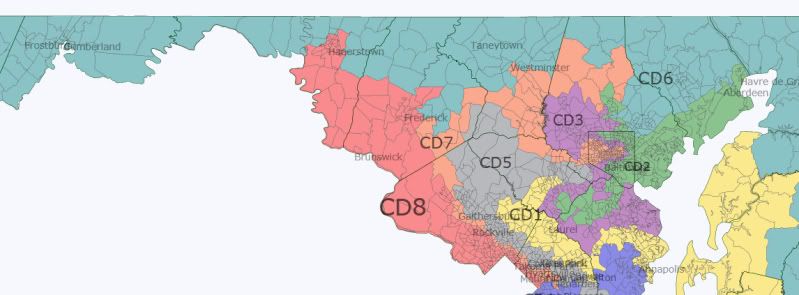
I’ve always hated Maryland’s extreme gerrymander, so I wanted to try and create a map that is more compact than the current one, but still provides a 7-1 Democratic advantage.  

Goals:

-Keep counties together as much as possible

-Keep two VRA districts

-Pack as many Republicans as possible into MD 6

-Maximize the Dem vote in the other 7 districts without having too many excess votes in the most Democratic ones

I did not however try to account for where the current Representatives live or where the majority of their current constituency resides, although I did keep the same general geographical location of each of the 8 districts.

1st District

The 1st District is really the target of this exercise, and becomes more Democratic by shedding territory in the northeast Baltimore suburbs and extending westward into heavily Dem eastern Prince George’s County.  If I wasn’t as concerned about geographic continuity it could actually extend further west to the DC border to pick up the excess Dem vote from MD-4 and shed more territory in the NE corner of the state to MD-6.  As it is, this becomes a district that would have gone 53% for Obama.  Certainly not a safe Democratic seat, but definitely an improvement over the current map and one where we would have a leg up.  

8-0 Maryland

This map is extremely ugly, but it gets the job done.  The main reason for its ugliness is the VRA retrogression rule.  So, in order to use white Democrats to our advantage, almost all the whites in the VRA-protected 4th and 7th districts are Republicans.  Likewise, in the other districts, almost all the Democrats are white.  If not for the VRA, we could have made a much more compact map with a nearly invincible 8-0 delegation.

The main goals here were:

1. Make an Obama district for Kratovil.

2. Knock out Bartlett and Harris.

3. Make almost all the other districts 60% Obama.

Here’s the map:

Photobucket

District 1 (blue): Frank Kratovil?

It keeps the Eastern Shore intact, but sheds the conservative areas in Northern Maryland.  It uses water contiguity to grab liberal areas of Annapolis, as well as parts of mid and southern Maryland.  The current PVI is R+13.  It’s now like R+4 or 5, which should be no problem for Kratovil, barring another 2010.  It also manages to move Harris into one of the other districts.

Obama: 50.5%, McCain: 48% (previously 58-40 McCain)

White: 68.9%, Black: 22.3%

VAP: White: 71.5%%, Black: 21.3%

Likely D for Kratovil, Lean R otherwise

District 2 (green): Dutch Ruppersberger/Andy Harris

The district is weakened considerably from its current D+7 to around D+2, but Harris has no chance here, considering he lost in an R+13 district in 2008.  In Congressional races between 2006-2008, the Democrat actually won an average of 59.7%.  Parts of Baltimore County are more Democratic than the Obama-McCain numbers show.  Some of the people actually vote for Democrats, but are notorious racists and McCain mopped up in this area.  For example, in Edgemere, all 3 precincts went solidly for McCain, but the congressional Democrat won in both 2006 and 2008.  So, Ruppersberger should be fine in this district, barring another 2010.   As a side note, John Sarbanes probably lives here as well, but would likely opt to run in the new 3rd.

Obama: 54.8%, McCain: 42.8% (previously 60-38 Obama)

White: 68.5%, Black: 19.0%

VAP: White: 71.8%, Black: 17.1%

Likely D vs. Harris, Lean D otherwise

District 8 (light purple): Chris Van Hollen

This stretches north and adds northwest Maryland, as part of the plan to knock out Bartlett.  It goes down from D+21 to about D+7, but Van Hollen is definitely safe.

Obama: 60.5%, McCain: 37.9 (previously 74-25 Obama)

White: 65.1%, Hispanic: 12.7%, Asian: 10.8%

VAP: White: 67.0%, Hispanic: 11.7%, Asian: 10.9%

Safe D

Central Maryland:

Photobucket

District 3 (purple): John Sarbanes

Not too much to say here.  Its PVI of D+6 probably stays about the same.

Obama: 59.8%, McCain: 38.2% (previously 59-39 Obama)

White: 57.9%, Black: 24.2%

VAP: White: 61.0%, Black: 23.0%

Safe D

District 4 (red): Donna Edwards

This black-majority district extends far north and south to take in as many Republicans as possible.  Might a lose a few points off its D+31 rating, but it’s not like that would make any difference.  It barely meets retrogression requirements by staying at 56.8% black.

Obama: 76.5%, McCain: 22.6% (previously 85-14 Obama)

Black: 56.8%, White: 30.7%

VAP: Black: 56.4%, White: 32.2%

Safe D

District 5 (yellow): Steny Hoyer

The used-condom district includes liberal areas in Montgomery, Prince George, and Anne Arundel Counties, as well as Republican areas from wrapping around the 4th district.  Hoyer doesn’t live here, but he basically lives in DC anyway, so he would just run here.  It may be weakened a bit from its current D+11, but he’s still safe.

Obama: 60.0%, McCain: 38.3% (previously 65-33 Obama)

White: 54.9%, Black: 24.6%, Hispanic: 11.4%

VAP: White: 57.1%, Black: 24.0%, Hispanic: 10.1%

Safe D

District 6 (teal): Roscoe Bartlett

Bartlett is technically the incumbent, but has pretty much no chance here.  His current district is R+13, but this is D+6 or 7.  We’ll still probably have to run a minor campaign the first time to ensure he doesn’t become a Republican Chet Edwards, but otherwise we’re safe.  Someone who knows more about Maryland politics could suggest a possible Dem candidate here.

Obama: 60.2%, McCain: 38.1% (previously 58-40 McCain)

White: 57.1%, Black: 17.2%, Hispanic: 15.8%

VAP: White: 59.6%, Black: 17.0%, Hispanic: 14.5%

Likely D vs. Bartlett in 2012, Safe D otherwise

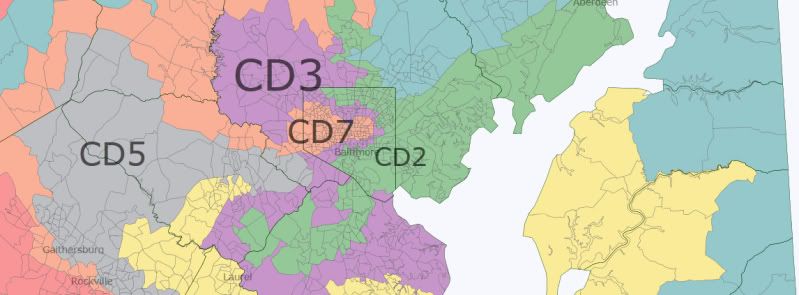
Baltimore Area Close-up:

Photobucket

District 7 (gray): Elijah Cummings

Perhaps the ugliest district on this map, this includes black areas in Baltimore City, as well as deep red parts of Baltimore and Harford Counties.  It probably stays at around D+25.

Obama: 71.5%, McCain: 27.1% (previously 79-20 Obama)

Black: 59.1%, White: 34.5%

VAP: Black: 57.9%, White: 36.3%

Safe D

Maryland 8-0 Map

Photobucket

Welcome to my first diary, I altered the numbering of the congressional district to be geographically oriented. The goal of this diary is to produce an 8-0 Maryland delegation. After playing with the map for a few weeks, I produced 7 districts that are Democratic and another district for former Congressman Frank Kratovil. The easiest way to make the district 8-0 is to split the Eastern Shore. Originally I had a 6-0-2 map in which the 1st District was slightly McCain and the 6th District was slightly Obama, after editing, they both became more Democratic. I have have also tried to clean-up the look of the current 2nd&3rd Districts.

1st District: open (blue)

Democrat: frm. Rep. Frank Kratovil?

Advantage: Tossup, Likely D w/Kratovil

2008 results: Obama 50.1% McCain 48.0% Other 1.9%

Race: 73.6% W,15.8% AA,5.6% H,3.5% A,1.5% O

Photobucket

2nd District (current 5th): Minority Whip Steny Hoyer (green)

Democrat: Steny Hoyer

Advantage: Safe Dem

2008 results: Obama 59.8% McCain 39.1% Other 1.1%

Race: 60.6% W,32.0% AA,3.2% H,2.2% A,2.0% O

Photobucket

3rd District : Rep. John Sarbanes (purple)

Democrat: John Sarbanes

Advantage: Safe Dem

2008 results: Obama 58.2% McCain 39.8% Other 2.0%

Race: 67.5% W,21.2% AA,4.9% H,4.2% A,2.1% O

Photobucket

4th District (current 2nd): Rep. Dutch Ruppersberger (D), Rep. Andy Harris (R)? (red)

Democrat: Dutch Ruppersberger

Advantage: Safe Dem

2008 results: Obama 58.9% McCain 39.1% Other 2.0%

Race: 65.0% W,26.4% AA,3.3% H,3.4% A,1.8% O

Photobucket

5th District (current 7th): Rep. Elijah Cummings (yellow) VRA

Democrat: Elijah Cummings

Advantage: Safe Dem

2008 results: Obama 77.0% McCain 21.7% Other 1.3%

Race: 33.9% W,56.2% AA,2.7% H,5.3% A,1.7% O

Photobucket

6th District (current 4th): Rep. Donna Edwards* (teal) VRA

*lives outside current 4th and new 6th

Democrat: Donna Edwards

Advantage: Safe Dem

2008 results: Obama 77.9% McCain 21.1% Other 1.0%

Race: 30.7% W,53.0% AA,10.2% H,4.6% A,1.5% O

Photobucket

7th District (current 6th) : Rep. Roscoe Bartlett (R)(gray)

Democrat: Jen Dougherty? thoughts?

Advantage: Likely Dem

2008 results: Obama 55.2% McCain 42.9% Other 1.9%

Race: 64.6% W,11.6% AA,11.3% H,10.6% A,1.8% O

Photobucket

8th District: Rep. Chris Van Hollen (light purple)

Democrat: Chris Van Hollen

Advantage: Safe Dem

2008 results: Obama 61.6% McCain 36.8% Other 1.6%

Race: 65.8% W,13.8% AA,12.2% H,6.5% A,1.7% O

Photobucket

Thoughts on winners and losers in this map?

Errors?

Who would run in the new 7th?

Who would be unhappy with this map?

Cultural Regions of Maryland

This diary is meant to be a little fun given all the heavy redistricting diaries we have on here. The one thing that’s always struck me about my home state is how it’s so diverse and interesting in spite of being so small. This diary will try to explain how the various cultural groups fit together by using Dave’s mapping program, along with accompanying demographic and political data.

Region 1 – Eastern Shore (blue)

292,037 people (5.1% of the state)

70.6% white, 21.5% black, 4.4% Hispanic, 1.4% Asian

44.0% Obama

46.1% Average Dem

This region is already well known to anyone familiar with MD politics, and is probably the easiest to define geographically – basically the entire Eastern shore, minus the wealthy Baltimore influence areas of Kent Island, St. Michaels, and Ocean City/Ocean Pines, as well as the college town of Chestertown and northern Cecil County.

This region is the most “Southern” part of Maryland, and would be more at home in tidewater Virginia than in the I-95 Corridor. However, given that this is not the Deep South, and that there is a fairly large black population as a holdover from slavery, Dem margins aren’t as bad here as one would think. Most of the counties still have Dem registration advantages, and as you can see, local Dems do slightly better than Obama did.

Region 2 – Prince George’s County (green)

901,776 people (15.6% of the state)

15.9% white, 67.5% black, 9.5% Hispanic, 4.2% Asian

87.5% Obama

86.1% local Dem

Geographically, this region includes all of central and southern Prince George’s County, as well as parts of northern Charles County, western Anne Arundel County, North Laurel in southern Howard County, and Calverton in Montgomery County.

Home to a large and renown middle-class African-American population, this region of Maryland is probably the closest thing in the rest of the nation to the Atlanta suburbs. It’s interesting that this region exists at all given that Prince George’s County was only 10% black in 1970. What happened to cause this shift was a court decision in the 1970s that demanded the complete racial balancing of all schools in the county. Whites fled, either out of racial fear or out of anger over having to attend a far-away school. Blacks from DC (and later from around the nation) came in to replace them, and the region has continued to grow ever sense. The most recent trend has seen the black middle class expanding outward into other counties. Just think how different Maryland politics would be if that court decision never happened.

Region 3 – Southern Maryland (purple)

297,796 people (5.2% of the state)

79.4% white, 12.7% black, 3.3% Hispanic, 1.8% Asian

43.5% Obama

50.3% Average Dem

This region spans all of St. Mary’s and Calvert Counties, along with southern Anne Arundel County and rural Charles County. This region is a lot like the Eastern Shore, but has held onto its Democratic roots a little more (as noted by the avg Dem performance). This once tobacco-producing part of the state once spanned all of Charles County and southern Prince George’s County as well. With time, the expansion of the DC suburbs will probably kill this region and make it into one big suburb with no southern tendencies to speak of.

Region 4 – Creative Class (brown)

1,712,227 people (29.7% of the state)

59.7% white, 15.6% black, 10.1% Hispanic, 11.5% Asian

65.5% Obama

66.9% Average Dem

When you meet someone who says they’re from Maryland, this is probably where they’re from. Including most of Montgomery County (MoCo), most of Howard County (HoCo), College Park and Bowie in Prince George’s County, northwestern Baltimore County, the wealthier part of Baltimore City, southern Frederick County, Chestertown in Kent County, and Annapolis in Anne Arundel County, this region is full of wealthy young professionals trying to climb the ladder of advancement. It’s hard to say when this region first took off, but I’m sure it has something to do with the GI Bill and federal government expansion in the 1940s.

This area has one of the highest income levels in the country, as well as one of the highest levels of educational attainment. It is staunchly liberal, one of the most liberal areas in the entire nation. It is the largest of Maryland’s cultural groups, and keeps growing larger each day. Who knows how much of Maryland will fall into this category in the future?

Region 5 – Baltimore exurbia (yellow)

776,454 people (13.4% of the state)

88.8% white, 3.9% black, 2.8% Hispanic, 2.8% Asian

35.8% Obama

38.6% Average Dem

This region includes northern Baltimore County, northern Harford County, western Cecil County, eastern Carroll County, northern Howard County, eastern Frederick County, and central Anne Arundel County, along with Damascus in Montgomery County, Linthicum in Anne Arundel County, Arbutus in Baltimore County, Kent Island in Queen Anne’s County, St. Michaels in Talbot County, and Ocean City/Ocean Pines in Worcester County.

This region is the nemesis of the Creative Class region. It is staunchly conservative and proud of it. A lot of people mistakenly think that the Eastern Shore is the center of Maryland conservatism, but no, this is. Andy Harris actually personifies this region – upper class, well-educated, but wanting nothing to do with society at large, and constantly scared that everything one has will be taken away. Look for this region to shrink as white flight from Maryland accelerates.

Region 6 – Western Maryland (teal)

333,931 people (5.8% of the state)

87.9% white, 6.6% black, 2.5% Hispanic, 1.1% Asian

38.1% Obama

38.6% average Dem

This region includes all of Garrett, Allegany, and Washington Counties, along with northern Frederick County and northwestern Carroll County. Staunchly conservative, this is the one region of Maryland that is historically Republican. This region was a major hotbed of abolitionism during the Civil War, and like eastern Tennessee hasn’t given up on Republicans since. The major issue here is shrinkage – Garrett and Allegany finally stopped losing population, but the eastern side continues to be devoured by the outward expansion of DC and Baltimore.

Region 7 – Delaware (grey)

42,144 people (0.7% of the state)

81.1% white, 9.8% black, 4.7% Hispanic, 1.7% Asian

49.3% Obama

51.1% Avg Dem

Encompassing northeastern Cecil County, this is the smallest of Maryland’s cultural regions, and exists as an outward expansion of Wilmington’s suburbs. It’s worth mentioning because its Dem performance is much higher than what its racial stats would suggest.

Region 8 – Baltimore, Hon!

610,137 people (10.6% of the state)

69.6% white, 17.0% black, 6.6% Hispanic, 3.7% Asian

48.9% Obama

56.6% Avg Dem

This region covers southern Harford County, southeastern Baltimore County, southern Baltimore City, southwestern Baltimore County, and parts of northern Anne Arundel County. This region is low in income and low in educational attainment (aka blue collar). Most of the people here actually came from the South and from West Virginia years ago to work in Baltimore’s then thriving factories. Now that the factories are gone, the region is best known for John Waters, drag racing, Natty Bo, and 98 Rock.

A lot has been made of this region’s racism, given how much worse Obama did compared to the average Dem. That difference is actually obscured somewhat by the numbers I’ve provided given that I included some racially-diverse (but still blue collar) neighborhoods that brought Obama’s numbers up. Given the lack of opportunity here, the region is constantly shrinking.

Region 9 – Hispanic Maryland (sky blue)

199,903 people (3.5% of the state)

14.6% white, 26.1% black, 49.8% Hispanic, 7.2% Asian

81.8% Obama

82.1% Avg Dem

Encompassing northern Prince George’s County and central Montgomery County, this region is a newcomer on the Maryland scene. It started in the 1980s when refugees from Central America began to settle in Prince George’s County. Since then, it has expanded greatly, and look for more expansion in the future. Issues here include poverty and low levels of educational attainment, but those issues might be less prevalent as citizenship becomes less of an issue.

Region 10 – African-American Baltimore (pink)

607,157 people (10.5% of the state)

12.7% white, 80.2% black, 3.0% Hispanic, 1.9% Asian

92.4% Obama

89.7% avg Dem

Encompassing most of Baltimore City, western Baltimore County, and a few scattered communities in eastern Baltimore County, this region is sadly known for extreme segregation and poverty. The region has its roots in the 1800s when runaway slaves wanted somewhere to live and work (Maryland was actually not a relatively bad place for a runaway slave to live in spite of the fact that the state had slavery). It expanded greatly during the Great Migration through the 1970s, when African-Americans from the South came north to look for factory jobs. You know the story from there – 1970s – jobs gone, 1980s and 1990s – crack epidemic, 2000s and 2010s – recovery.

One thing that should be mentioned is that the part of western Baltimore County in this region is actually very middle class, which has only worsened conditions in the inner city (as middle class African-Americans fled the city for the county). However, given that the two areas have a common history, I included them as one region. Baltimore City is actually losing blacks faster than it is losing whites now, and while some will head for the County, some will probably head South as well. Look for this region to shrink in the City but expand in the surrounding counties.

So that’s it; questions? comments?

Maryland Population Shifts by State Senate District

So yeah, lately in my few spare moments I’ve been working on the perfect Maryland legislative redistricting map. Before I release that though, I want to talk a little about the thought process that goes into such a map. Today’s diary will show how the population in Maryland has shifted over the past decade, and what this will mean for redistricting in my beloved home state.

To start, I made a map using Census 2010 colors, that shows how the state’s districts have grown over the past decade.

From this map we can make several conclusions:

– Given that the state growth rate was around 9%, it makes sense that most districts would be in the 5-15% range.

– Growth in traditionally high-growth exurbs of Baltimore (Carroll, Harford, northern Baltimore County) slowed to the state average this decade.

– Many of Baltimore’s inner suburbs stagnated (although this is an improvement for Essex/Dundalk, which had been losing population for decades)

– 5 of Baltimore City’s 6 districts lost significant population, guaranteeing the loss of a State Senate district. The one that actually did post a modest gain, District 46, is the one most likely to be abolished given that it’s the only non-majority black district in Baltimore City.

– The only district to lose population outside of Baltimore City was majority-black District 24 in Prince George’s County. Every district in MD that lost population over the past decade was majority-black.

This might be worth exploring in a later diary, but the correlation coefficient between %black and %growth was -.54, while for whites it was .42, Asians .39, and Hispanics .05

– The highest growth area of the state by far is the I-270 corridor in Frederick/Montgomery Counties. District 15 gained an amazing 28%, while District 3 gained 25%.

– Other areas growing significantly faster than the state average include:

     – the western Baltimore suburbs (9 and 11)

     – Gaithersburg/Rockville (17)

     – Southern Maryland (27, 28, and 29)

     – Outer Prince George’s County (21 and 23)

     – the Upper Eastern Shore (36) – mostly from high growth around Elkton and Kent Island

– Although growth stagnated in the inner DC suburbs, the balance of power in the state continues to shift towards DC.

Redistricting Implications

Growth isn’t everything. Another important consideration is the extent to which current districts are over or under population. Under the law, districts must be within 5% deviation of the mean population. The following map shows what districts are over, under, or acceptable.

From this map, one can see that inner Baltimore and DC suburbs districts will need to expand, while the outer suburban and rural districts will need to contract.

Side Note about Deviation

It’s important to note that a lot of the underpopulated districts started out with fewer people in 2000. Here’s a map showing which districts were drawn to be over and under the median (but within 5%) in 2000.

As you can see, the Democratic Party has used acceptable deviation as way to slightly maximize the influence of its most loyal counties – Prince George’s, Montgomery, and Baltimore City. Expect to see deviation put to good use in my map, as well as in the map that eventually gets drawn.

Conclusion

So yeah, that’s it. I hope this gets a few people talking and/or thinking. Before I release my perfect legislative map, I’m thinking about writing a diary on the history of Maryland legislative redistricting, so be on the lookout for that as well.

Maryland, My Maryland !

This is my version of Maryland using Daves Redistricting 2.1.  Looking at the 2010 Census data incorporated into the Application, I see no reason at all why Democrats should not create an 8-0 map.

Actually, I drew a couple versions of a map.  The main part of this diary deals with “Version 1”, an 8-0 map which I believe would have the best chance of being enacted in Maryland.  My alternative “Version 2” is discussed at the end of the diary.

VERSION 1

This map preserves both black majority seats, keeps the districts of all six Democratic incumbents safely Democratic and creates two additional Democratic seats — all without creating a “monstrous” looking map.

Another very important goal for me was to keep as much of each incumbent’s current territory (population-wise) in the new district.  The percentages of current constituents that each district gets to keep are below:

MD-1 – 64.8%

MD-2 – 65.1%

MD-3 – 58.2%

MD-4 – 57.9%

MD-5 – 64.6%

MD-6 – 60.1%

MD-7 – 51.8%

MD-8 – 58.0%

I feel that the set of numbers above is just as important as the partisan numbers for each district.  In many cases, if an incumbent loses too much of his or her existing constituents, they may not like the map even if their district becomes more favorable in terms of party identification.  Thus any map that has a realistic chance of being enacted in Maryland must pay close attention to how a proposed district resembles the existing district.

As you can see from the numbers above, each incumbent save one gets to keep at least 58% of their current constituents.  As for MD-7, Cummings keeps only 52%.  However, that number comes with a caveat — because an additional 13.9% of the proposed MD-7 here comes out of African-American areas in Baltimore City (Cherry Hill, for example) or Baltimore Co. (Randallstown) that are currently part of MD-2 or MD-3.  These added areas are 75% black, so even though Cummings currently doesn’t represent them, there’s no reason these new constituents would not be receptive to being represented by Cummings.

UPDATE: please note that per suggestion from one reader, I have adjusted the map to do a better job at keeping suburban Baltimore communities together; this change had the added benefit of making Cummings keep more of his current MD-7 constituents — now 55.1% (please see comments section for more info.)

The black percentage in the two black majority districts goes down slightly from the current percentages, but the proportion of African-Americans as a percentage of the Democratic primary vote in both districts is very high — by my estimate it’s at least 77% in MD-4 and at least 82% in MD-7 (sic) ! — so these districts should have no trouble in electing an African-American representative.

The districts of all six Democratic incumbents are kept at least 60% Obama and at least 60% Democratic Average 2006-2008.  The two new Democratic districts are made to be 53.7% Obama for MD-1 and 55.6% Obama for MD-6.  Both the new MD-1 and the new MD-6 are at exactly 52.9% Democratic Average 2006-2008.  I feel that is enough of a cushion in both cases.  For MD-1, Kratovil should easily win a 53-54% Democratic district.  Most of the area in the new MD-6 (Frederick area and northern Montgomery Co.) is becoming more and more Democratic every year, as evidenced by the Democrats take-over of State Senate District 3 (Frederick) this past November.  I could have made the new MD-6 a bit more Democratic, but I did not want to endanger Van Hollen or make the lines too convoluted (for example, you could add Carroll Co. to MD-4, like I did in a previous diary and here under “Version 2”, but it just seems like a bridge too far in any map that has a realistic chance of being enacted; in this respect, much of what constitutes drawing a map is quite subjective).  The new MD-6 here should turn blue, unless a very, very moderate Republican is the nominee — which isn’t going to happen these days !  

Partisan numbers for new districts are below:

MD-1 – 53.7 Obama; 52.9 Democratic Avg. 2006-2008

MD-2 – 60.9 Obama; 63.8 Democratic Avg. 2006-2008

MD-3 – 60.2 Obama; 60.7 Democratic Avg. 2006-2008

MD-4 – 82.5 Obama; 79.1 Democratic Avg. 2006-2008

MD-5 – 60.9 Obama; 60.9 Democratic Avg. 2006-2008

MD-6 – 55.6 Obama; 52.9 Democratic Avg. 2006-2008

MD-7 – 73.5 Obama; 69.7 Democratic Avg. 2006-2008

MD-8 – 64.7 Obama; 64.9 Democratic Avg. 2006-2008

Where possible, I tried to respect county and community lines while drawing this map (see the fourth map down where city lines and Census-designated community lines in central Maryland are mapped).  

The population deviation for this map is +/- 132 persons, with the caveat that Maryland has a new law now where the prison population may have to be “reassigned” to district of origin.  For demographics below, I noted ethnic/racial group if 5%+ of the population. Please note that all the data below for current and proposed districts is obtained from Daves Redistricting Application.  I drew in the existing districts into the Application to obtain demographic data as it currently stands for each district.  Please note that for partisan data, it appears that the percentages provided in the Application are percentages as a proportion of the two-party vote.

Photobucket

Photobucket

Photobucket

Photobucket

Photobucket

Photobucket

Photobucket

District 1:

Current District Population: 81.0 white, 11.4 black

Proposed District Population: 66.0 white, 24.7 black, 5.2 hispanic

Current District 18+ Population: 82.8 white, 11.1 black

Proposed District 18+ Population: 68.5 white, 23.8 black

Current District President: 41.5 Obama, 58.5 McCain

Proposed District President: 53.7 Obama, 46.3 McCain

Current District Partisan Avg. 2006-2008: 41.8 Democratic, 58.2 Republican

Proposed District Partisan Avg. 2006-2008: 52.9 Democratic, 47.1 Republican

District 2:  

Current District Population: 55.2 white, 33.1 black, 5.0 hispanic

Proposed District Population: 62.6 white, 24.9 black, 5.4 hispanic

Current District 18+ Population: 59.2 white, 30.8 black

Proposed District 18+ Population: 66.5 white, 22.4 black

Current District President: 60.8 Obama, 39.2 McCain

Proposed District President: 60.9 Obama, 39.1 McCain

Current District Partisan Avg. 2006-2008: 63.4 Democratic, 36.6 Republican

Proposed District Partisan Avg. 2006-2008: 63.8 Democratic, 36.2 Republican

District 3:  

Current District Population: 65.2 white, 20.0 black, 6.8 hispanic, 5.3 asian

Proposed District Population: 60.0 white, 21.9 black, 8.7 asian, 6.1 hispanic

Current District 18+ Population: 68.2 white, 18.7 black, 6.0 hispanic, 5.2 asian

Proposed District 18+ Population: 62.9 white, 21.0 black, 8.6 asian, 5.4 hispanic

Current District President: 60.5 Obama, 39.5 McCain

Proposed District President: 60.2 Obama, 39.8 McCain

Current District Partisan Avg. 2006-2008: 62.3 Democratic, 37.7 Republican

Proposed District Partisan Avg. 2006-2008: 60.7 Democratic, 39.3 Republican

District 4:

Current District Population: 55.7 black, 20.6 white, 14.2 hispanic, 6.9 asian

Proposed District Population: 53.2 black, 24.7 white, 13.0 hispanic, 6.5 asian

Current District 18+ Population: 55.5 black, 22.3 white, 12.9 hispanic, 7.2 asian

Proposed District 18+ Population: 53.0 black, 26.2 white, 11.9 hispanic, 6.7 asian

Current District President: 86.1 Obama, 13.9 McCain

Proposed District President: 82.5 Obama, 17.5 McCain

Current District Partisan Avg. 2006-2008: 82.6 Democratic, 17.4 Republican

Proposed District Partisan Avg. 2006-2008: 79.1 Democratic, 20.9 Republican

District 5:

Current District Population: 48.0 white, 36.7 black, 7.9 hispanic

Proposed District Population: 56.4 white, 27.9 black, 9.5 hispanic

Current District 18+ Population: 50.8 white, 35.6 black, 6.9 hispanic

Proposed District 18+ Population: 58.7 white, 27.2 black, 8.4 hispanic

Current District President: 67.0 Obama, 33.0 McCain

Proposed District President: 60.9 Obama, 39.1 McCain

Current District Partisan Avg. 2006-2008: 65.8 Democratic, 34.2 Republican

Proposed District Partisan Avg. 2006-2008: 60.9 Democratic, 39.1 Republican

District 6:

Current District Population: 85.0 white, 6.4 black

Proposed District Population: 66.4 white, 11.0 hispanic, 10.6 black, 9.2 asian

Current District 18+ Population: 86.8 white, 6.4 black

Proposed District 18+ Population: 69.0 white, 10.0 black, 9.9 hispanic, 9.3 asian

Current District President: 41.3 Obama, 58.7 McCain

Proposed District President: 55.6 Obama, 44.4 McCain

Current District Partisan Avg. 2006-2008: 40.0 Democratic, 60.0 Republican

Proposed District Partisan Avg. 2006-2008: 52.9 Democratic, 47.1 Republican

District 7:  

Current District Population: 55.7 black, 31.6 white, 6.7 asian

Proposed District Population: 55.0 black, 38.2 white

Current District 18+ Population: 54.6 black, 33.6 white, 6.7 asian

Proposed District 18+ Population: 54.1 black, 39.9 white

Current District President: 81.8 Obama, 18.2 McCain

Proposed District President: 73.5 Obama, 26.5 McCain

Current District Partisan Avg. 2006-2008: 76.6 Democratic, 23.4 Republican

Proposed District Partisan Avg. 2006-2008: 69.7 Democratic, 30.3 Republican

District 8:  

Current District Population: 47.5 white, 20.0 hispanic, 16.3 black, 13.3 asian

Proposed District Population: 63.3 white, 13.6 black, 12.6 hispanic, 7.9 asian

Current District 18+ Population: 49.6 white, 18.6 hispanic, 16.1 black, 13.5 asian

Proposed District 18+ Population: 65.0 white, 13.6 black, 11.5 hispanic, 8.1 asian

Current District President: 76.0 Obama, 24.0 McCain

Proposed District President: 64.7 Obama, 35.3 McCain

Current District Partisan Avg. 2006-2008: 75.1 Democratic, 24.9 Republican

Proposed District Partisan Avg. 2006-2008: 64.9 Democratic, 35.1 Republican

VERSION 2

The map below is my alternative version.  There’s only one difference from Version 1:  Carroll Co. is added to MD-4 while almost everything that’s in Montgomery Co. and part of MD-4 under Version 1 is now added to MD-6.  This exchange between MD-4 and MD-6 produces the following demographic and partisan numbers:

District 4:

Proposed District Population: 50.5 black, 33.1 white, 10.5 hispanic

Proposed District 18+ Population: 50.3 black, 34.5 white, 9.7 hispanic

Proposed District President: 75.7 Obama, 24.3 McCain

Proposed District Partisan Avg. 2006-2008: 72.6 Democratic, 27.4 Republican

District 6:

Proposed District Population: 58.0 white, 13.4 hispanic, 13.3 black, 12.1 asian

Proposed District 18+ Population: 60.9 white, 12.5 black, 12.3 asian, 12.2 hispanic

Proposed District President: 62.3 Obama, 37.7 McCain

Proposed District Partisan Avg. 2006-2008: 59.3 Democratic, 40.7 Republican

Photobucket

The “Version 2” map turns MD-6 into something that’s safely Democratic (instead of just a lean/likely Democratic seat under Version 1), but reduces the black percentage in MD-4 — though it remains above 50%.  The reduction in the African-American population in MD-4 may be retrogressive — however, it should be noted that the white population remains a relatively low percentage, and amazingly, according to my estimate, the proportion of African-Americans as a percentage of the Democratic primary vote in MD-4 now goes UP to 84%.  Another problem would be that Edwards would only get to keep 39% of her existing constituents under these revised lines.

Last, but not least, I must add that I absolutely love version 2.1 of Daves Redistricting Application !

By what margin will Bob Shamansky win?

View Results

Loading ... Loading ...

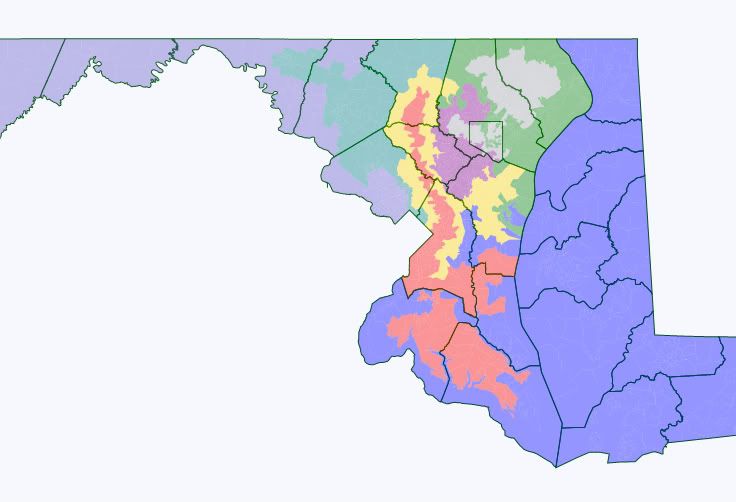
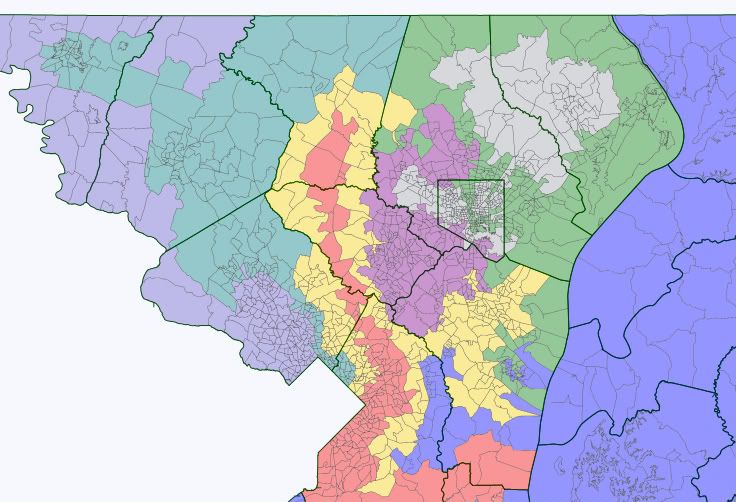
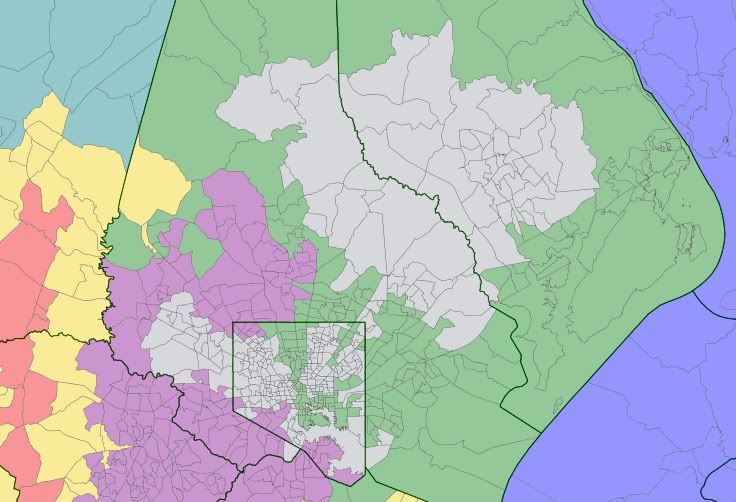
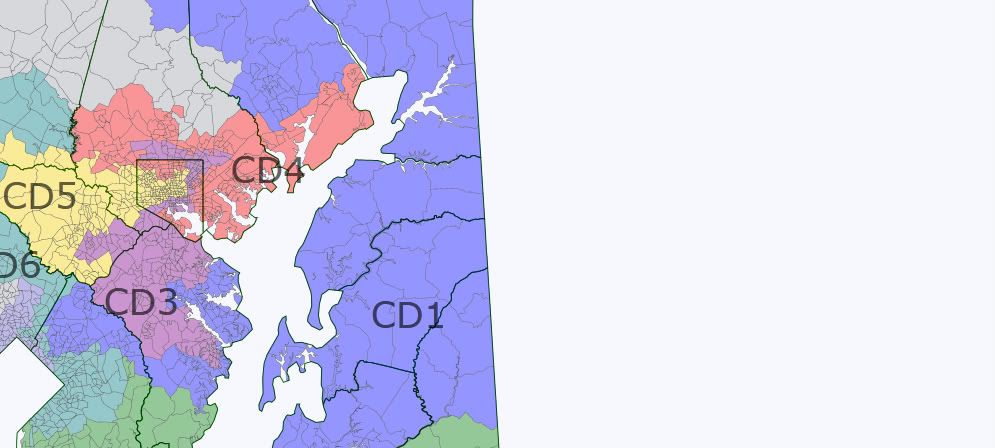
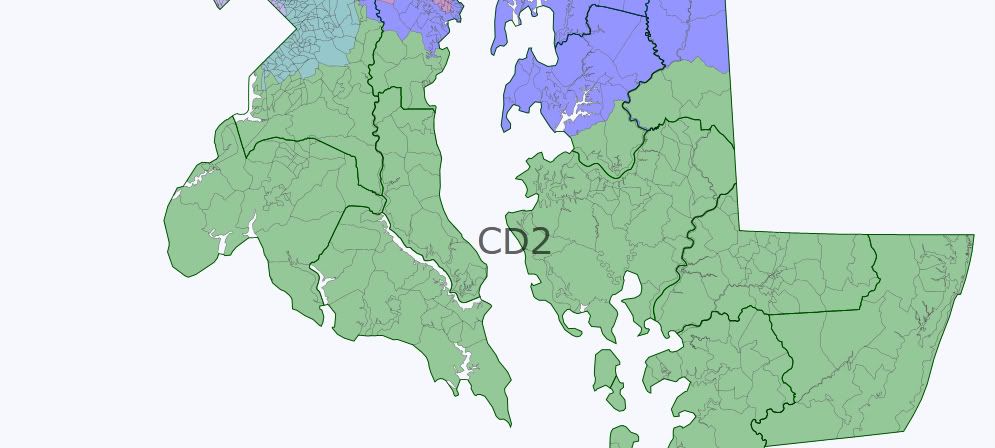
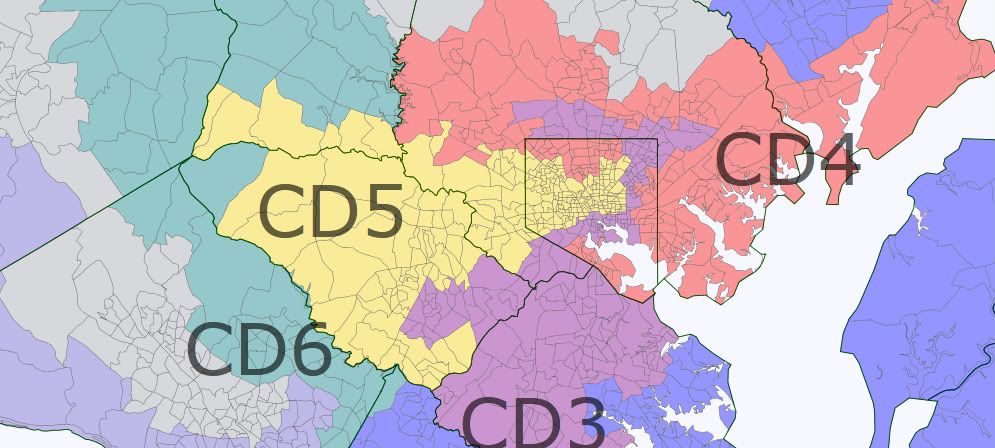
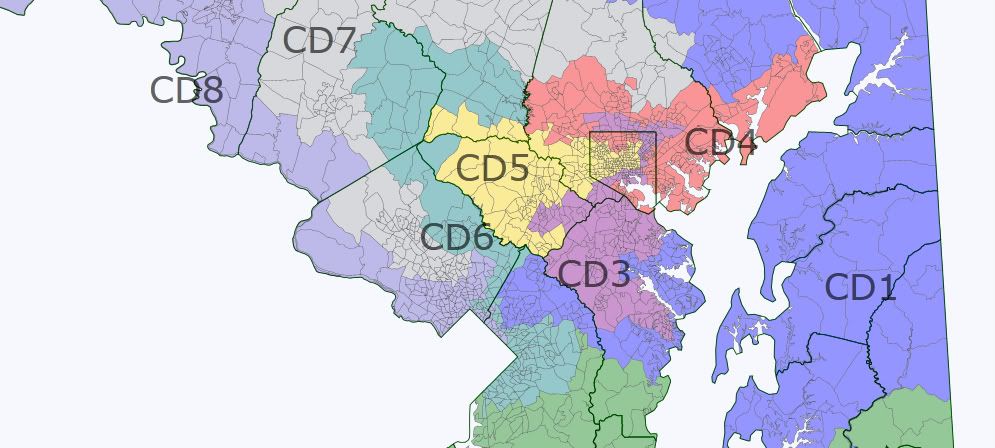
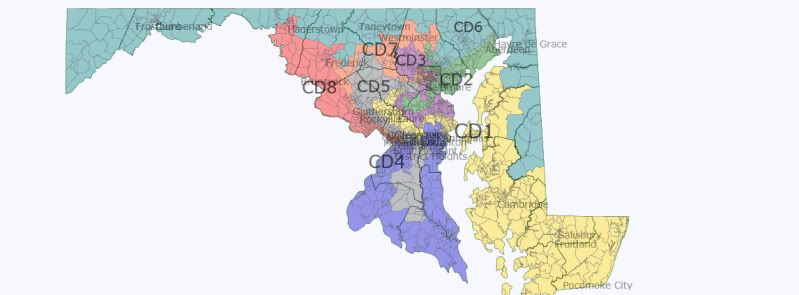
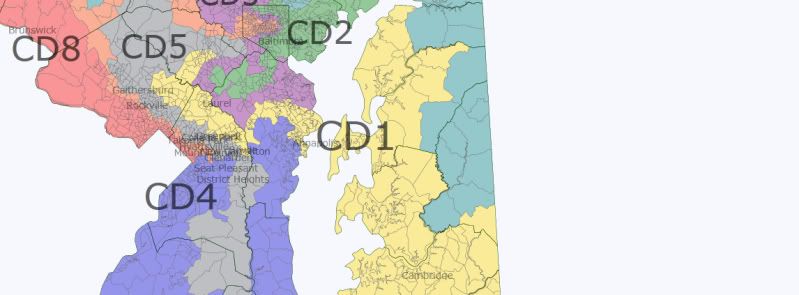
4-4 Gerrymander of Maryland

Obviously an exercise, inspired by the flood of 8-0 Democratic Marylands. Originally I had attempted to make five Republican seats in Maryland, but while it was possible to make five seats won by McCain it would have been a huge overreach and Republicans would have been unlikely to hold all five seats in even a neutral year (possibly none in a Democratic wave). Given that, the exercise became a matter of shoring up four seats as much as possible. While Maryland is quite a blue state these years the Democratic voting base is heavily concentrated so forcing it into four ultra Democratic seats was entirely possible. The remaining four Republican seats all ended up with a 44-54 Obama/McCain lean.    

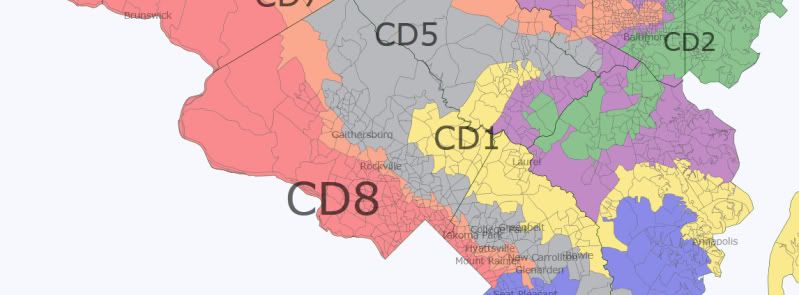
CD1 (Blue): W85 B10, O44 M54 Much of Anne Arundel county, coastal Baltimore county and smallish bits of Harford and Prince George’s. PVI R+9  

CD2 (Green): W31 B63 O87 M12 Most of Baltimore city with tiny amounts of Baltimore county. PVI D+34  

CD3 (Dark Magenta): W80 B16 O44 M54 The entire Eastern Shore, all of Calvert and St. Mary’s, and parts of Charles and St George’s in south Maryland, and a piece of Harford in the north. PVI R+9  

CD4 (Red): W21 B69 O91 M9 Mostly Prince George’s, with a little of northern Charles D+38

CD5 (Gold): W47 B36 O77 M21 Northern Prince George’s with a tendril stretching to Annapolis (the Severn river does maintain contiguity) and toward (though not into) Baltimore city. D+24

CD6 (Teal): W87 B7 O44 M54 Mostly Baltimore county but spilling over into adjacent counties. PVI R+9  

CD7 (Dark Grey): W58 B15 A12 H12 O73 M25 The most Democratic parts of Montgomery county. D+17

CD8 (Slate Blue): W88 B6 O44 M54 Western Maryland and the less Democratic parts of Montgomery county. PVI R+9  

8-0 Maryland, Re-revisited

This is the third of my diaries on the state of Maryland. What I have found is that there are many, many ways to draw the state of Maryland with eight Democratic seats. There are a couple things that I think any map of Maryland must do, however, in order to have a practical chance of passing:

*Keep the Eastern Shore intact in one district, to avoid upsetting the Shore legislators

*Give all Democratic incumbents a district that they would be okay with. None should have to move to represent a new district.

*Make sure that the district drawn for Frank Kratovil is one where he can win the primary. The last thing we want is to put in too much of Prince George County or Baltimore so that a liberal from those areas who cannot win the general makes it out of the primary.

*And of course, keep all districts Democratic, except for the district where Kratovil runs which should be around PVI EVEN so that he wins it.

Here are some possibilities I have come up with to accomplish those goals.

Option 1


The 8th and 6th show the familiar pattern; 8th taking the panhandle, 6th stretching into Montgomery. The 8th is 61/37 Obama and the 6th is 59/39 Obama. The 4th stretches up all the way to Carroll county now to pack in Republicans. This is terribly ugly, but the district is still 31%W/53%B/11%H and 76/23 Obama. The Carroll and western Howard county parts of the district are very white and Republican, but they do not have enough population to really make Edwards uncomfortable. Steny Hoyer’s 5th district located in eastern PG county, Anne Arundel co, and South Maryland is 60/39 Obama. The 7th district takes in some Republican areas in Anne Arundel county, making it 51%B/42%W and 68/31 Obama. The 3rd district stretches from the Baltimore county suburbs where Sarbanes lives through Howard County down to some of the most white areas of Northern PG county that were in the old 5th. It is even more Democratic than before, 62/36 Obama. The population base of this district is now in Howard county. This should be fine for Sarbanes as most of these areas are used to being represented by Baltimore representatives, but it does show that it would probably be a good idea for Sarbanes to move to Howard county in the long run, especially if he sees a statewide run in the future. This is even more true with the rapid growth in Howard’s population, as indicated by the last census. The 2nd district balances out some conservative areas in Baltimore and Harford counties with some white liberal areas in Baltimore city. It is 58/39 Obama, which represents a shift of <1% from before. Given that Ruppersberger won with 64% in 2010, he should be fine here, especially given that this district contains a lot of conservative Democrats who vote Republican nationally but Democratic locally so it is more Democratic than the Obama numbers suggest. The 1st district, drawn for Frank Kratovil, takes in the Democratic areas of Harford county and some majority-black, heavily Democratic areas in Baltimore County. It is 52/46 Obama, which I believe Kratovil should definitely win.

Option 2


This map makes extensive [ab]use of trans-Chesapeake water contiguity, giving the 1st some Democratic precincts up and down the Chesapeake, including drawing it straight into the city of Baltimore with no land connection. In this plan, the 1st is 52/46 Obama. The one potential advantage to this is that because the Democratic primary vote is split up between different areas instead of being concentrated in a single area, no liberal Democrat with a base in one area could upset Kratovil in the Democratic primary. The 2nd is 58/40 Obama, which again is a one point shift to the GOP from the current district but not enough to affect Ruppersberger given the landslide margins he has won by (and probably not enough to make it much more competitive in an open-seat election, either). The 3rd has the same partisanship it currently does, 60/39 Obama. It is much more of a Baltimore-area district than my first map, with only a tiny part of Montgomery and none of PG county in the district. The 7th is 51%B/43%W and 65/34 Obama, which is incredibly Republican for a majority-black district in Maryland. Steny Hoyer should be happy with this map, as it makes his district 69/30 Obama. Donna Edwards gets some Republican areas of Anne Arundel packed into her district, but it is still 72/26 Obama and 33W/50B/12H. The 6th and 8th are both 60/38 Obama.

Option 3


This is very similar to the second map, but it eliminates some of the ugliest uses of water contiguity in South Maryland by adding one some Democratic precincts in Anne Arundel and Baltimore city to the 1st. The 1st is now 53/45 Obama and the 7th is now 64/34 Obama, but all the other districts are the same. This is definitely my favorite of the three.

I’m interested to hear any potential problems that you think these maps have. I still strongly believe that it is possible to draw an 8-0 map of Maryland that all incumbents are okay with, even if it requires some very creative drawing like this.

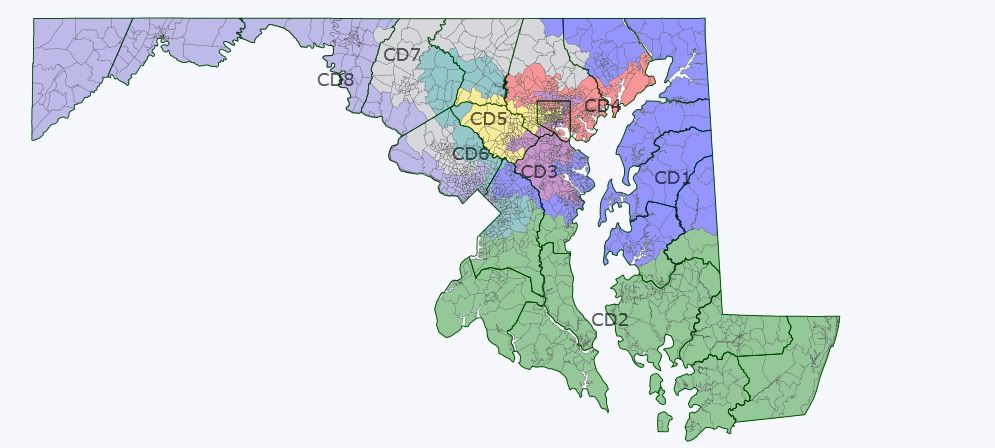
Another 8-0 Maryland

Here is my take on an 8-0 Maryland. I must thank abgin for this incredible inspiration of using stripe-style gerrymandering (the famous map he did of NY). I employed this technique in reverse – I asked myself, how can I link all of these heavy Dem areas to Republican areas to dilute their votes? I thought of where their votes are concentrated, and the biggest source is Northern Maryland and the Baltimore Suburbs.

So, I set out to link Dem heavy areas to Republican areas in Northern Maryland, and it worked well. The map is not too bad looking, although Ruppersberger and Sarbanes would have trouble fitting into this map, but they can move. Hoyer and Van Hollen would have decent district and maintain a lot of their territory. Barlett and Harris are completely drawn out, and I managed to make two VRA districts that are 51% black, while they take in as many heavy R precincts as possible in Northern Maryland the Baltimore Suburbs so they can leave liberal white areas and other AA areas to shore up other districts.

I wanted the Obama-McCain lean to be roughly 60%-40%, and I did well in that regard, I think only one is 57% Obama and the rest are over 58% Obama, so all districts are around D+5 to D+8, with the VRA districts being more Dem heavy. The only district I think that would be in trouble would be the Eastern Shore based one, but if Kratovil runs, it is his. So, here you go!

Below is the state as a whole. The CDs aren’t numbered well on my map, since I ended up editing a lot, so I’ll just leave the CD numbers off the map and make different numbers.

CD1 in Perriwinkle: Panhandle. Hagerstown, Frederick, Potomac – This district is similar to the ones others have posted to make this district less friendly to Barlett (currently the 6th.) There is no way he would win this district. This has much of Van Hollen’s 8th district, so I would assume he would run here. If he doesn’t live here, the move isn’t far. (Pictures are below)

Obama:59% McCain:40%

White:70% Black:10% Asian:9% Hispanic:8%

CD2 in Grey: Silver Spring and DC burbs extending to Northern Border – The worst thing about this district is that there seems to be no clear incumbent here. Cummings would move to a VRA district, Van Hollen would want the 1st (he could take this if he wants too I guess, his choice) so I suppose this would be a new Democratic Representative. Bartlett could try running here, but I doubt he’d come close. Fairly neat looking district.

Obama:60% McCain:38%

White:61% Black:13% Asian:8% Hispanic:16%

CD3 in Dark Green: College Park, Columbia and the Northern Border – Takes in heavily Dem areas in the DC burbs, through Columbia and then sucks up heavily R areas up north on the border. This district also presents a huge problem for current reps. I guess Ruppersberger may be willing to make the move… Cummings again wouldn’t be here, and there really is no one else who I can see running here.

Obama:59% McCain:39%

White:55% Black:24% Asian:8% Hispanic:11%

CD4 in Green: Eastern DC suburbs stretching to Baltimore Suburbs – The challenge I had with this map in general was diluting suburban Baltimore while keeping two majority black districts. This was one part in solving that problem. I was able to keep this 51% AA while stretching it from heavily AA precincts outside of DC to heavily Republican areas South and East of Baltimore City.  This district does take a lot of the AA territory from Donna Edwards current district, MD-4, so she should run here and be safe.

Obama:72% McCain:27%

White:41% Black:51% Asian:2% Hispanic:5%

CD5 in Purple: Southern Maryland to Annapolis– This district pretty much drew itself after the two black majority districts were drawn. I could take remaining AA precincts outside of DC, pull them in with rural more R leaning areas in Southern Maryland, then bring them to Annapolis naturally. Steny Hoyer would have a lot familiar territory, but now he gets Annapolis and AA areas outside of DC instead of areas NE of DC. Still should be a fairly easy hold for him.

Obama:60% McCain:39%

White:62% Black:30% Asian:3% Hispanic:4%

CD6 in Yellow: Northern Baltimore, Baltimore Suburbs, down to liberal areas northeast of DC– One of the nastier districts, this links two areas of Dem strength leftover from other districts – liberal areas between DC and Baltimore, and northern parts of Baltimore itself. I was able to perfectly combine these, while incorporating Baltimore burbs to dilute Republican votes while keeping this district solidly Dem leaning. Maybe Sarbanes would move to this district? Or Ruppersberger? Those two really are the odd men out in general. since their current districts are disgusting. If they want their jobs with this map, they need to move.

Obama:58% McCain:40%

White:63% Black:26% Asian:6% Hispanic:4%

CD7 in Blue: Western Baltimore City, Baltimore Burbs and Rural areas in Northern Maryland. – I had a hard time trying to keep this at 51% black while at the same time sucking up as much anti-Obama votes as possible. To do this I had to find the anti-Obama votes (much like abgin did in NY, where he drew all districts to NYC to find Dem votes.) Once I adopted that strategy, I was able to do the wrap-around kind of districts near Baltimore for CD6 and CD7 in my map. This naturally gave way to making all districts have a north-south orientation in order to dilute Republican strength in Rural North Maryland. Cummings keeps a lot of his old territory in Baltimore, so this district would fit him nicely.

Obama:71% McCain:27%

White:42% Black:51% Asian:3% Hispanic:3%

CD8 in Red: Eastern Shore stretching to Baltimore City– I’m sorry I divided you into 4 pieces, Baltimore. But Kratovil would love this district. It is fairly Democratic, even someone more liberal than Kratovil can win here. But this would be a perfect fit for him. Harris would never win. I did use a tiny, TINY bit of water contiguity near Perryville where the shore meets to mainland in a U-shape (you can kinda see it, its not too bad.) I did this to keep the district from having to take in a couple R-heavy precincts, and the district honestly doesn’t look any worse than any MD district currently.


Obama:57% McCain:42%

White:66% Black:27% Asian:2% Hispanic:3%

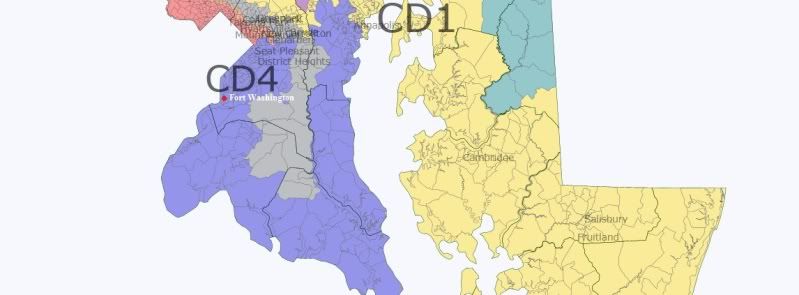
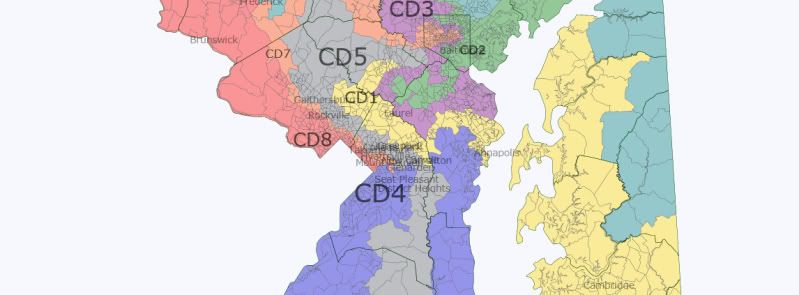
Redistricting: A Maryland Monstrosity (7-1 Dem Map)

Maryland, my Maryland. The Democrats currently have a 6-2 edge in representation in this fairly blue state, and with redistricting just around the corner, the question on Democrats’ minds is how can we make this an even larger edge? An 8-0 map has seemed impossible to make where it would sufficiently protect the incumbent Democrats, although I’m confident that someone will make one. I know there have been recent attempts but those created an essentially perfect swing district in MD-01 to get us to 7-1 (or 8-0).

My goal is to create a 7-1 map where MD-01 is sufficiently blue so that a moderate Democrat like Frank Kratovil can retake the district and hold it while accounting for:

1.Based on Nathaniel90’s recent “Redistricting Outlook” that discussed Maryland, it appears that I need to keep two minority-majority black districts while I pursue the goal of 7-1.

2. Keeping the Democratic incumbents’ hometowns in their respective districts (I actually ended up drawing both Republicans out of their residences).

3. Increasing the partisan advantage of the more “vulnerable” incumbents.

As for how this map turned into a monstrosity…When you add together the sandbox atmosphere of Dave’s Redistricting App with the already crazily drawn districts in Maryland, you can end up with an absurd map like this one.

NOTE: I used the new population estimates with voting precincts.

So here’s what I came up with:

Photobucket

Clearly, there are some ridiculous districts on this map. But let’s break them down.

MD-01 (Yellow)

Naturally, we’ll start with MD-01.

Photobucket

Here’s the data on Mr. Kratovil’s old and hopefully new district:

Photobucket

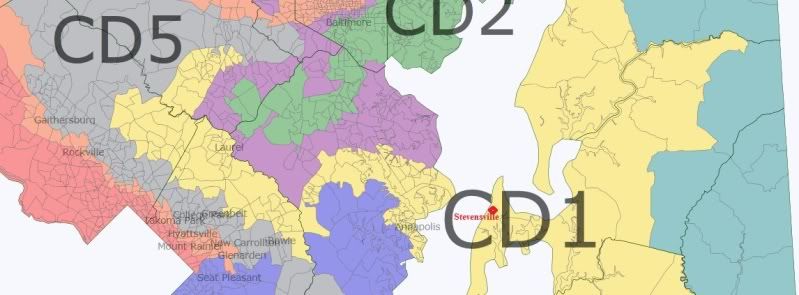
A zoom in on this district’s mainland “hook”:

Photobucket

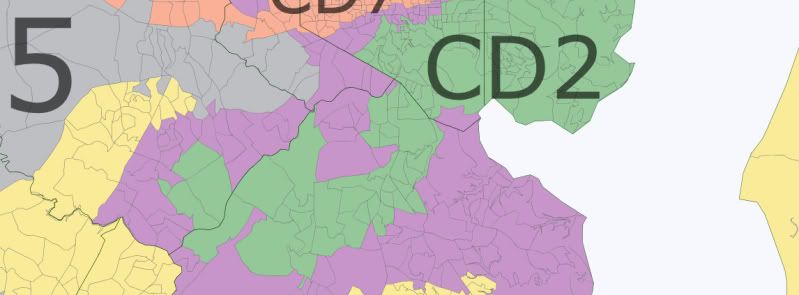
Based on Wikipedia, the old PVI for this district was R+13. With the President’s numbers from 2008, the new district would be a solid D+5, thus very winnable for a candidate like Kratovil (whose hometown Stevensville is shown above). Most importantly, Kratovil’s hometown is in this district whereas GOP incumbent Andy Harris’ is not (it’s in the new 7th and he would have to challenge Elijah Cummings to return). The only question mark about this district is whether or not crossing the Chesapeake Bay allows the district to still be considered “contiguous.”

MD-02 (Green)

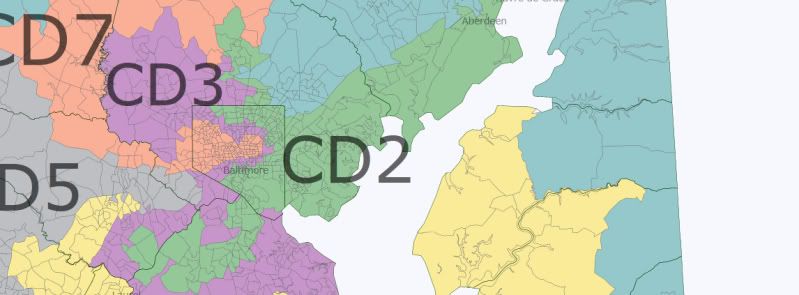
Now, for MD-02. Dutch Ruppersberger’s new district looks like this:

Photobucket

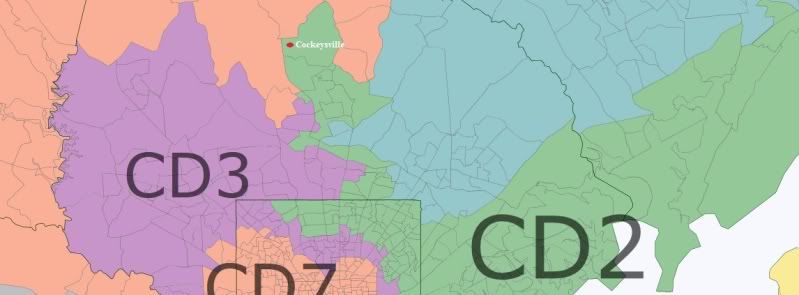
The most north-central part stretches up to snare Cockeysville, Ruppersberger’s hometown (Andy Harris lives somewhere in the vicinity as well because his hometown is listed there, too). The rest of the district is based somewhat on his current set up except that now his seat is even more secure. The data:

Photobucket

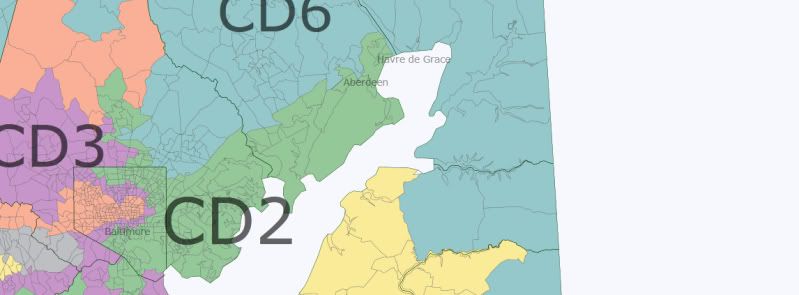
Some more pictures of the new MD-02. Here’s the most northern part so you can actually see its fullest extent:

Photobucket

The central part where Cockeysville is:

Photobucket

And the southern section:

Photobucket

MD-03 (Purple)

Now, the other non-minority-majority Baltimore district, MD-03. Incumbent John Sarbanes is fairly safe but I’ve made his work even easier.

Photobucket

And the data for MD-03:

Photobucket

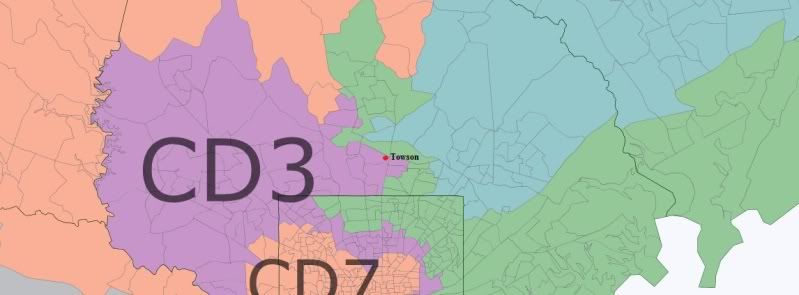
While I know which district on this redistricting map is the “worst,” this one is certainly competing for the second most meandering. Like Ruppsberger’s hometown, Sarbanes’ Towson is barely in his district.

Photobucket

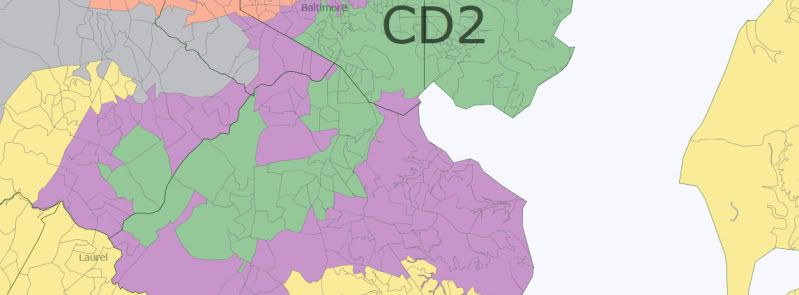
And the most southern part of the MD-03, curling in with MD-02 and MD-01:

Photobucket

MD-04 (Blue)

Moving on, we have MD-04, represented by Donna Edwards. It’s the first minority-majority district to discuss. Basically, much of the district is Steny Hoyer’s old district, forming a large U from D.C. to suburban Annapolis for reasons to be explained shortly in the MD-05 (gray) section. Edwards lives in Fort Washington, so that’s not an issue.

Photobucket

The data for MD-04:

Photobucket

Fifty-one percent African American puts it over the hump for continuing to be a minority-majority district. Although it loses some PVI, it had plenty to lose in the first place.

MD-05 (Gray)

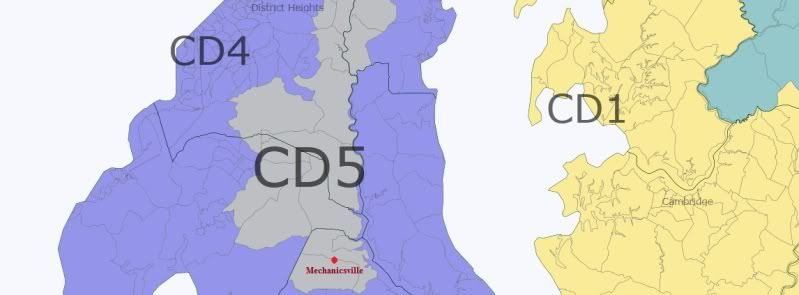
Originally when I was drawing up this map, I gave Donna Edwards all of southeastern Maryland because I thought Steny Hoyer lived closer to College Park. Turns out his home is in Mechanicsville, and I don’t think you can draw the Democratic Minority Whip out his district. Thus, the even more extended nature of his district, which I had going into the suburbs of Annapolis first. Now Edwards goes there and Hoyer stretches down to his hometown.

Photobucket

More specifically, the southern part of the district and Hoyer’s hometown:

Photobucket

Hoyer’s district, like the prospective MD-01, crosses through the D.C. suburbs and stretches northwest. That stretch looks like this:

Photobucket

The northern-most part looks like this:

Photobucket

And MD-05’s overall result? A safer district for Steny:

Photobucket

MD-06 (Teal)

Now for the lone safe Republican seat on this map. The giant L of a district has to violate any rules about compactness but it sure isolates the Republicans. As Roscoe Bartlett lives in Frederick, this map actually draws him out of his district because Frederick is now in Chris Van Hollen’s MD-08.

The western part of the district:

Photobucket

And the eastern part:

Photobucket

MD-06’s data:

Photobucket

MD-07 (Orange)

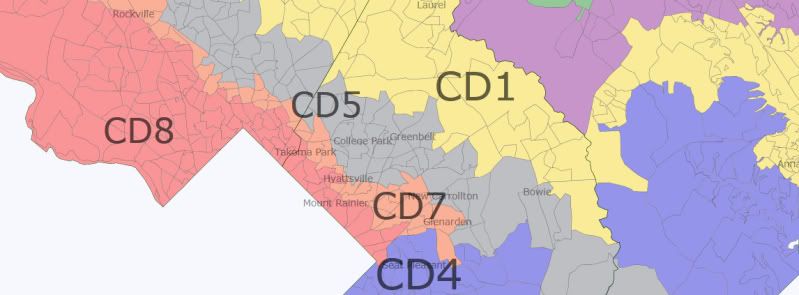
People are going to ask how in the hell did I end up sending this district from central Baltimore all the way to Prince George’s County. Basically, I was having trouble keeping the 7th over 50% black because it is the other minority-majority district. My original draw out had made MD-04 nearly 60% black so I decided I would “steal” African American voters from it, and at the same time I could leave more of the less-black Democratic areas of greater Baltimore to Sarbanes and Ruppersberger. At the same time, I managed to eat up a lot of blank GOP space that wouldn’t have to go into Hoyer or Van Hollen’s district as I stretched it west. I also drew Andy Harris into the 7th, forcing him to either move or find something else to run for. The end result was the “claw.”

Photobucket

Obviously, this would seem to break any rule on “communities of interest” as we’d have central Baltimore coupled with part of Laurel in suburban D.C. But it satisfied the minority-majority clause as we can see from the data:

Photobucket

The northern part of the district:

Photobucket

The narrow stretch curling down into greater D.C.:

Photobucket

And the suburban D.C. area:

Photobucket

MD-08

Lastly, we have Chris Van Hollen’s MD-08 which now stretches well beyond suburban D.C. all the way to Hagerstown, capturing the few very Democratic areas in Frederick and Hagerstown.

Photobucket

In the southern part of the district, it mixes in with MD-04 and MD-07:

Photobucket

And lastly, MD-08’s data:

Photobucket

In conclusion, here is the data from all eight districts:

Photobucket

Thanks for reading!