AL, HI, MO, NV, UT: Population by CD

(Bumped – promoted by DavidNYC)

The Census Bureau unleashed population data from five more states today. First off is Alabama, who remained at seven seats (although they were close to losing one). Their target for 2010 is 682,819, up from about 635K in 2000. Most of the action looks to be in the Birmingham area, where suburban AL-06 was the big gainer and urban VRA district AL-07 was the big loser. While the knee-jerk expectation would be that AL-07 would simply extend out into the suburbs to make up that deficit, it’s likelier that the newly-GOP-controlled legislature will try to extend AL-07 to Montgomery or Huntsville (or both) to incorporate the African-American populations there, in order to make it blacker and the state’s other districts safer for white Republican representatives.


District Population Deviation
AL-01 687,841 5,022
AL-02 673,877 (8,942)
AL-03 681,298 (1,521)
AL-04 660,162 (22,657)
AL-05 718,724 35,905
AL-06 754,482 71,663
AL-07 603,352 (79,467)
Total: 4,779,736

Hawaii is pretty drama-free; its new target is 680,151, up from 605K in 2000. With Maui as the fastest growing part of the state, the 2nd will need to give a little population to the 1st, although the boundary movement will happen in the suburban parts of Oahu.


District Population Deviation
HI-01 658,672 (21,479)
HI-02 701,629 21,748
Total: 1,360,301

Missouri missed the cut, and needs to lose one of its nine seats. Based on eight seats, its new target is 748,616, up from 622K in 2000. Missouri redistricting isn’t going to go well for Dems (and for Russ Carnahan, in particular) because the three districts with the lowest population are the three districts with Democratic representatives. While MO-01 lost the most population, the VRA will probably keep this in place as a black-majority district for Lacy Clay: the city of St. Louis’s population has shrunk so much (now only 319K) that it only makes up about half a district anymore, and his district already includes the city’s black-majority northern suburbs, so it’s likely to have to move westward into the inner-ring suburbs of St. Louis County or else southward to encompass all of St. Louis city. Either way, that’s coming out of Russ Carnahan’s MO-03, which will also need to give some ground to MO-08 below it.


District Population Deviation
MO-01 587,069 (161,547)
MO-02 706,622 (41,994)
MO-03 625,251 (123,365)
MO-04 679,375 (69,241)
MO-05 633,887 (114,729)
MO-06 693,974 (54,642)
MO-07 721,754 (26,862)
MO-08 656,894 (91,722)
MO-09 684,101 (64,515)
Total: 5,988,927

I think we’ve found the most populous CD in the entire nation: NV-03, with more than a million people (its main rival for that honor, UT-03, didn’t break that mark; see below). Nevada, of course, is moving to four districts, with a target of 675,138 (up only slightly from 666K in 2000, but that was a three-district map). As you might expect, the state has become significantly more Hispanic, with the 1st going from 28% Hispanic in 2000 to 37%, the 2nd from 15% to 20%, and the 3rd from 16% to 23%.

While there had been discussion of Joe Heck’s district expanding outward to take in some of the rural counties, that will barely need to happen. Clark County (where Las Vegas is) has a population of 1,951,269, which is 72.3% of the state’s population (up from 68% in 2000). In other words, with 3/4s of the state’s population in Clark Co., NV-02 can pretty much continue being all of the state except Clark County (although it’ll need to lose its current small portions in Clark Co.), while Clark Co. will be divvied up among three districts instead of two. (Although, considering how empty the cow counties are, that stray 2.7% of the state may still wind up occupying a huge geographical footprint.)


District Population Deviation
NV-01 820,134 144,996
NV-02 836,562 161,424
NV-03 1,043,855 368,717
Total: 2,700,551

Utah, of course, is also set to gain a seat. Its new four-seat target is 690,971 (the target was 744K in 2000, when it had three seats). The biggest growth was in Salt Lake City’s southern suburbs and also in the Provo area further south, both of which are found in UT-03. Whether the GOP-controlled legislature creates a new seat confined to the SLC area or tries cracking it four ways instead of three will depend on whether they decide to target Jim Matheson (currently the Democrat with the reddest House seat) or concedes a seat to him.


District Population Deviation
UT-01 906,660 215,869
UT-02 890,993 200,022
UT-03 966,232 275,261
Total: 2,763,885

Mini Redistricting Challenge: Alabama

Diarist roguemapper has a great post up featuring the creation of new majority-minority VRA districts in several southern states. I like these maps, but I don’t expect the Obama DOJ to be this aggressive in requiring new maj-min seats – and I also think that many southern legislators probably won’t be interested in drawing lines like these. As most Swingnuts are aware, heavily black districts have operated as Democratic vote sinks for two decades now, helping Republicans win seats abruptly depopulated of reliable blue votes. But with the southern realignment finally complete, I don’t think there are too many GOP officials in Alabama, for instance, who think they can’t easily hold 6 of 7 congressional districts.

In fact, this is exactly what the Republicans are planning on:

The likely result is a new congressional map that protects all six Republican congressmen and keeps intact the majority black district home to the only Democrat, according to U.S. Rep. Mike Rogers, R-Saks.

So the challenge to you is to create a map that packs as many African Americans into a single district in Alabama as you possibly can. No rules, and no prizes other than bragging rights (or maybe a job working for the Republicans on the redistricting committee). I figure there are three rough categories, though: compact (aka goo-goo fetishist-style), ugly but beautiful (aka abgin-style), and supremely ugly with touch-point contiguity (aka andgarden-style). Post as many entries (in as many styles) as you like.

Have fun, and share your results in comments!

P.S. If for some reason you’ve made it this far but haven’t yet encountered the glory that is Dave’s Redistricting App, well go and check it out! It’s the essential tool for any citizen redistricting efforts.

UPDATE: So far it looks like the most extreme gerrymander belongs to goohiost7, whose district is 81.5% African American.

Redistricting outlook: Alabama-Arkansas

Now that it’s 2011, the redistricting games will soon begin in earnest, with more detailed Census data expected in February or March and some states holding spring legislative sessions to deal with drawing new maps. Long ago I planned to do state-by-state rundowns of the redistricting process as soon as 2010 election results and Census reapportionment were clear. Now that time has arrived, and I’ll go alphabetically, starting with Alabama, Arizona, and Arkansas.

The rest below the fold…

Alabama

Photobucket

Districts: 7

Who’s in charge? Republicans

Is that important? No

Don’t expect too much drama in Alabama, as Republicans seek an incumbent protection map that ensures no Democrat getting elected in the 2nd (represented by Martha Roby) or 3rd (Mike Rogers). The 7th remains a VRA-protected black-majority district, and the only Democratic stronghold in the state.

Arizona

Photobucket

Districts: 9, up from 8 in 2002

Who’s in charge? Nonpartisan commission

Is that important? Oh, yes

Whenever a nonpartisan commission is involved, most (but not all) bets are off. Both Hispanic-majority VRA districts — the 4th, represented by Ed Pastor, and Raul Grijalva’s 7th — will have to be kept majority-minority, and the weird lines in northern Arizona separating the Hopi (in Trent Franks’ 2nd) from the Navajo (in Paul Gosar’s 1st) will remain. But the commission is under no obligation to protect incumbents, and that goes for Gosar, Grijalva, Giffords, Quayle, Schweikert, and anyone else who may face trouble in the next decade. In any case, most observers predict a new GOP seat in the Phoenix area, since Democratic areas are sufficiently concentrated in the 4th and much of the state’s population growth has occurred in conservative suburban Maricopa County.

My prediction: Republicans +1, all things being equal. Multiple incumbent defeats are, however, very possible depending on the new lines.

Arkansas

Photobucket

Districts: 4

Who’s in charge? Democrats

Is that important? Probably not

While Democrats have the redistricting trifecta in Arkansas as they did not in 2002, I cannot imagine them exploiting it particularly well. The trends in this state are as plain as the nose on your face, and Democrats know from rising GOP fortunes both within the Natural State and within all its neighboring states that their days in power are numbered. If anything, they may attempt to strengthen Mike Ross’ 4th District, the only blue seat, but I don’t see them working to dislodge Tim Griffin or Rick Crawford, both of whom represent districts that just ten years ago were considered reliably and ancestrally Democratic. It’s not easy being a Democrat in the South, particularly not the slow-growing Old South consisting of Arkansas, Louisiana, Mississippi, Alabama, et al.

In the next edition: California, Colorado, and Connecticut.

Just Whistling Dixie: Unlikely Pro-Democratic Maps for Four Southern States (AL, KY, LA, VA)

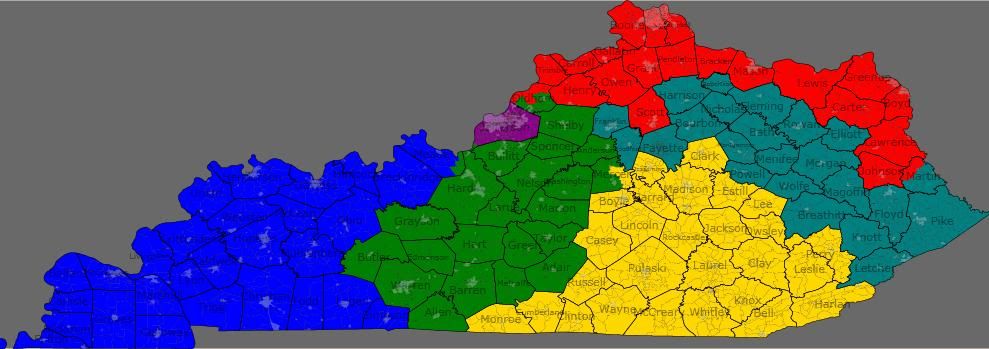
After the jump, I present a survey of maps that are demographically possible if political improbable. They are presented mostly for holiday slow-time discussion fodder. The states covered are Alabama, Kentucky, Louisiana, and Virginia. Republicans will control the process in Alabama; the Democrats control a single house of the legislature in the other three states. So the Democrats are unlikely to get maps as good as these. My redistricting instincts tend towards “good government” aesthetics, so these maps are about what’s possible with relatively compact districts.

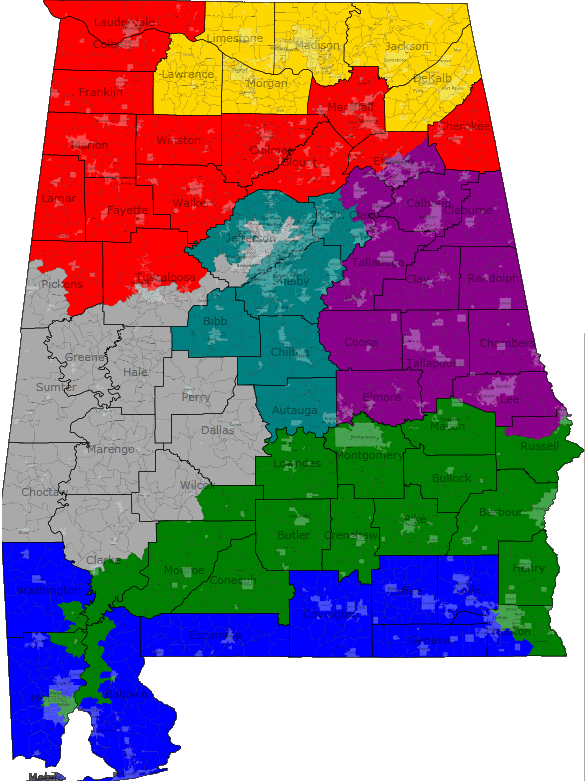
Alabama

Top-line results: 5 R – 2 D. (Neutral year, open seat, quality candidates, my impression)

This map creates two majority-black districts in Alabama, while pushing the Huntsville-based 5th in slightly more Democratic direction.

The estimates in Dave’s App put Alabama at 4.66M people. The actual Census figure is 4.78M.

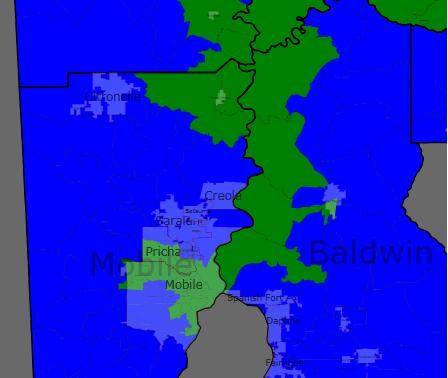
The 1st and 2nd engage in extensive territory swapping with the 2nd. The 1st gains gains the southeastern corner of the state; the 2nd gains much of Mobile proper. This roughly doubles the black percentage of the 2nd, taking it to 53% black, 43% white. Martha Roby should be in trouble. The 7th is very slightly diluted, dropping from 61% to 59% black. Making the 2nd majority black also let me shore up Mike Roger’s 3rd, which lost about 8 points off its black percentage.

In the north, the 5th needed to shrink. Glancing over the last decades worth of county-level results, the eastern side of the district seemed slightly more Democratic than the western side, so I lopped off Jackson County. Mo Brooks would probably still be fine here, but I’d rate this as the district most likely to flip to the Democrats outside of the majority-black ones.

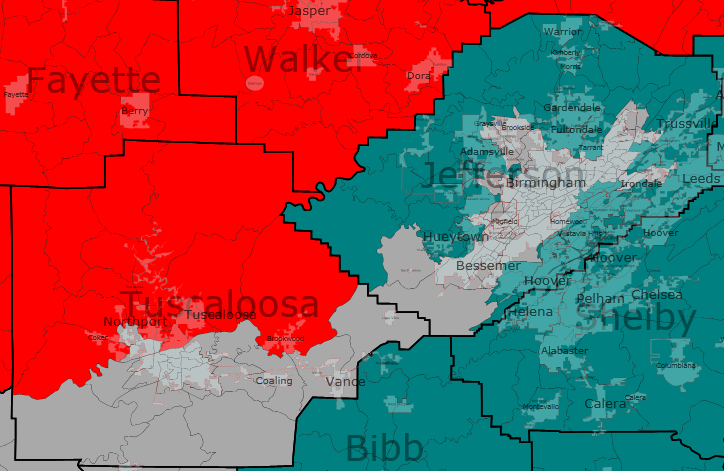
I’m not entirely sure what the Republican will do with their control. The current 4th and 6th are R+26 and R+29 respectively, so a well-executed unpacking of those districts should end shoring up the other four GOP-held districts.

Kentucky

Top-line results: 3 R – 2 D – 1 S (Neutral year, open seat, quality candidates, my impression)

This map shores up Ben Chandler’s 6th district, while pushing the Paducah-based 1st into a potentially swingy seat. (I might be over-estimating Democratic chances there.)

The estimates in Dave’s App put Kentucky at 4.04M people. The actual Census figure is 4.34M.

Looking at recent governor and US senator races, I noticed that the geographically largest areas of Democratic support in Kentucky is in the central portion of western eastern half of the state. That support is currently cracked into parts of three districts. I consolidated that support into Chandler’s 6th (teal), which should go from swingy to solidly Democratic.

In doing so, I forced the 5th (yellow) to the west, eating up areas that are contributing to Republican margins in the 1st (blue). (The new 5th is very Republican — it’s the only district without a single county that went Democratic in either of the last two US Senate races.) This new 1st should be winnable for a Democrat under the right circumstances — for example, by eyeballing it, I estimate that Mongiardo probably won in the 2004 Senate race.

I actually think that my 6th might have a decent shot of being created if the state House Democrats can force incumbent-protection. It’s just that the first will need to be solidified for the Republicans by some territory swaps with the 2nd and 5th.

Louisiana

Top-line results: 3 R – 2 D – 1 S. (Neutral year, open seat, quality candidates, my impression)

This map creates two majority-black districts in Louisiana, while trying to make the Shreveport-based 4th as Democratic as possible.

The estimates in Dave’s App put Louisiana at 4.41M people. The actual Census figure is 4.53M.

The 2nd (green) and 6th (teal) are the intended majority black districts. The actual figures are more like 49.6% in each. The 4th (red) is 54% white, 41% black. I hope that’s enough to make the 4th competitive for the Democrats.

Most speculation I’ve seen indicated the Republicans will be trying to make a single Baton Rouge-to-New Orleans majority-black district. Given the recent rate of party switching in the Louisiana state legislature, I imagine they’ll probably succeed.

Virginia

Top-line results: 5 D – 4 R – 2 S (Neutral year, open seat, quality candidates, my impression)

I originally presented this map in a comment in diary by drobertson. It fits the theme though, so I’m reposting it for consideration. This map is probably the most “good government” of these maps – each district basically corresponds to an existing political/cultural region of Virginia.

Its most notable feature is that presents two plurality black districts in the southeastern part of the state.

The estimates in Dave’s App put Virginia at 7.77M people. The actual Census figure is 8.00M.

1st (blue) – Peninsulas – Obama 46, McCain 54

2nd (green) – Suburban Hampton Roads – Obama 49, McCain 51

3rd (purple) – Urban Hampton Roads – Obama 69, McCain 31 — VRA: 49% black, 42% white

4th (red) – Richmond, Petersburg, and South Virginia – Obama 61, McCain 39 — VRA: 50% black, 44% white

5th (yellow) – Piedmont – Obama 47, McCain 53

6th (teal) – Shenandoah – Obama 43, McCain 57

7th (grey) – Richmond suburbs – Obama 42, McCain 58

8th (slate blue) – Arlington, Alexandria, north Fairfax- safe D

9th (cyan) – southwest Virginia – Obama 40, McCain 60

10th (magenta) – Prince William and Loudoun – Obama 56, McCain 44

11th (lime) — south Fairfax and Manassas – ???

The presidential percentages are back-of-the-envelope style. I used the 2008 figures to the nearest hundred and counted split cities/counties as if they were wholly within the district they were most in. I didn’t feel like delving into Fairfax precincts for the 8th/11th. The 8th should be just as safe as it is now, and I think, though I’m not 100% certain, that this version of the 11th is more Democratic than the current one. (Drobertson questioned this assertion at the time I made it, but agreed that this new district ought to be better for Gerry Connolly if not Generic D.)

The 2nd is more Republican than listed, but I don’t know how much more. I counted Isle of Wight and Suffolk as if they are wholly in it, but they are both donating their most heavily black precincts to the neighboring 4th and 3rd, respectively.

There’s a similar dynamic for the 4th and 7th, which are probably even more firmly in their respective parties’ control than it appears. I counted all of Richmond and Henrico in the 4th, but the majority white parts of each are actually in the 7th.

Notes on incumbents: Wittman, Scott, Cantor, Goodlatte, Moran, and Connolley are all fine. Rigell and Forbes would share the 2nd. Hurt lives in the new 4th. Griffith lives in the new 6th. Wolf lives in the new 8th. I assume all three of them would continue to run in the same districts anyway — all of them are in counties adjacent to their districts.

In the real world, the Virginia state senate Democrats should be able to force incumbent-protection, but seperating Richmond from Hampton Roads for two black opportunity districts won’t be happening.

Redistricting Roundup: 11/10

Redistricting will undoubtedly be a top – if not the top – topic around here over the next year or so. To get your engines started, here are a few early items from around the nation:

  • Indiana: Gov. Mitch Daniels released his list of legislative priorities for 2011, and it looks like he’s trying to burnish his bi-(or non-)partisan cred with this plank:
  • “Indiana must have a fair redistricting based on geographic and community of interest lines – not politics. And I’ll only sign one that meets that test.”

    Daniels’ commitment will be seriously tested on this part of his platform, seeing as the GOP now controls both houses of the state lege (in addition to the governor’s mansion, of course). Incoming House speaker Brian Bosma also claims he’s a supporter of such reforms. We shall see.

  • Alabama: Meanwhile, down in Alabama, Republicans also control the trifecta – and seeing as it’s their first time, they’re licking their chops. As the Birmingham News puts it:
  • The likely result is a new congressional map that protects all six Republican congressmen and keeps intact the majority black district home to the only Democrat, according to U.S. Rep. Mike Rogers, R-Saks.

    Here’s one stab at such a map. Can you do better?

  • Illinois: The upper hand is on the other foot in Illinois, one of the few redistricting bright spots for Dems. With Team Blue in charge of the trifecta here – and the Prairie State on track to lose a seat in reapportionment – the only question is which Republican freshman will get tossed in the woodchipper. Sadly, we have quite a few to pick from: Randy Hultgren, Adam Kinzinger, Bobby Schilling, Jim Walsh, and Bob Dold! But it’ll still be satisfying to see one of these guys get axed. (And if we’re really lucky, two of `em will get tossed into a single district together.)
  • New Jersey: For whatever reason, New Jersey chooses to be a freak state, holding its state-level elections in odd-numbered years. This is good news for horserace bloggers, but probably a pain in the ass for the folks in charge of drawing state lege district lines. They have to produce a map by Feb. 1 – which is barely a month after the Census Bureau will releases its state-level population data, and a month or so before they release redistricting-level data. In any event, I suggest you read the linked story, which details how Dems succeeded in getting a very favorable map ten years ago – circumstances which are unlikely to obtain this time around.
  • Dave’s Redistricting App: I realize there are quite a few new SSP members these days, so it’s possible not everyone is familiar with the awesome (and free!) Dave’s Redistricting App. It does exactly what it sounds like it ought to do – you can draw and re-draw maps to your heart’s content. The eponymous Dave often stops by in comments and with diaries of his own, in case you ever have questions. He’s also always looking for assistance in compiling partisan data for the app, so if you want to help improve the program, please click the link to find out how!
  • Alabama Runoff Results Thread

    11:16pm: Move over, Sarah Palin and Jim DeMint, because the GOP has a new kingmaker, and his name is Dale Peterson. With John McMillan haven gotten the Peterson Bump, he sent Dummy back to his chicken farm, 52-48. (That’s with 2800 out of 2804 precincts reporting, although there’s still no call from the AP. Because they’re thorough like that.) (Um, with that, I think we’re going to call it a night.)

    10:10pm: In what I’m sure is a case of a late-breaking surge of former Dale Peterson supporters, John McMillan has pushed into the lead in the Agriculture Commissioner GOP primary, 51-49, over that sign-stealing cur, “Dummy” Dorman Grace.

    10:05pm: In case you’re wondering, Sewell will face off in November against Donald Chamberlain, who won the AL-07 GOP runoff over C. Salter 57-43. In other news, congratulations to future Rep. Terri Sewell.

    10:02pm: And with about 80% reporting, the AP has finally called AL-07, in favor of Terri Sewell. She wins 56-44, after outspending Shelia Smoot almost 10:1.

    10:00pm: This is way down in the weeds, but the delightfully-named Twinkle Cavanaugh has won the GOP runoff for Public Service Commission Position 1, 61-39.

    9:56pm: At the federal level, that leaves just AL-07. And with Shelia Smoot losing Jefferson County 53-47 (that’s the county where she’s a Commissioner), that doesn’t bode well for her chances.

    9:52pm: And hot on the heels of that, the AP calls AL-02 for Martha Roby. She’s at 61%, over Rick Barber, and she’ll face Bobby Bright in November. In the meantime, Zombie Lincoln must cry himself to sleep tonight, his nation condemned to health care slavery.

    9:49pm: The AP has called AL-Gov for Robert Bentley. He’ll face Ron Sparks in the fall.

    9:33pm: Looks like more whimper than bang. Bentley 57, Roby 61, Sewell 54.

    9:20pm: With 30% reporting, Bentley is crushing, 56-44. So is Roby (22% in), 58-42. Sewell (20% in) has widened her lead to 55-45.

    9:09pm: Bentley up by more than 7 points now with 15% in statewide.

    9:08pm: More results are coming in. AL-07 has shot up to 15% reporting, and the race has tightened to 53-47 Sewell.

    9:00pm: Time, fortunately, appears to have resumed its forward progress. With 7% in, Bentley has a 59-41 lead. With 6% in, Roby is at 72%. AL-07 still stuck on 2%.

    8:45pm: Some eleven-dimensional superstrings have wriggled a few AL-07 results into existence – for now. Terri Sewell leads Shelia Smoot 57-43 with about 2% (maybe???) reporting.

    8:42pm: Hahah – this has been pretty funny. Now we’re down to 1% in AL-Gov, but the vote totals actually keep increasing. Bentley leads 62-38, 2,727 to 1,666 votes. Forget about a ganja break – this has been more like an LSD break.

    8:37pm: The DeLorean has hit 88mph, because we are travelling BACK THROUGH TIME. The AP is now down to less than 2% reporting in the gov race, or as I like to call it, the Curious Election of Benjamin Button.

    8:30pm: Hmm, wonder if that was an error on the AP’s part. We’re now down to just 3% reporting, with a 56-44 Bentley lead. Over in AL-02, 1% is reporting, and Martha Roby has a 69-31 lead over Rick “The Barber” Barber. Nothing in AL-07 yet.

    8:19pm: A teeny trickle of results are in so far. With 7% of precincts reporting, Robert Bentley has a 52-48 lead over Bradley Byrne in the gov race – though that translates to just 718 votes to 653.


    We’re watching runoffs in a trio of Alabama races tonight: AL-Gov & AL-02 on the Republican side, and AL-07 on the Democratic side. Polls closed a few minutes ago, at 8pm Eastern.

    Results: Associated Press | Politico

    Alabama Legislature

          The Alabama legislature has been known to be one of the conservative legislatures in the nation. The democrats have maintained control of both chambers continuously for over a century. That said while these democrats tend to be pretty conservative they still tend to be more populist and left leaning on certain economic issues compared to their Republican counterparts. For a state that has only voted for one democratic president(Carter) in the last 50 years, it is amazing to see the local level under so much democratic control

       It looks like it will be real battle to hold both of these chambers this year. For the longest time I thought it was a miracle that this legislature has remained in democratic hands for so long. That was until I noticed  that 60% of the democrats were first  elected over 15 years ago some as much 30 years ago in the senate. The house is slightly better with only 40% of the dems first elected over 15 years ago.

        The senate right now is barely on the Dem turf. A couple years ago back in 2007, when there were more dems in the chamber, there was a coalition of Republicans and disaffected Democrats to elect leadership that would be more favorable to Republican Gov. Riley. The coalition was barely defeated 18-17! But it showed that democrats could still muster an offensive against the republicans even in a state like Alabama. This was a decisive win for the interesting power play that had been going on in the state. The lieutenant governor serves as the president of the senate. When a republican was elected to this position the Democrats in the senate moved to transfer most of that power to their Senate president Pro-temp(who was elected by their caucus).

        In the following 2008 elections (plus the special elections) Republicans continued to eat away at the Dem majority in the senate. But Jim Folsom Jr., a democrat, was elected to the position of lieutenant governor. The democrats in the senate then tried to restore much of the power back to the Lieutenant Governor (I don’t know if they were successful).The move made sense as I’m sure there enough republicans and disaffected Democrats to elect a leadership more favorable to Governor Riley this time around.

    Democrats chances of holding  the senate look bleak when you look at the numbers. Dems control the chamber 20-15.  A mere 3 seats are all it takes to switch control.  That’s not to say that the Dems can’t pick up seats.  Parker Griffith for example won seat by defeating an incumbent Republican 66-34 which was an impressive result in the south( Where Dems tend to bleed more seats than win them; on top of the fact that the few seats we win, tend to be open/or have an incumbent immersed in a scandal). Griffith then resigned t o run for congress and his senate seat reverted back to republican just as his affiliation would later in the house). There seems to be a theme of a popular conservative Dems  winning against republicans only to make the switch later down the road. The same thing happened with Dick Shelby( who was the last democrat to defeat a sitting republican senator). It will really come down to which incumbent democrats chose retire and the year they were first elected. The more recent they incumbent was first elected (such as mid 2000’s) the better the chance we can hold these seats.

       The state house looks slightly more favorable to hold. Looking at the numbers the Dems control the chamber with a 60-45 advantage. It takes 8 seat pick-up for the Republicans to win control of this chamber.  There are quite a few open seats for Democrats to defend including the current Speaker who was elected in the late 1970s.  The Tennessee state house also had similar margin of control prior to the 2008 election. So nothing can be taken for granted. This chamber is as most pundits have said tossup at best.

        Now why do I feel this chamber is important to control? Well mainly because the Alabama dems in the legislatures are the only thing standing between governor Riley/the republican party from having the trifecta in this state. These races along with the open governor’s race are what control the redistricting map for the next 10 years. If Bobby Bright does survive his tough race this year his next race will ultimately depend which party is in power in this state.

    It ‘s only a matter of time when the republicans take over both chambers as many of the Dem legislators who were first elected in the 1970s finally retire (much like the NY Senate in reverse). A lot on who controls the chambers will depend on how well Ron sparks does in his governor’s race.  His coattails could be the difference between Republican controlled of the legislature and one controlled by the Democrats. Tensions have also been high in this chamber as just a couple years ago there was a little fist fight in the senate.  http://www.youtube.com/watch?v…

    This is my first real diary. Feel free to comment and let me know  if there are any discrepancies

    3 VRA districts in AL, LA, and MD

    I wanted to take a look at what redistricting might look like in three Southern states (Alabama, Louisiana, and Maryland) with large black populations if, within each state, three VRA districts were created. Right now, Alabama has one VRA district, Louisiana has one, and Maryland has two; this diary has maps that raise that number to three in each state. I also wanted to take a look at what the political implications of this would be on a state-by-state basis; would Democrats be hurt or helped by such plans? Please read on to find out more and leave your comments and feedback as well. Thanks!

    Alabama

    Statewide Map
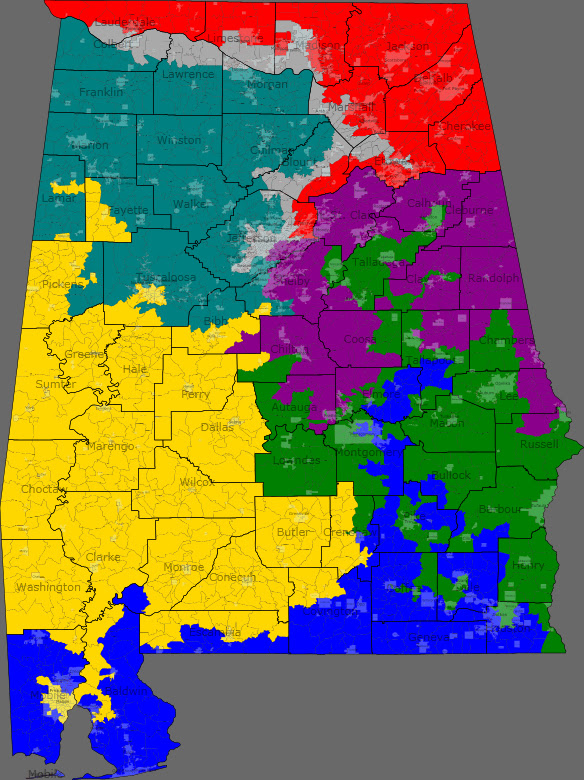
    District 1 (Blue): South Alabama-Mobile, Dothan, Montgomery

    Demographics: 83% white, 11% black

    This is a strongly Republican district that picks up the white parts of South Alabama and then snakes up north past Montgomery. Incumbent 1st district GOP Rep. Jo Bonner would easily win in this district.

    District 2 (Green): South/East Alabama-Dothan, Montgomery, Troy, Auburn

    Demographics: 48% black, 48% white (black plurality)

    This district picks up black areas in South Alabama and Montgomery, and then goes northward all the way to Anniston. This district should be Democratic due to a slight black plurality. While current 2nd district Democratic Rep. Bobby Bright would probably love to have a district like this, he might be vulnerable to a black challenger in a Democratic primary.

    District 3 (Purple): East Alabama and Birmingham suburbs/exurbs-Birmingham

    Demographics: 85% white, 10% black

    This is a very Republican district that essentially combines the eastern half of the current 6th district (Birmingham suburbs and exurbs) with the mostly-white and rural northern areas of the current 3rd district. The homes of two incumbent GOP congressmen, 6th district Rep. Spencer Bacchus (from Vestavia Hills in Jefferson County) and 3rd district Rep. Mike Rogers (from Saks in Calhoun County) are both in this district so they would likely face off in a primary that I think Bacchus would be favored to win.

    District 4 (Red): North Alabama-Florence, Madison, Huntsville, Albertville, Gadsden

    Demographics: 87% white, 6% black

    This is an extremely Republican district in North Alabama that has some of Obama’s worst areas and would be easily won by the probable congressman for the current 5th district after the 2010 elections, Republican Mo Brooks of Huntsville.

    District 5 (Yellow): Southwest Alabama-Mobile, Selma, Greenville, Tuscaloosa

    Demographics: 51% black, 46% white

    This district takes in many of the non-Birmingham areas of the current 7th district in what is known as the Black Belt, and it now reaches down all the way into Mobile. This district has a black majority and would be an open seat almost certainly won by a black Democrat.

    District 6 (Teal): Northwest Alabama, Birmingham suburbs/exurbs-Birmingham, Tuscaloosa, Cullman

    Demographics: 88% white, 6% black

    This would be a safe GOP district that merges the western halves of the current 4th and 6th districts and would likely be won by Republican Congressman Robert Aderholt, who lives in Winston County.

    District 7 (Gray): Urban Birmingham and North Alabama-Birmingham, Gadsden, Huntsville, Florence

    Demographics: 53% black, 41% white

    This black-majority district brings the number of VRA districts in Alabama to three by picking up urban Birmingham and then snaking through North Alabama into Gadsden, Huntsville, and Florence. It will be represented by a black Democrat, probably either Teri Sewell or Shelia Smoot.

    So overall, Democrats will likely gain from this map. While it essentially closes the door on ever winning any of the 4 white majority districts (all of which are now at least 85% white), it creates 3 districts that should easily fall into Democratic control, unlike the current map, which really only has one safe district for Democrats (the 7th district). So we would see a likely change from either 5R-2D (Bright wins in 2010) or 6R-1D (Bright loses in 2010) to 4R-3D.

    Louisiana

    Statewide Map
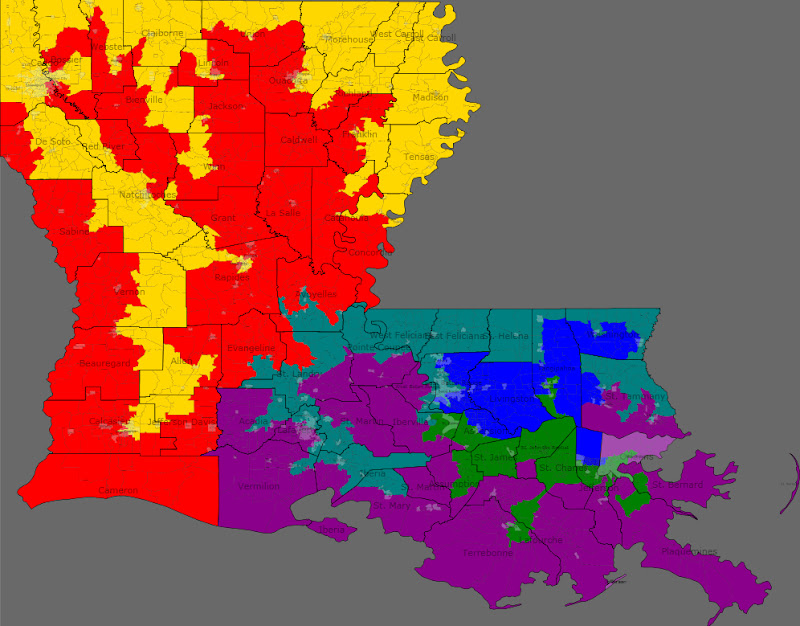
    District 1 (Blue): East Louisiana-Baton Rouge, Hammond, Kenner, New Orleans

    Demographics: 80% white, 11% black, 6% Hispanic

    This is a very conservative and Republican district that picks up white areas between New Orleans and Baton Rouge. Incumbent GOP Reps. Bill Cassidy and Steve Scalise would face off in this district’s Republican primary, and it is about half and half of each of their old districts so neither would really have the advantage of incumbency.

    District 2 (Green): South Louisiana and New Orleans-New Orleans, Hammond, Houma

    Demographics: 52% black, 39% white

    This is essentially a successor to the current black-majority 2nd district, although it must expand south and west to make up for severe population loss from Hurricane Katrina. It retains a black majority, and will easily elect a black Democrat, probably either Cedric Richmond or Juan LaFonta, to Congress.

    District 3 (Purple): South Louisiana-New Orleans, Houma, Lafayette

    Demographics: 80% white, 12% black

    This district has many of the white Cajun areas in the current 3rd district, but now extends to the west to pick up much of Lafayette. This district would likely elect a Republican simply due to its overwhelming whiteness, although there would be a fight in the Republican primary between Hugh Downer of Houma, who will likely be the GOP Rep. for the 3rd district following the 2010 elections, and 7th district Rep. Charles Boustany, whose Lafayette base is now in the 3rd district.

    District 4 (Red): West and North Louisiana-Lake Charles, Alexandria, Shreveport, Monroe

    Demographics: 82% white, 12% black

    This district is intertwined with the new black-majority 5th district, taking up white areas in Western and Northern Louisiana and ending up with only 3 whole parishes, the rest of the parishes in the district being shared with neighboring districts. GOP congressmen Rodney Alexander of Alexandria and John Fleming of Minden (in Webster Parish near Shreveport) would have to battle it out in a Republican primary that Alexander would be favored to win, although either would easily hold the seat in a general election in this heavily white and Protestant district.

    District 5 (Yellow): West and North Louisiana-Lake Charles, Alexandria, Nachitoches, Shreveport, Monroe

    Demographics: 51% black, 45% white

    This new black-majority district snakes around the Mississippi and Arkansas borders and then stretches down all the way to Lake Charles, picking up many black precincts along the way. Perhaps former Congressman Cleo Fields would give it a try in this district, although any black Democrat would be favored to win.

    District 6 (Teal): East and South Louisiana-New Iberia, Lafayette, Baton Rouge, Slidell

    Demographics: 52% black, 44% white

    This is the third black-majority district in the state, taking the black areas of Baton Rouge and Lafayette and the snaking along the border with Mississippi and then all the way down to St. Tammany Parish. It would probably be won by a black Democrat from Baton Rouge or Lafayette.

    So Louisiana is another state where Democrats would benefit from having 3 black-majority districts. The balance of power would shift from 6R-1D to 3D-3R, a three seat loss for the Republicans and a two seat gain for the Democrats.

    Maryland

    Statewide Map
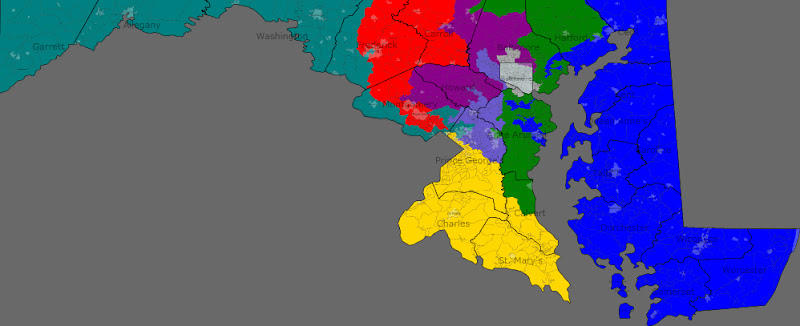
    Baltimore Area Map
    D.C. Area Map
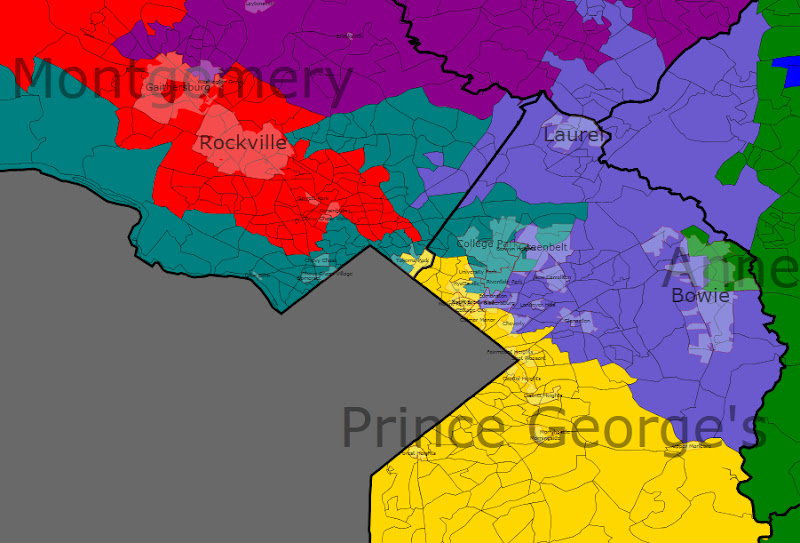
    District 1 (Blue): Eastern Shore and Baltimore, Harford, and Anne Arundel Counties-Annapolis, Aberdeen, Eaton, Salisbury

    Demographics: 74% white, 19% black

    2008 pres. results: 50% McCain-48% Obama

    By trading heavily Republican suburban areas in Baltimore and Harford Counties with the 2nd district for Democratic areas in Baltimore and Anne Arundel Counties, this district becomes much more Democratic. While John McCain still narrowly won this district, Frank Kratovil would have no trouble winning this district as it is now mostly limited to Democratic areas and his base on the Eastern Shore.

    District 2 (Green): Anne Arundel, Calvert, Harford, and Baltimore Counties-Annapolis, Bowie, Dundalk, Bel Air

    Demographics: 86% white, 7% black

    2008 pres. results: 59% McCain-39% Obama

    This is now a heavily Republican district around Annapolis and Baltimore, a result of the creation of a third black-majority district. It was simply not possible to maintain a Democratic 2nd district and still have the three black-majority districts without threatening Democratic control of the 3rd district. As a result, this district was disproportionately packed with Republicans and gave John McCain a 20% margin of victory. We might finally say hello to Congressman Andy Harris, although he would likely be the only GOP member of Congress from Maryland.

    District 3 (Purple): Baltimore, Howard, Montgomery, and Carroll Counties-Gaithersburg, Columbia, Westminster, Towson, Baltimore

    Demographics: 69% white, 15% black, 8% Asian, 5% Hispanic

    2008 pres. results: 56% Obama-42% McCain

    This is a new district that stretches from Montgomery County all the way up to the Pennsylvania border. Both John Sarbanes and Dutch Ruppersberger would likely run in the Democratic primary in this district in order to stay in Congress, although they might split the Baltimore vote, allowing someone from Montgomery or Howard Counties to slip through. A Democrat should win here nonetheless.

    District 4 (Red): Frederick, Carroll, and Montgomery Counties-Frederick, Westminster, Rockville, Gaithersburg

    Demographics: 66% white, 12% Hispanic, 10% Asian, 10% black

    2008 pres. results: 58% Obama-40% McCain

    This map is not all bad news for Democrats, as GOP Rep. Roscoe Bartlett sees his Republican district split in half and replaced with two districts where Obama received 59% of the vote. The new 4th district combines most of the current 8th district’s portion of very Democratic Montgomery County with parts of Frederick and Carroll Counties. It has 8th district Rep. Chris Van Hollen’s home in Kensington and Van Hollen could easily defeat the very conservative Bartlett (who would also be 86 years old by Election Day 2012) in this Democratic district.

    District 5 (Yellow): Montgomery, Prince George’s, Charles, Calvert, and St. Mary’s Counties-La Plata, Waldorf, Clinton

    Demographics: 55% black, 33% white, 7% Hispanic

    2008 pres. results: 78% Obama-21% McCain

    The first of Maryland’s black majority districts, half of this super-Democratic district is made up of areas from Democratic Rep. Donna Edwards’ current 4th district and Chris Van Hollen’s 8th district, while the other half of the district comes from Democratic Rep. Steny Hoyer’s current 5th district. This new district is 56% black and contains Edwards’ base in Prince George’s County, although it also has Steny Hoyer’s base in Southern Maryland and the House Majority Leader would no doubt be difficult to topple in a primary. I think a primary would be very competitive between the two incumbents, so Edwards might decide to instead run in the new black-majority 8th district.

    District 6 (Teal): Panhandle and Frederick, Montgomery, and Prince George’s Counties-Cumberland, Hagerstown, Frederick, College Park

    Demographics: 65% white, 14% black, 12% Hispanic, 6% Asian

    2008 pres. results: 59% Obama-39% McCain

    This district is the second nail in the coffin for Roscoe Bartlett. The conservative rednecks living in the Panhandle are placed in the same district as liberal voters in Prince George’s and Montgomery Counties, and the University of Maryland’s campus in College Park is placed in the district as well. While Van Hollen’s home is in the 4th district, he could easily run here and win, even against Roscoe Bartlett. Former 8th liberal Republican Rep. Connie Morrella would have likely defeated Van Hollen here in 2002 though. I really don’t know which of these two districts Van Hollen and Bartlett would run in, but I think they would both elect Democrats.

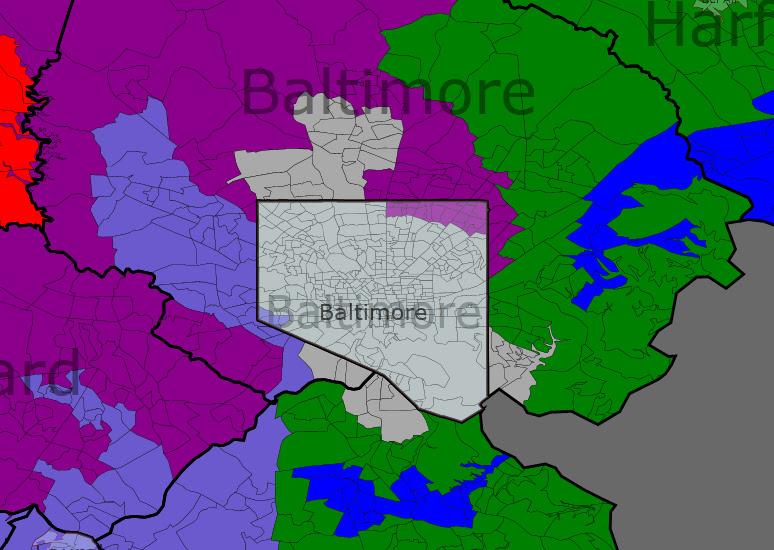
    District 7 (Gray): Baltimore City and Baltimore and Anne Arundel Counties-Baltimore

    Demographics: 55% black, 38% white

    2008 pres. results: 80% Obama-18%  McCain

    This black-majority district takes up nearly all of Baltimore City and some surrounding areas. It is very Democratic and would retain Democratic Rep. Elijah Cummings as its representative.

    District 8 (Lavender): Baltimore City and Baltimore, Howard, Anne Arundel, Prince George’s, and Montgomery Counties-Baltimore, Columbia, Laurel, Bowie, Greenbelt

    Demographics: 55% black, 29% white, 8% Hispanic, 6% Asian

    2008 pres. results: 84% Obama-15% McCain

    This is the third black-majority district in the state as well as Obama’s best district, picking up black areas in between Prince George’s County and Baltimore. While Democratic Rep. Donna Edwards might choose to run here rather than face Steny Hoyer in a primary, it would likely be an open seat won by a black Democrat.

    So it is definitely possible to make three black-majority districts in Maryland. However, would this plan necessarily result in three black representatives being elected? Districts 7 and 8 would easily elect black congressmen, although Steny Hoyer might continue to win in the 5th district despite its new black-majority due to significant establishment support. The three black-majority districts are not an obstacle to toppling Roscoe Bartlett, although they must sacrifice either John Sarbanes or Dutch Ruppersberger. The change after redistricting would be minimal, going from a 7D-1R (Kratovil wins in 2010) or 6D-2R (Kratovil loses in 2010) split to a probable 7D-1R split (assuming Kratovil wins the 1st district seat). Despite the lack of a change in partisan balance under this map, Democrats would probably want to avoid forcing Hoyer into a tough primary and losing Sarbanes or Ruppersberger, so this is one state where three black-majority districts would be a bad thing for Democrats.

    Thanks for reading and please leave your comments and feedback!

    Redistricting Alabama: Two VRA Districts

    There are a few scenarios which could give rise to this map. If control of redistricting is split, then I could see this as a compromise map. As you'll soon see, Mike Rogers' life gets easier while the Second District becomes solidly Democratic (albeit with Bobby Bright is serious trouble in the primary, assuming he's still around).

     Even if Democrats have the redistricting trifecta, the fact that only one of the state's seven districts can be counted on to go Democratic and only one another saw Obama get more than 40% of the vote has got to be worrisome. So, a map such as this can also be seen as a Democratic gerrymander of sorts in that it makes two solidly Democratic districts.

    I could even see this as a Republican map, especially if Bobby Bright survives. If that happens, they could concede the Second in return for shoring up their most vulnerable member: Mike Rogers.

    Finally, this map could result from a decision by the courts or the Justice Department mandating that Alabama have another black-majority district. 2005 Census estimates put Alabama at 26.7% black. That amounts to just under two districts, and considering that adding another majority black district to Alabama is fairly easy as the heavily black areas tend to be clustered or at least fairly close to each other.

    State Map


    First District (Blue)
    Old District: 67.8% white | 28% black
    Old Demographics: 82% white | 13% black
    New Demographics: 81% white | 13% black

    The First exchanges heavily black areas in Mobile for rural, white areas along the Florida border. The net result is a significantly whiter and probably more Republican district, as if Jo Bonner needed it.  

    Second District (Green)
    Old District: 67% white | 29% black
    Old Demographics: 44% white | 53% black
    New Demographics: 41% white | 55% black

    Previous attempts to move the black areas of Mobile to the Seventh District and move extra black areas from the Seventh to the Second were unsuccessful as it left the First and Second underpopulated with nowhere to gain that wouldn’t negate the whole purpose. But moving this area into the Second does work. The Second also picks up heavily black areas from the Seventh and Third and loses whiter areas to the First and Third. As a result, the district is now majority black and, I would assume, pretty solidly Democratic. Bobby Bright would likely have trouble in the primary, though.

    Third District (Purple)
    Old District: 65% white | 32% black
    Old Demographics: 74% white | 22% black
    New Demographics: 73% white | 23% black

    Things get easier for Mike Rogers. Not only has the district been pushed northward out of the black belt (or at least the blackest parts of it), becoming almost three-quarters white, but Rogers' Democratic opponent Josh Segall is now in the Second District.

    Fourth District (Red)
    Old District: 90% white | 5% black
    Old Demographics: 90% white | 6% black
    New Demographics: 88% white | 6% black

    The Fourth remains Alabama's whitest and least diverse districts. I tried to make it a heavily rural district, which you may can see in its loss of Fort Payne and Gadsden. That effort may have been futile as I had to put Florence and parts of Tuscaloosa in the district. I would be shocked if Rob Aderholt had any problems here.

    Fifth District (Yellow)
    Old District: 78% white | 17% black
    Old Demographics: 79% white | 15% black
    New Demographics: 76% white | 16% black

    With this one, I tried to make it more urban (or at least less rural) as well as concentrate the military interests in one district. The new Fifth picks of Decatur and Fort Payne, among other areas, and sheds some more rural areas.

    Sixth District (Teal)
    Old District: 89% white | 8% black
    Old Demographics: 88% white | 8% black
    New Demographics: 85% white | 10% black

    With the loss of Tuscaloosa County, the Sixth loses much of its former serpentine shape. With the addition of Autauga County, the district becomes more of a Birmingham to Montgomery district.

    Seventh District (Gray)
    Old District: 36% white | 62% black
    Old Demographics: 37% white | 60% black
    New Demographics: 35% white | 61% black

    Not a whole lot has changed here. It loses some of Clarke County, giving the district a more compact look, as well as parts of Pickens and Wilcox Counties. In return, it gains some Birmingham-area precincts. The story is still the same: heavily black and solidly Democratic.

    AL Post Primary Rundown

    Last night, the voters in Alabama voted on nominees for each party to contest seats up for election in November. Here is a rundown of how things went in the Yellowhammer State last night:

    AL-GOV: The GOP Primary will go to a runoff between former State Senator Bradley Byrne and either State Representative Robert Bentley or Real Estate Developer Tim James. Personally, I’m surprised Roy Moore, who was polling second in polls leading up to this race, placed 4th. In the Democratic Primary, Agriculture Commissioner Ron Sparks surprised many by crushing Congressman Artur Davis by a nearly 2-1 margin.

    AL-LT GOV: State Treasurer Kay Ivey, who abandoned a hopeless Gubernatorial bid earlier this year, unsurprisingly romped over State Senator Hank Erwin and Teacher Gene Ponder. Ivey will face Incumbent Jim Fosom Jr. in November.

    AL-AG: One of the biggest surprises of the evening occurred here with Attorney Luther Strange walloping Incumbent Republican AG Troy King by 20 points, a race that was under the radar for most political observers. In another surprise, Attorney James Anderson and former State Democratic Party Chairman Giles Perkins will go to a runoff. Perkins finished nearly 19 points below Anderson in yesterday’s vote tallies.

    AL-State Treasurer: In another massive upset, former State Finance Department Official Young Boozer crushed former State Treasurer, former PSC Commissioner, and son of former Governor George Wallace, George Wallace Jr. by about 30 points(Thank God!!!). Unsurprisingly, in the Democratic Primary, former State Conservation Commissioner Charles Grimsley defeated Attorney Jeremy Sherer by about 20 points in the final tallies.

    AL-AG Commissioner: In the GOP Primary, Former State Conservation Commissioner John McMillan and Walker County Economic Development Chair Dorman Grace are headed to a Runoff. The winner faces an uphill fight against Democratic Deputy Agriculture Commissioner Glen Zorn.

    AL-SEN: No surprises in either race, Republican Senator Richard Shelby will face Democratic Attorney William Barnes in November.

    AL-01: No surprise, Republican Congressman Jo Bonner horse-whipped Real Estate Developer Peter Gounares and will do so again to Constitution Party Artificial Reef Contractor David Walter in November.

    AL-02: The Republicans will go to a Runoff between Montgomery City Councilwoman Martha Roby and Businessman Rick Barber. Whoever wins faces Incumbent Democrat Bobby Bright in November.

    AL-05: In the GOP Primary, Madison County Commissioner Morris Brooks surprised everybody by trouncing turncoat Congressman Parker Griffith 51-33. In another surprise, former Congressional Aide Steve Raby beat back a challenge from former State Board of Education Member and Grandson of former Senator John Sparkman, Taze Shepard 61-22.

    AL-06: Incumbent Republican Congressman Spencer Bachus God-smacked Pastor Stan Cooke 77-23.

    AL-07: Jefferson County Commissioner Sheila Smoot and Attorney Terri Sewell surprised everyone by outpacing State Representative and son of former Congressman Earl Hilliard, Earl Hilliard Jr. to make the Democratic Runoff. The GOP has a Runoff of their own between Some-Dude Don Chamberlain and Mortgage Broker Chris Salter.

    Please share your opinions in the comments.

    By what margin will Bob Shamansky win?

    View Results

    Loading ... Loading ...