MA, MI, and NH: Population by CD

Today’s Census data dump is three slow-growth northern states: Massachusetts, Michigan, and New Hampshire. Massachusetts is set to lose one seat (from 10 down to 9), meaning its new target is 727,514 (up from about 634K in 2000). Interestingly, the growth among all the districts was pretty consistent, with only about 20,000 difference between the state’s largest and smallest districts. Estimates over the decade had shown Boston losing population, but in the final count it did eke out a small gain.

With no clear loser on the population front among the districts, that makes the question of who draws the shortest redistricting straw even more complicated… unless someone reverses course and decides to retire, either to challenge Scott Brown (most likely Mike Capuano or Stephen Lynch) or to call it a career (John Olver). Olver’s 1st did wind up being the smallest by a small margin, so the most talked-about mashup of the 1st and 2nd may well happen; alternatively, based on seniority the axe could fall on the delegation’s newest member, William Keating. At any rate, with Dems firmly in charge of the process, don’t look for any of these districts to lose their bluish hues; the main question is who gets left without his musical chair.


District Rep. Population Deviation
MA-01 Olver (D) 644,956 (82,558)
MA-02 Neal (D) 661,045 (66,469)
MA-03 McGovern (D) 664,919 (62,595)
MA-04 Frank (D) 656,083 (71,431)
MA-05 Tsongas (D) 662,269 (65,245)
MA-06 Tierney (D) 650,161 (77,353)
MA-07 Markey (D) 648,162 (79,352)
MA-08 Capuano (D) 660,414 (67,100)
MA-09 Lynch (D) 650,381 (77,133)
MA-10 Keating (D) 649,239 (78,275)
Total: 6,547,629

When it was revealed in December that Michigan was the only state out of 50 that actually lost population since 2000, it was clear that the state’s urban districts were in a world of hurt… but I have to admit I’m still surprised at the way that Detroit has utterly cratered. The Motor City, at one point the 4th largest city in America, is now down to 15th, with a population of 713,777 (now smaller than johnny-come-latelies like Columbus, Austin, and Charlotte). The 13th may be the 2nd least populous district in the country at this point (after WY-AL). I briefly had to wonder whether we might actually see Detroit turned into one CD, mostly contiguous with the city boundaries (since it’s now about the same population as an ideal district), but I can’t imagine that the Obama administration’s DOJ would allow the state GOP (which controls the redistricting trifecta) to pack only one overwhelmingly African-American VRA district when the population is there to support two, albeit two that will have to reach significantly into the suburbs now.

Michigan’s current target is 705,974 (based on the drop to 14 from 15 seats), up from about 663K in 2000. That means that six of its districts (the Upper Peninsula-based 1st, the Flint-and-Saginaw 5th, and the 9th and 12th in Detroit’s northern suburbs, in addition to the 13th and 14th) outright lost population over the decade. With the 9th and 12th also big losers, and with the VRA looming over the 13th and 14th, this all seems to confirm what most people are expecting, that Gary Peters and Sandy Levin are going to get much better acquainted with each other in a Dem primary. If you go further out into the districts that contain Detroit’s exurbs (the GOP-held 8th and 10th), those are the two districts in the state that actually need to shed some population.


District Rep. Population Deviation
MI-01 Benishek (R) 650,222 (55,752)
MI-02 Huizenga (R) 698,831 (7,143)
MI-03 Amash (R) 694,695 (11,279)
MI-04 Camp (R) 686,378 (19,596)
MI-05 Kildee (D) 635,129 (70,845)
MI-06 Upton (R) 671,883 (34,091)
MI-07 Walberg (R) 676,899 (29,075)
MI-08 Rogers (R) 707,572 1,598
MI-09 Peters (D) 657,590 (48,384)
MI-10 Miller (R) 719,712 13,738
MI-11 McCotter (R) 695,888 (10,086)
MI-12 Levin (D) 636,601 (69,373)
MI-13 Clarke (D) 519,570 (186,404)
MI-14 Conyers (D) 550,465 (155,509)
MI-15 Dingell (D) 682,205 (23,769)
Total: 9,883,640

These two district states are really drama-free, and New Hampshire might be the least dramatic of all. The two districts in the state stayed remarkably balanced (as they always do… the state has had two districts since the 1800s, with the boundaries rarely moving much), to the extent that the 1st needs to pick up only 254 people from the 2nd. I’ll leave it to the good folks in comments to argue over which ward in Hooksett should be the one that gets moved. (New Hampshire’s target was 658,235, up from 618K in 2000.)


District Rep. Population Deviation
NH-01 Guinta (R) 657,984 (254)
NH-02 Bass (R) 658,486 254
Total: 1,316,470

MA-Sen: Brown Leads Capuano, Elizabeth Warren

(Please give a warm welcome to brownsox (aka Arjun Jaikumar) who is joining our horserace superteam – promoted by DavidNYC)

Pretty reasonable numbers, but a dodgy-looking sample.

Western New England College (PDF) (3/6-10, Massachusetts voters):

Michael Capuano (D): 38

Scott Brown (R-inc): 51

Elizabeth Warren (D): 34

Scott Brown (R-inc): 51

(MoE: ±4.5%)

The toplines are pretty much in line with what other pollsters have shown, like PPP. Brown has a solid lead, hovering around 50%, while his prospective opponents aren’t especially well known (one difference between WNEC’s poll and PPP’s is that Mike Capuano, tested in both polls, has impeccable 30/14 favorables in WNEC’s poll and pretty lousy 26/27 favorables in PPP’s).

Brown also leads Elizabeth Warren, who WNEC decided to poll for reasons best known to them (though check out those 17/3 favorables – Mike Beebe, eat your heart out!)

Like a lot of university polls, though, WNEC’s sample seems bizarre – 34% Democrats, 12% Republicans and 47% independents (the remainder responded “something else”). That’s very low on Democrats for a Massachusetts poll – the 2008 exit polls were 43% Dem, 17% Republican, 40% indie. Still, the toplines are close enough to everybody else’s numbers that they seem likely to be accurate. So the question is, can Brown lose?

He’s popular, but unlikely to get much more popular than he already is, especially as he continues to vote with Republican leadership to cut jobs and slash Medicare benefits. And popular Republicans can lose in Massachusetts in Presidential election years – ask former Governor Bill Weld, who ran for the Senate after receiving an eye-popping 71% of the vote in his 1994 reelection. Weld lost to John Kerry by seven points, 52% to 45%, helped in no small part by Bill Clinton’s 33-point romp in Massachusetts.

So sure, Brown can lose. He starts in a strong position for reelection, though, and it will take an exceptional campaign to unseat him.

Redistricting outlook: Mass.-Minn.

Now that it’s 2011, the redistricting games will soon begin in earnest, with more detailed Census data expected in the coming weeks and some states holding spring legislative sessions to deal with drawing new maps. Long ago I planned to do state-by-state rundowns of the redistricting process as soon as 2010 election results and Census reapportionment were clear. Now that time has arrived, and it’s time to look at Massachusetts, Michigan, and Minnesota.

Previous diary on Alabama, Arizona, and Arkansas

Previous diary on California, Colorado, and Connecticut

Previous diary on Florida, Georgia, and Hawaii

Previous diary on Idaho, Illinois, Indiana, and Iowa

Previous diary on Kansas, Kentucky, Louisiana, Maine, and Maryland

The rest below the fold…

Massachusetts

Photobucket

Districts: 9 (down from 10 in 2002)

Who’s in charge? Democrats

Is that important? Not from a partisan perspective, no

For a state with an all-Democratic delegation being remapped by Democratic lawmakers, there’s been a surprising amount of drama in the Bay State over whose district will be cut. It was hoped that an older member would announce his retirement, allowing a clean elimination without any messy incumbent vs. incumbent primaries. But Financial Services Committee ranking member Barney Frank, long speculated to be the next retiree, announced he will run again, and so far no member of the congressional delegation appears ready to challenge Sen. Scott Brown, though Mike Capuano’s name is still in the running. Should he go for it, his Boston seat will simply be split up between Frank and Stephen Lynch. In any case, all nine districts should remain strongly Democratic-leaning.

Michigan

Photobucket

Districts: 14 (down from 15 in 2002)

Who’s in charge? Republicans

Is that important? Yes

As was the case ten years ago, Republicans will draw the lines in Michigan, but unlike then, they really have no room to make gains, only to eliminate one more Democratic incumbent. In most estimations, that incumbent will be two-termer Gary Peters, the only Democrat (other than Hansen Clarke, whose district is VRA-protected) in the state’s delegation elected after 1982. A likely scenario is that his Oakland County swing district will be combined with Sander Levin’s heavily Democratic Macomb County territory in a safe blue seat. Levin’s liberal record and thirty years of seniority should make him a prohibitive favorite over Peters in the Democratic primary, but I suppose at 81 he will be prime congressional retirement age. Other than that, the GOP cannot afford to get too cute with boundaries — they already hold several marginal seats (the 1st, 7th, and 11th come to mind).

Minnesota

Photobucket

Districts: 8

Who’s in charge? Split (Dem Governor, GOP Legislature)

Is that important? Surely

Democrats are counting their lucky stars that Mark Dayton won the gubernatorial race, as the GOP has long aimed to combine Minneapolis and St. Paul into one heavily Democratic seat and now will presumably not have that opportunity. Ten years ago, a three-way deadlock between Independent Gov. Jesse Ventura, a Democratic Senate, and a Republican House forced the courts to step in, but many hope for compromise this time around. Since the state’s high Census participation rate saved it from losing a seat, status quo will probably win the day, with safer seats for Tim Walz, Chip Cravaack, and perhaps Collin Peterson. Ironically, Minnesota just held on to its eighth seat at the expense of fast-growing but lower-participating North Carolina, which was the controversial winner over Utah for the last seat allocated in the 2000 Census.

Mass Confusion: 4 Plans for MA Redistricting

For my first diary, I decided to tackle my (adopted) home state. Given that Olver is not going to go quietly, it really seems to be up in the air who gets eliminated. I think there are 4 realistic options:

1. Olver gets pushed in with Neal anyway. Western Mass is where the population loss has been, and this would produce the least-gerrymandered map.

2. Lynch is booted. He’s not popular among the liberal establishment and can be eliminated pretty easily.

3. Tierney is eliminated. He’s probably the weakest incumbent in the delegation, and if it stays the same, I think the 6th is the only district that could flip in 2012 (assuming Tisei runs).

4. Frank retires. The 2010 race, and the prospect of going back into the minority, may convince him that now is the time to hang it up and write his memoir.

I think 2 and 3 are the more likely scenarios, but 1 and 4 are still possible. Notice I did not include Scenario 5: Capuano runs for senate. That’s because the plan will face a lawsuit if they do not draw a Majority-Minority District. I think it is likely to succeed, based on VRA analysis I’ve read here pertaining to other states. Since Capuano’s district is already on the VRA borderline, I think it is going to stay the same regardless. In all my plans I made sure the 8th was below 50% white.

Quick notes for these:

A) Nantucket and Martha’s Vineyard are always in Keating’s district. It’s just easier to leave them off the maps for readability.

B) All districts are safe D in all years in my opinion, unless otherwise indicated.

C) I tried to keep any non-eliminated incumbents in districts that are as similar to their current ones as possible.

D) Keating’s district gets the number of the eliminated district, just for convenience (I know MA always renumbers its districts to count up from the West to Cape Cod)

I have individual district maps for all these – I’ll post them if there’s confusion, but there are so many districts here (36) I’d rather not do that.

The coloring scheme should be familiar:

District 1: Blue

District 2: Green

District 3: Purple

District 4: Red

District 5: Yellow

District 6: Teal

District 7: Hot Pink or Orange(Map II)

District 8: Lavender

District 9: Cyan

Map I: Neal vs. Olver

West:

MA_1_West

Northeast:

MA_1_Northeast

Southeast:

MA_1_Southeast

Boston:

MA_1_Bos

I-1. Keating

This district changes quite a bit – it keeps it base on the Cape and Islands but now includes Keating’s actual residence in Sharon. New Bedford is added too to make this more Dem.

I-2. Neal vs. Olver

Compact Western Mass seat. Should be a fair fight between the two.

I-3. McGovern

This district is now Worcester County-based, losing its tail into Fall River. McGovern should hold it fine, but I’d be concerned about him retiring in a bad year.

I-4. Frank

Frank gets a lot of liberal MetroWest areas along with some more conservative ones around Franklin. He also swaps out New Bedford for Fall River. Probably makes it a point or two less Dem, but Frank should be fine.

I-5. Tsongas

Very similar to her current district, but adds Fitchburg and Leominster while losing Haverhill.

I-6. Tierney

Adds Haverhill and Woburn but otherwise doesn’t change much. A potential alternate configuration would be to move Revere and Winthrop to I-6 and give Woburn back to I-7. That’s probably a wash politically.

I-7. Markey

Pretty similar to his current seat with a little more of MetroWest.

I-8. Capuano.

Similar to his current seat with a few territory swaps in Brighton, Hyde Park, and Everett to make sure it’s majority-minority (47% white).

I-9. Lynch.

Takes in conservative parts of Plymouth county as well as the Blue-collar towns of Quincy and Brockton. Excellent fit for Lynch, but could be competitive if he retires at the wrong time.

Map II: Capuano vs. Lynch (in reality, eliminating Lynch)

West:

MA_2_West

Southeast:

MA_2_Southeast

Northeast:

MA_2_Northeast

Boston:

MA_2_Boston

II-1. Olver

Expands east just a tad and gets rid of that silly tail on the 2nd district, which has outlived its usefulness.

II-2. Neal

Same situation as Olver. These 2 districts are more-or-less identical in maps II, III, and IV.

II-3. McGovern

Almost identical to his current district.

II-4. Frank

Moves a bit further out of Boston. Probably about the same politically, or maybe a point or two less D, due to the addition of Brockton canceling out some more conservative suburbs. Frank should still be safe here.

II-5. Tsongas

Similar to her current district, with a bit more of MetroWest added. Probably a point or two more D.

II-6. Tierney

Pulls in closer to Boston, taking the Northeast part of Markey’s district. Probably a point or two more D, but I’d be really worried about Tisei winning this seat as the new territory coincides with his former State Senate District.

II-7. Markey

Loses its northeastern portion and exchanges it for Brookline, Brighton, and West Roxbury. Maybe a point or two more D.

II-8. Capuano vs. Lynch.

Majority-minority district that contains Capuano’s and Lynch’s homes, but that Lynch can not win. If Capuano runs for Senate, I imagine Chang-Diaz could beat Lynch in a primary easily.

II-9. Keating.

Adds Milton, Braintree, and Weymouth (giving Keating more of his Norfolk County base) but otherwise few changes. Probably a point or two more D than it is now.

Map III: Eliminating Tierney

West:

MA_3_West

Northeast:

MA_3_Northeast

Southeast:

MA_3_Southeast

Boston:

MA_3_Bos

III-1 and III-2. Olver and Neal

See map II above.

III-3. McGovern

This one changes a lot. It becomes basically a MetroWest district. If anything that makes it more Democratic, but I could see McGovern having a tough primary fight if somebody from the Framingham area had the gall to challenge him.

III-4. Frank

This district shifts west, taking the tail of MA-3 and giving up its central portion. The population centers stay the same though (Newton, Brookline, New Bedford, and Fall River) so I think Frank should be fine here.

III-5. Tsongas.

This one has big changes, taking in the northern (and more conservative) half of the old 6th. On the plus side, it loses some conservative areas west of Lowell. It’s probably a point or two more Republican, and I could see Tsongas being vulnerable here in a 2010-like year.

III-6. Keating.

Similar to his current district, but adds Wareham and Braintree.

III-7. Markey vs. Tierney

This is designed as Markey’s district, but I don’t think he’s going to like it. It’s about 60% new territory for him and includes Tierney’s home. If Tierney doesn’t retire voluntarily, I don’t see them going for this as it would put Markey at serious risk in the primary. Even if Tierney retires, I think Markey would still complain loudly at having to absorb so much new area. This should be very safe for whichever Dem wins it in 2012, though.

III-8. Capuano.

Majority Minority District. Basically identical to I-8 above.

III-9. Lynch.

Lynch expands to the South, taking in conservative exurbs. Probably a couple points less Democratic, but this is a good fit for Lynch.

Map IV: Frank retires

West:

MA_4_West

Northeast:

MA_4_Northeast

Southeast:

MA_4_Southeast

Boston:

MA_4_Boston

IV-1 and IV-2. Olver and Neal.

See map II above.

IV-3. McGovern

Very similar to his current district, with one big exception, the addition of New Bedford. Probably significantly more Dem as a result.

IV-4. Keating

Gets fatter by adding more of Plymouth Co. and probably gets more Republican. Keating himself is probably safe, but I’d be very worried about him leaving in a bad year.

IV-5. Tsongas

Loses Haverhill and plunges deep into MetroWest. Probably siginificantly more D than before.

IV-6. Tierney

Adds Haverhill. Probably a wash, and I’d still think Tisei could win this seat.

IV-7. Markey

Adds Newton, Brookline, and West Roxbury while losing MetroWest. Probably more Dem than before.

IV-8. Capuano

Basically identical to I-8 above.

IV-9. Lynch

Very similar to his current district, shifted a little south and west, and adding Wellsley and Needham. Lynch won’t like that, but I think the more conservative rest of his district should be enough to hand him easy primary and general victories.

The moral of the story: Each of these have their strong and weak points. If you make a MMD in Boston (which means not tinkering with Capuano) it’s almost impossible to make 9 truly safe Dem seats. You can make 7 safe, 1 safe except in a really bad year, and 1 safe except for a Tisei run, but I think that’s about the best you can do without looking at a VRA suit. And I honestly don’t know what the final map will be most like – it’s so up in the air I don’t even think I can speculate. But the reason I did these 4 maps is to compare the possibilites, and I feel like the final product will look pretty similar to one of these, depending on who retires and who the legislature favors.

PS: Also note that with Maps 3 and 4, you can swap portions Keating’s and Lynch’s districts to give Lynch Plymouth and Quincy and Keating Norwood and Taunton as I did with Map 1, without affecting any other district.

That’s what I should’ve done for Map 4, but I didn’t realize it until after it was posted. So imagine Lynch’s district going East of Keating’s through Quincy, and Keating taking in Needham and Wellsley. That would solve Lynch’s primary and Keating’s general election problems.

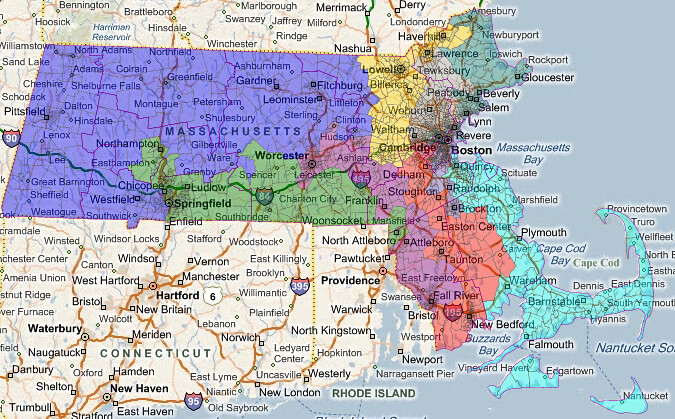
A possible Gerrymander of Massachusetts

The assumption behind this map is that Capuano runs for Senate and all other incumbents are protected.  All cities and towns are kept intact, excepting Boston.

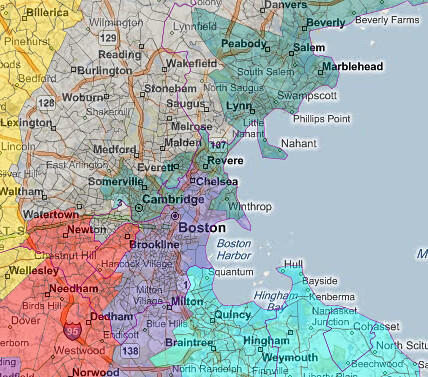
Boston Detail:

1st district – Oliver (Blue)

Gains some Worcester suburbs and some 495 belt towns, which makes it slightly more conservative, but at D+14 it has some room to spare.

2nd District – Neal (Green)

Adds a couple Republican towns in the East and Democratic ones in the West, overall not much changed.

3rd District – McGovern (Purple)

Keeps its Worcester and Fall River anchors, in fact gaining the portion of Fall River that Frank used to have.  The district shifts slightly, losing the Northern suburbs of Worcester and gaining other towns in Norfolk and Bristol counties.  Overall, not much change in partisan composition.

4th District – Frank (Red)

Like the 3rd, this district retains it’s anchors, but shifts slightly East.

5th District – Tsongas (Gold)

This district is made safer, swapping its 495 belt towns for more liberal towns in the Metrowest area.  (Fun fact: Framingham, at 67,000 inhabitants, is the largest town in New England)

6th District – Tierney (Teal)

Embattled rep Tierney needs some shoring up, so he gets the biggest prize from Capuano’s district: Cambridge and Somerville.  While this should make him safe in the general, if Tierney’s ethics troubles get any worse, he could be vulnerable in the primary, especially since much of the territory in this district is new to him.

7th District – Markey (Gray)

This district, while picking up the Alston-Brighton neighborhood of Boston, gets slightly more conservative overall, as it trades the metrowest towns that Tsongas picked up for some more conservative ones that Tierney lost. At D+15 it still has a strong liberal inner suburb base and should be fine.

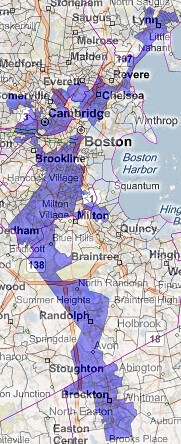
8th District – Lynch (Periwinkle)

Lynch’s district changes radically in order to preserve the majority-minority district required (maybe?) by the VRA.  Lynch may not be too happy about this, since he has the most conservative voting record of any of the delegation and will now have a very Liberal district.  He could be vulnerable to a primary challenge, perhaps from State Senator Sonia Chang-Diaz.

9th District – Keating (Cyan)

This district doesn’t change much, unfortunately.  There are only so many ways to draw a district that stretches from Quincy to Cape Cod.  If O’Leary had won the primary we would have had more options.

The new 8th district is 48% non-hispanic white, which is comparable to the current 8th.  Just for fun, I tried to draw a district that would bring this number as low as possible:


40% White, 27% Black, 10% Asian, 21% Hispanic, 2% other.

DE, MA, MD & NH Primary Results Thread

9:06pm: Holy shit, let’s continue the party over here.

9:05pm: Update from the DE DoE! With 78% in (252 of 325), it’s O’Donnell 54 and Castle 46. 3600 votes separate them. Over in Maryland, MD-04 has been called for Donna Edwards, not much contest there either. Maybe also worth mentioning: the GOP primary in NH-Gov got called long ago (with only 7% reporting): John Stephen easily defeated his weird opposition, teabagging businessman Jack Kimball and social con activist Karen Testerman, 77-17-8.

9:00pm: In DE-AL, Glen Urquhart is, as PPP predicted, leading Michelle Rollins. He’s up 51-46 with 37% in.

8:50pm: And it wasn’t even a contest in Maryland — the AP has called the GOP gube nomination for Bob Ehrlich. He’s sitting on 82% of the vote so far.

8:49pm: In MA-09, douchebag conservadem Stephen Lynch leads Mac D’Allesandro by 43% with 3% in.

8:47pm: I can’t get through to the DE DoE, but the latest AP count has O’Donnell up by 55-45 with 37% in. 2300 vote spread.

8:43pm: Some non-DE updates: In MA-10, state Sen. Rob O’Leary leads Norfolk DA Bill Keating by 57-43, and Jeff Perry leads Joe Malone by 58-35 with 5% in. In MD-01, Andy Harris is leading Rob Fisher by 40 points.

8:39pm: We’re now up to 31% reporting in DE, and O’Donnell leads by 54-46 (or about 1400 votes).

8:37pm: We’re up to 22% reporting in DE, and O’Donnell leads by 56-44! 1450 vote spread.

8:35pm: Before conking out, the last DoE update had O’Donnell up by 55-45 with 17% reporting. 900 vote margin.

8:33pm: Folks, looks like we’ve crashed the DE DoE site. Restrain yourselves! (Yeah, as if that’s possible.)

8:31pm: Now it’s 14% reporting in Delaware. O’Donnell now up 55-45, with a 700-vote margin.

8:29pm: We’re up to about 11% reporting in Delaware, and O’Donnell leads Castle by 55-45. Hang on to your butts…

8:26pm: Now up to 25 precincts in Delaware, Christine O’Donnell is now leading Mike Castle 52-48, or about 180 votes.

8:22pm: We have some early numbers from the Delaware DoE site! Nutbag Christine O’Donnell leads Mike Castle by 655-449, or 59-41, with 8 out of 325 “Districts” reporting.

8:13pm: I just got off the horn with the Elections Division at the New Hampshire Secretary of State office. They inform me that it’s NEVER too early for a ganja break.

7:51pm: Via the Twitter, Delaware elections officials are expecting a quick count there, with most of the results being known by 9:30.

7:49pm: We’re up to 5% in, and Lamontagne is up by 53-32. Much of that is based on Lamontagne’s strength in his hometown of Manchester, though.

7:44pm: Checking in with the House races, baggage-laden Manchester Mayor Frank Guinta leads Rich Ashooh by 46-28 with 9% in. Sean Mahoney, a guy who’s spent a lot in recent weeks, is only pulling in 19%. In NH-02, ex-Rep. Charlie Bass leads Jen Horn by only 8%, but we’re just looking at a few hundred votes so far. (Likewise, Ann McLane Kuster has an early lead on Katrina Swett for the Dem nod.)

7:40pm: 3.7% is in, and Ovide leads by 53-32.

7:34pm: We have some early results in New Hampshire. With 2% in, Ovide Lamontagne leads Kelly Ayotte by 23 points, 54-31!

Polls will be closing in Delaware, Massachusetts and Maryland at 8pm Eastern (some polls have already closed in New Hampshire; the rest will follow at 8pm). We’ll be using this thread to follow the returns, and we’ll check in with Rhode Island, New York, and Wisconsin when polls close in those states at 9.


Results:

GOP Gerrymander of MA–Ask and ye shall receive!

This diary was inspired by a comment from Nichlemn on markhanna’s recent diary which read, “[Other blogs] are for people who want to know who’s likely to win the next big election. SSP is for people who want to know who’s going to win the Democratic primary in UT-03 or draw a Republican gerrymander of MA.” Well, I’ll leave the Utah forecasting to someone else, but here is a redistricted map of the Bay State with the GOP running things!

Note: If this is against the rules–a Republican gerrymander on a Democratic site–please take it down, and I apologize. If it’s OK, let me know if you like it, because I have one for New York too!

A few things to note before we get into it:

1. Massachusetts, unfortunately, will be losing a seat after the Census. I guess the weather is better elsewhere. This map is for nine congressional seats.

2. The current 10-seat map is a very ugly and somewhat unnecessary gerrymander. (Please feel free to venture a guess as to what Frank’s or McGovern’s district looks like now.) Democrats control all 10 districts, but probably would anyway on a fairly-drawn map. However, the current plan is designed to favor Boston-area politicians, as 6 of the 10 members of the current delegation live within 5 miles of the Hub. As a result, Middlesex County is split between 7 districts, Norfolk County has four spaghetti strands, and there is no Member from the southeastern part of the state. I tried to improve on the geographic balance somewhat.

3. Getting even one or two GOP seats was tough! The thing with Massachusetts is that Democratic strength is so evenly spread out across the state. President Obama won 302 of the 351 cities and towns, and won no less than 43% in any community statewide. To further complicate things, most of the 49 communities John McCain did win are inconveniently located near Democratic bastions like Worcester, Lowell, and Taunton. Thus, this “Republican gerrymander” is made up of 7 safe Dem seats, 1 tilt R seat, and 1 likely/safe R seat. I doubt there is any other state where a gerrymander means you have a shot at 2 of 9 seats!

4. Everything is based of presidential results. While Scott Brown put up nice numbers, there is no reason to think this will change long-term voting patterns. There is no partisan data yet for MA, so I used town-by-town results to estimate the leanings.

And here we go!

MA-01 John Olver (D) vs. Richard Neal (D)


Partisan Data: D+15-20. Obama probably got ~70% here.

Finally, Western Massachusetts has its own district, and it’s a mix of bohemian rural towns and the industrial city of Springfield. Politically and culturally, this area has much more in common with Vermont than with the rest of Massachusetts. Home to Amherst, Williams, Smith, and UMass among others, this district is both very Democratic and very liberal (not always the case here.) I drew this to be a fair fight between veterans Olver and Neal, with about equal amounts of population from their current districts. My guess is that Olver would retire in this situation.

MA-02 Jim McGovern (D)


Partisan Data: PVI around D+10. Obama scored in the low 60’s here.

An ugly yet efficient Democratic vote sink in Central Massachusetts, this is mostly new territory for McGovern but he won’t be complaining. His current district, which went strongly for Brown, is more moderate than its PVI suggests, and as one of the most liberal members of the house McGovern could be vulnerable there if not for his immense personal popularity. He retains his home base in Worcester and adds friendly territory to the north, east, and west. This district will be a pain to represent, as Fitchburg, Longmeadow, and Hopkinton have little in common.

MA-03 (purple) and MA-04 (red) OPEN


MA-03 Partisan Data: R+6. McCain 52, Obama 47

Here’s the first, and better, of the two opportunities for the GOP on this map. The district is made up mostly of exurbs of Boston, Providence, and Worcester, combined with the wealthy South Shore (Plymouth County.) In fact, it’s the only Massachusetts district without a significant urban area. I-495 runs right through the heart of this district, and a Republican from the Franklin area like St. Sen Richard Ross would be favored in this race. If Joe Malone wins the current MA-10 this year, this would be his district. Scott Brown also lives here and probably approached 70% of the vote in the January Senate race.

MA-04 Partisan Data: D+7 or so. Obama was around 60% here.

I know my map will never be drawn, but seriously, this district must be. As it stands now, men from Worcester, Newton, and Quincy represent the South Coast, Cape, and Islands,  which are a world away from those other places. This plan unites the three, whose economies are heavily depending on fishing, and in the case of the South Coast, shipping. Politically, the Inner Cape is conservative, the Outer Cape and Islands are very liberal, and the South Coast is dominated by the Democratic cities of New Bedford and Fall River. If Rob O’Leary (D) wins the MA-10 race this year, he will be a perfect fit for this district.

MA-05 Niki Tsongas (D)


Partisan Data: PVI R+3 McCain 49, Obama 49

Niki Tsongas is the weakest member of the current delegation, vastly underperforming in her only contsted election so far, and I made every attempt to draw her into a McCain district. Well I did–by about 250 votes. This plan chops off the liberal southern half of Tsongas’ current district and replaces it with Worcester’s northern suburbs and some Boston exurbs from Essex County. Most of the population comes from the conservative (by MA standards!) Merrimack Valley, which keyed Brown’s win, but geography forced me to include the liberal mill cities of Lowell and Leominster. Thus, Tsongas or another Dem wll have a shot, but the GOP should have a slight edge in a an even year.

MA-06 John Tierney (D)


Partisan Data: D+10ish. Obama probably cracked 60.

This is what remains of fast-growing Essex County after the conservative towns were given to MA-05 combined with the blue-collar cities of Revere, Chelsea and Winthrop in Suffolk County. The industrial and very Democratic city of Lawrence, which I had to keep out of Tsongas’ hands, is responsible for the ugly arm in the northwest. Tierney will cruise here.

Metro Boston Map


MA-07 Ed Markey (D) vs. Barney Frank (D)

Partisan Data: D+15 at a minimum. Obama would have been in the mid to upper 60’s.

Well, I couldn’t squeeze any more than two gettable districts for the GOP here, so the obvious consolation prize was throwing two of the most senior and powerful Democrats in Congress into the same district! But fear not, Dems: there’s a solution here. Markey has considered Senate runs before and may run against Brown in 2012, giving Frank a clear field. If Markey stays in the House, he’ll be geographically favored, and Frank can move to the Cape and run in the new MA-04 since he already represents a good chunk of the South Coast.

Politics aside, this Middlesex County district makes good sense. These are the primary western suburbs of Boston (MetroWest, as they are called), and are for the most part very wealthy and very liberal. Boston College, Tufts, and Brandeis are all in this district.

MA-08 Mike Capuano (D)

Partisan Data: D+32 or so, Obama won about 85%.

One of the most Democratic districts in the country, there’s little change here. Latte-liberal Cambridge and Brookline and blue collar Everett and Somerville combine with the majority of Boston to keep Capuano super-safe. I tried to put the most liberal parts of the Hub here–Beacon Hill, Back Bay, JP, Roxbury, Mattapan, and the South End are all included, as are Harvard, MIT, BU, Northeastern, and dozens of others. It’s 55% white, but MA has actually been losing minority population so I don’t think we’re in VRA trouble.

MA-09 Stephen Lynch (D)

Partisan Data: D+7. Obama was in the high 50’s.

Our final district belongs to the most moderate member of the current delegation, Stephen Lynch. The new district is very similar to his old one, combining most of suburban Norfolk County with the less liberal parts of Boston–Southie, West Roxbury, Hyde Park, and the white parts of Dorchester. The industrial town of Brockton is tacked on to the south to keep it away from the new MA-03. Scott Brown won here by more than expected, and this was one of those places where Obama underperformed Kerry. Nevertheless, it’s safe for Lynch until further notice.

And there you have it! McGovern and Tierney are the clearest Democratic winners, Tsongas and Frank are both losers, and Neal and Olver must slug it out in the west. The GOP has two opportunities now and may or may not have a third by 2020 depending on long-term trends in Lynch’s district.  

MA-09: Update on Progressive Mac D’Alessandro vs. ConservaDem incumbent Stephen Lynch

If you haven’t already, please join Mac’s Facebook group and please, please, please contribute to Mac through ActBlue!

The big news this past week out of MA-09 is that progressive challenger Mac D’Alessandro will make the Democratic primary ballot against anti-choice, anti-health care reform ConservaDem incumbent Stephen Lynch.  He submitted 5,000 signatures to city and town clerks offices by the May 4 deadline.  As long as at least 2,000 are certified valid (should be no problem with 5,000 submitted), Mac submits the 2,000+ certified valid signatures to the Secretary of State by June 1 and he’ll give voters a choice against ConservaDem Lynch.

Mac took to YouTube to thank his grassroots supporters for their help making the signature drive a big success:

Progressive Democrats across the country have reason to be active in this race.  There were 34 House Democrats who ultimately opposed health care reform; and Lynch’s vote was among the most perplexing:

Then there are the real head scratchers. Reps. Michael Arcuri (D-NY) and Stephen Lynch (D-MA) famously abandoned the reform push late in the game, after having voted for the House bill. Lynch, in particular, went on a very public crusade of opposition to the bill from the left, and cast his vote despite pleas from President Obama and AFL-CIO head Richard Trumka that he vote with the party.

Of the 34 anti-health care reform Dems, some are running for other office (Senate or Gov), some are retiring, but most are running for re-election.  Best I can tell though, few if any have serious primary challengers.  MA-09 will provide progressive Democrats nationally with an opportunity to send a message to a ConservaDem who abandoned one of the Democratic Party’s central pillars – expanding access to health care and moving toward truly making quality health care a right instead of a privilege.

That appears to be why Mac’s campaign has found itself on MoveOn.org’s radar screen as a viable primary challenger worthy of progressive support:

In the wake of Rep. Stephen Lynch’s vote against health care reform, many progressives have expressed frustration with him-and now he’s facing a serious primary challenge.

Mac D’Alessandro is the New England Political Director for the progressive Service Employees International Union (SEIU) and he’s pledging to “be on the side of consumers and workers, and not on the side of health insurance companies and big banks.”

So get in the game!  Now that Mac has demonstrated grassroots strength through the impressively successful signature drive, he has to raise money – and ConservaDem Stephen Lynch starts off with a $1.3 million campaign war chest.  So, please, please, please head over to Mac’s ActBlue page and contribute as generously as you can!

Here is some background on Mac, from his Facebook group:

Mac D’Alessandro of Milton, Massachusetts, has spent his career fighting on behalf of working families. For the past nine years, Mac has worked for the Service Employees International Union, most recently as New England Political Director. Prior to working for the SEIU, Mac worked for Greater Boston Legal Services, directing legislative efforts to help families combat poverty. Mac earned his Bachelor of Science degree in Human Ecology and Environmental Policy from Rutgers University and his Juris Doctor from Boston College Law School. Mac, 40, is married to Jennie Mulqueen, an early childhood arts educator, and is the proud father of five-year-old Sophie and three-year-old Atticus.

MA-09: Progressive Dem Mac D’Alessandro Takes on ConservaDem Stephen Lynch

SEIU’s New England regional political director Mac D’Alessandro has taken the primary plunge against incumbent Stephen Lynch.  (Lynch, for you Progressive Punch score followers, gets a lousy 2 rating, coming from Massachusetts, and has a lifetime progressive score on “Crucial Votes” of 81.87, which drops to 71.95 when focusing on 2009-2010.)

D’Alessandro promises to be a progressive alternative to Lynch.  D’Alessandro’s Facebook group, started this week, is up to almost 900 members.  I’d encourage you to join.  And he just got on ActBlue.  You can help replace ConservaDem Stephen Lynch with a real progressive by making a contribution to Mac D’Alessandro today.

D’Alessandro has also introduced himself to the local progressive netroots at Blue Mass Group:

Greetings, Blue Mass Group!  My name is Mac D’Alessandro.  I’m the New England Political Director for the Service Employees International Union (SEIU); and, as of this week, I am a candidate for United States Congress from Massachusetts’ 9th district.  I am a progressive Democrat, and I’m running for Congress because I believe that the working families in our communities deserve a Congressman who will fight for them and who will actually be a leader on key issues that matter to them – from reforming our health care system (and building on the recently-passed reforms) to holding Wall Street accountable to investing in job creation for our communities to protecting our civil rights and ensuring equal protection under the law.

I have spent my career fighting for working families.  I’ve been with the SEIU for nine years.  Prior to that, I worked for Greater Boston Legal Services, directing legislative efforts to help families combat poverty.  I live in Milton with my wife Jennie, our children Sophie and Atticus, and our cat Nile.  Like most families throughout the district and across Massachusetts, my wife and I sit at our kitchen table on a regular basis, going over our bills and the family budget, paying for today while trying to save for tomorrow.  We see too often that the well-being of Fortune 500 companies are put in front of the good fortune of working families like ours.  That is why I’m running.  The 9th district deserves more than just another representative; the district deserves someone who will champion our Democratic ideals in the U.S. House of Representatives as we fight to balance the playing field for working families like ours.

There were 34 House Democrats who opposed health care reform.  Lynch was the only one from Massachusetts.  And, of those from the 34 who are running for re-election, I still don’t see a lot of primary challenges.  Supporting Mac D’Alessandro’s campaign can send a message nationally to Democrats wavering on other issues (like Wall Street reform).  Mac very much represents what it means to be a “Better Democrat.”  Please spread the word, join the Facebook group, and contribute any amount you can.

GERRYMANDERING (movie) – World Premiere Tribeca FF

Greetings all –

I’m the writer/director of a new feature-length documentary about redistricting, a subject which I know is near and dear to many hearts here.  It’s called, aptly, GERRYMANDERING.  I’ve been working it now for about five years and the film will have its world premiere two weeks from today in the Discovery section of New York’s Tribeca Film Festival.

In the course of making the film, I got in touch with DavidNYC who provided terrific advice here and there.  When I let him know about the premiere he suggested I diary about it, so here goes…

GERRYMANDERING World Premiere!

Tribeca Film Festival 2010

Tuesday, April 27, 6:00 pm, Village East Cinema (181 Second Avenue at 12th Street)

Tickets are available now for Amex cardholders: http://www.tribecafilm.com/fes…

General tickets go on sale 4/19.  

If you can’t make the premiere, we’ll screen three more times:

Wednesday, April 28, 5:30 pm, Village East

Friday, April 30, 7:00 pm, Clearview Chelsea  (260 West 23rd Street (between 7th and 8th Avenues)

Saturday, May 1, 10:00 pm, Clearview Chelsea

Here’s the Tribeca FF description:

What is “gerrymandering”? You don’t have to wait for your oversized 2010 census envelope to figure out what exactly it means. Named for the Massachusetts governor who conveniently redrew a few erratic lines in 1812, gerrymandering is the redistricting of electoral boundaries to effect voting outcome in favor of a particular candidate, political party, et cetera. And why should you care? As the governor of California will tell you, the reestablishment of district lines takes away the voice of individual communities, reduces voter turnout and lessens competition among candidates. Whether it’s a community, race, or party issue, an issue it surely is.

Director Jeff Reichert gathers an impressive bevy of experts to smartly present a well-rounded exposé. From California’s struggle to pass Prop 11 to The Daily Show’s mockery of a gaggle of border-jumping Texas politicians, this accessible and informative documentary encourages us to put on our bifocals and more closely inspect the warp and woof of America’s democratic system.

–Ashley Havey

Residents of California, Florida, Texas, Iowa, DC, New York, Massachusetts, Louisiana or Oklahoma will recognize a lot of our shooting locations.  (Hopefully we’ll be able to get the film to the rest of the country soon).

For more info (and a quick, somewhat old teaser trailer) check out our website: www.gerrymanderingmovie.com

And if you have specific questions about the film, I can try to answer them in the comments…

By what margin will Bob Shamansky win?

View Results

Loading ... Loading ...