In Which I Reopen Wounds, or, Examining Boston through the Coakley-Brown Race

David and the rest of the SSP crew have been kind enough to give me a soapbox here, and I think I’ll be starting a series on breaking down large jurisdictions through the lens of some election.

Having gotten my hands on precinct data for the city for both 2008 and the 2010 Special, I thought I’d continue to examine the disparities between Obama’s and Coakley’s respective performances.

As you can see on the map, the geographic central core of the city, Roxbury and Mattapan, remained strong with little dropoff from Coakley to the Obama. Jamaica Plain, Allston/Brighton, and Back Bay – all strong Obama areas as well – showed slightly greater drop-offs. Even greater drop-offs were noticeable in the already swingy areas of the city, such as West Roxbury, Dorchester, Charlestown, and Southie. McCain won only 3 precincts throughout the entire city’s 254; Brown increased that to 33.

Putting this statewide perspective, we get this:

Again looking at the map, South Boston was pretty darn brutal for Coakley, with Brown scoring 60%+ in several precincts. Many people (including one Stephen Lynch) indicated particular hostility for Coakley in the neighborhood. She did get destroyed here, but was it any worse than how badly she got destroyed across the rest of the state?

I think not. Sidenote: I’m defining “South Boston” the same way the Boston City Council does, that is, all nine precincts in Ward 6 and precincts 1-7 in Ward 7.

In 2008, in the 16 precincts constituting “South Boston” (or Southie), Obama beat McCain by a margin of 3,100 votes, or roughly 59-39. In 2010, Coakley lost by a margin of 1,500 votes, or roughly 43-56. Overall, this was a 16.0% swing; this is somewhat worse than that 15.31% swing experienced by Coakley across the state.

But, despite my election-night model assuming so, Coakley didn’t experience a uniform dropoff. Instead, dropoffs are quite correlated with how well Obama performed in the area was to begin with. (This makes sense – Democratic strongholds are likely to remain so, while swingy areas in which Obama did well might have been particularly receptive to Republicans in a close election.)

Throwing this up on a graph (with Coakley’s dropoff on the vertical axis and Obama’s margin on the horizontal), we get:

You’ll see a few outliers here: the point at the origin you can throw out – that’s Boston Precinct 01-15, which last had a voter in 2004. The correlation on that is 0.83 0.816, suggesting quite a strong relationship.

Taking the geekery to the next level, I busted out the extraordinarily helpful Stata (how academic of you, my SPSS-using friends tell me…):

For those who are less of statistics nerds than I am, the regression tells us two main things:

  • For every point increase in Obama’s margin in a voting unit (precincts within Boston, towns elsewhere), we can expect Coakley’s performance relative to Obama’s to improve by 0.14%.
  • For a hypothetical voting unit that was exactly tied between Obama and McCain, we should expect a 17% swing away from Coakley.

Applying this to South Boston, we see that there isn’t really a pattern: some precincts had drop-offs more than to be expected, others had less.

There really isn’t much a discernible pattern here, again, supporting the conclusion that while Southie didn’t like Martha, they didn’t indicate their dislike for her through their votes more than the rest of the state did.

This can all be represented visually as well:

The last benefit of getting the Boston data was I could finish results of the Senate Race by CD. As we’d already known, they weren’t pretty, but here’s the results table just as a freebie:

Help a Howard Dean Democrat Win Scott Brown’s Seat

Beltway political pundits are pointing to Scott Brown’s recent U.S. Senate victory in Massachusetts as a sign that Republicans nationwide should be excited about their prospects in November.

You know what would be a terrific rebuke to that false logic: a progressive Democrat winning the historically Republican state senate seat that Scott Brown gave up upon his election to the U.S. Senate.  Turning the Scott Brown seat from dark red to bright, progressive blue would make a resounding statement with these political pundits and be a big victory for progressive change.

Dr. Peter Smulowitz is that progressive Democrat!

Dr. Smulowitz is a health care expert and progressive Democrat, very much in the proud, progressive tradition of Dr. Howard Dean.  He will bring to Massachusetts government innovative ideas on reducing health care costs while focusing on primary and preventative care – ideas that can be duplicated in states across America.  Dr. Smulowitz will fight for economic growth and job creation, particularly by easing the tax burden on small businesses and promoting investment in green industries.  He will fight to make government more transparent and responsive to its citizens.  And he will always fight for civil rights and privacy rights, including protecting marriage equality for same-sex couples and reproductive rights for women.

The primary in the special election to fill Brown’s old state senate seat is in just a few weeks, on Tuesday, April 13.  Dr. Smulowitz needs your help in the Democratic primary to make sure that a Howard Dean progressive can succeed the conservative Scott Brown.  Dr. Smulowitz has a primary challenger, a hack in the state legislature who was formerly a member of the state House leadership under two consecutive House Speakers, Tom Finneran and Sal DiMasi, who both eventually became convicted felons and who both represent what is wrong with Massachusetts state government.  This hack’s ties to the convicted felon former Speakers make her completely unelectable in a general election.

On the other hand, Dr. Smulowitz can help champion progressive change by winning conservative Republican Scott Brown’s old State Senate seat.  But we need your help in the progressive blogosphere!

Please join our fight to help a progressive Democrat, rather than an establishment hack, win the primary and have the opportunity to turn the Scott Brown seat blue.  Please make a contribution today via ActBlue!

The pundit class thinks that Senator Ted Kennedy’s seat going to Scott Brown is a big, bad omen of what is to come for Democrats in November.  Electing a Howard Dean Democrat, Dr. Peter Smulowitz, to succeed Scott Brown would turn that omen on its ear and send a poweful message of its own.  Please join our fight!

On the web:

*Dr. Peter Smulowitz for State Senate campaign website

*Contribute to Dr. Smulowitz’s campaign via ActBlue

*Become a fan of Dr. Smulowitz on Facebook

*Follow Dr. Smulowitz on Twitter

My Assessment of Massachusetts

Last night’s victory by Republican Scott Brown over Democrat Martha Coakley for Ted Kennedy’s Senate seat in the Bay State was certainly one of the biggest political shockers in my lifetime. The fact that in happened on the eve of the first anniversary of the Obama presidency also leaves a sour taste in everyone but Republican’s mouths.

My view is the Democrats got complacent with “safe” seats, and Republicans can get that way also as we’ve seen in the last 4 years when they just kept losing. The Democrats were so used to Ted Kennedy holding onto his seat, they thought it would be a lock for them and they could run just about anybody, no matter how terrible a candidate he or she was. Brown managed to develop what I thought was a great one-liner in response to David Gergen: “It’s not the Kennedy seat, it’s the People’s seat!”

All the telltale signs that this was not a safe Democrat haven since at least 1990 were there. William Weld, Paul Cellucci, and Mitt Romney weren’t accidents. If they could win the governorship with that much success, it was only a matter of time before they managed to ascend to higher office. Hell, Brown even made Coakley look like an elistist with his driving around in his GMC Truck. Can you say “Fred Thompson 1994”?

For a party that emphasized reaching out to Indpendents in 2008, how in the world did they not realize that Independents now outnumber either party affliation is staggering. Either people out there honestly did not approve of HRC, or they didn’t understand it because Democrats on the ground weren’t campaigning hard enough up to this vote to gain ground with Independents. I would argue that the latter point is more accurate. Democrats like Coakley and Obama pretty much failed to actually campaign until the last minute, allowing Brown to capitalize. How else do you explain a 30 point lead for Coakley evaporating virtually overnight?

Where I come from, I know of a party that had been in office for a long time. They thought the other guys could never beat them and they got complacent. Guess what? The Liberal Party of Canada is in opposition today, and the best leader we could come up with was a guy who spent 30 years away from Canada and was recently a professor at, coincidentially, Harvard. While Democrats haven’t been in control in the amount of time Liberals had been, the same situation seems to be present. They need to pick up their game and campaign hard, or else they can start to lose safe seats like they did last night.

MA-Sen: Jeff’s Election Night Projection Model

I’m as freaked out over Massachusetts as anyone – and I might be plenty angry/despondent/confused/hungover tomorrow morning.

But in the meantime, I’ve been working on a crude projection model using, in part, the “baseline” idea that Crisitunity and DavidNYC have made a part of SSP Election Night Tradition.

The model, as inputs, takes partial results from towns that have reported, and outputs a whole slew of numbers comparing the current situation to the “baseline” numbers.

Explanations below the flip.

So here’s the front end of the model:

http://spreadsheets.google.com…

You’ll see a few things:

  • How Coakley and Brown are currently doing.

  • How Obama was doing in 2008 with the same towns and parts of towns reporting.

  • How a 2008 “baseline” Democrat on target to win by 1 vote would be doing.

  • How Kerry was doing in 1996 against Bill Weld with the same towns and parts of towns reporting.

  • How a 1996 “baseline” Democrat would be doing.

You’ll also see comparisons between Coakley’s performance and those of Obama, Kerry, and the two “baseline” Democrats.

Perhaps most significantly, you’ll see the “2010 Projection using 2008” line.

The model compares relative turnout between 2010 and 2008, and the relative performances of Coakley and Obama to project results from towns that have not yet reported.

The “2010 Projection using 1996” line does the same, except with 1996 data.

I’m not claiming this model is perfect. In fact, it’s pretty damn bad. I can think of a few glaring weaknesses:

  • The fundamental problem of the ‘baseline’ idea: it assumes that every town will swing uniformly.

  • Disparate turnout: this model compares turnout in aggregate, instead of at the town level. This may lead to an overestimation of turnout in areas with relatively low turnout (compared to 2008 and 1996) and the reverse in areas with relatively high turnout. This may potentially bias the projections in Coakley’s favor.

  • Assumption of town uniformity: the model assumes that each town votes uniformly the same way, but…Jamaica Plain and Southie are not going to vote the same way, very simply. If a relatively Brown-friendly area of a town reports first, this will bias the projection in his favor. The reverse is true if a Coakley-friendly area reports first.

Incidentally, here are the blood and guts of the model: http://spreadsheets.google.com…

Update: In columns AS, AT, BB, and BC, you can see baselines for every town for both 2008 and 1996.

I threw in some junk results to test it, and so far I didn’t detect any coding errors. I don’t pretend that I’m better than the Associated Press – but I just want to have an idea of where we are at each point of the results phase.

Hopefully I’ll get a chance to keep this updated as results stream in tonight.

Lastly, if you live in Massachusetts, are reading this, and you haven’t voted (assuming you’re a citizen, not a convicted felon, etc..), what the hell’s wrong with you?!

Here’s hoping Coakley pulls this off.

What to Look For in the Massachusetts Special Election

By: Inoljt, http://mypolitikal.com/

Results are soon pending in the special election to replace Senator Ted Kennedy. Once a guaranteed Democratic victory, the race has become surprisingly competitive due to a bad national environment and a lackluster campaign run by Democrat Martha Coakley. In fact, several polls have put Republican Scott Brown in the lead, striking panic amongst the Democratic establishment.

Interpreting incomplete results can be difficult if one is not familiar with how different areas in a state vote. Senator John McCain, for instance, led the vote in Virginia during much of election night; this was because deep-red rural Virginia reported first. After Democratic strongholds in Northern Virginia began posting, Barack Obama quickly pulled away (he ultimately won by 6.30%). Because Massachusetts is rarely competitive outside of gubernatorial elections, geographic unfamiliarity probably extends to even most politically active folk.

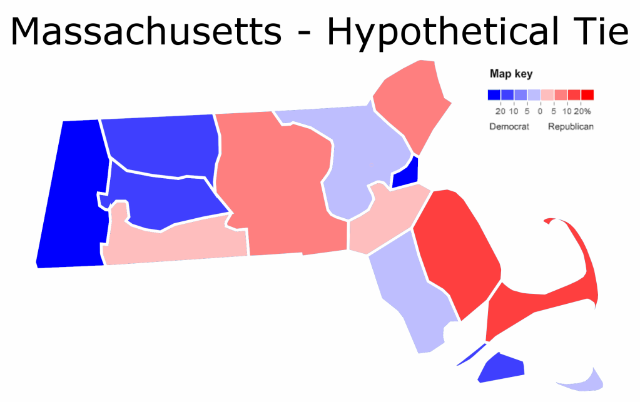
I have therefore created a map indicating what a tied election would probably look like:Photobucket

More below.

Interpreting incomplete results can be difficult if one is not familiar with how different areas in a state vote. Senator John McCain, for instance, led the vote in Virginia during much of election night; this was because deep-red rural Virginia reported first. After Democratic strongholds in Northern Virginia began posting, Barack Obama quickly pulled away (he ultimately won by 6.30%). Because Massachusetts is rarely competitive outside of gubernatorial elections, geographic unfamiliarity probably extends to even most politically active folk.

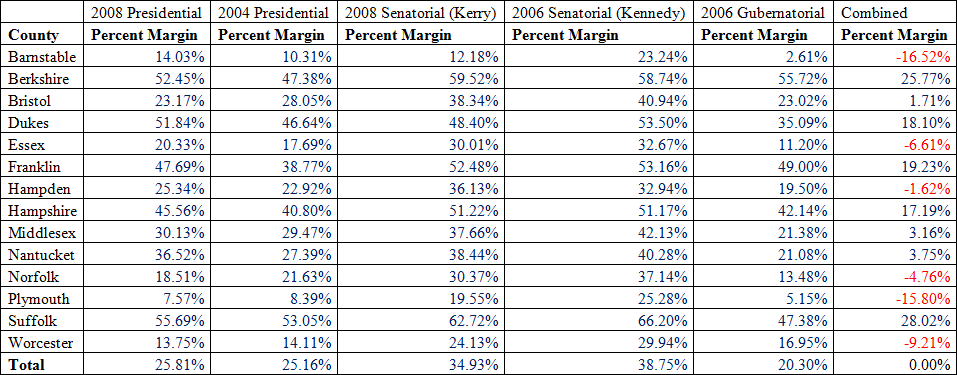
This map takes data from all statewide elections since 2004, derives the electoral lean of each county, and then averages these results to produce the picture. Here is the data by county:

Photobucket

Ironically, Republicans do better in the most populous counties – the opposite case for the nation in general. Republicans are strongest in the state’s suburbs; Scott Brown will need to win all of them to take the state (on the other hand, these wins need not be exceptionally large). On the other hand, Democrats do best in the city Boston and the more rural western reaches of the state.

Thus on election day when the results start coming in, take a look at the above table and compare it to the actual performances each candidate is posting. Whichever candidate is generally outperforming the table will likely win the election. Finally, look at who is winning Hampden and Bristol counties – the two places that vote closest to the state as a whole. If Martha Coakley is winning them, expect a Democratic victory. If Scott Brown is, then a Republican shocker is in the works. If the two are split, it will a nail-biter that goes deep into the night. There have been not many of those lately.

Whatever the case, tomorrow Tuesday ought be an exciting day for politics buffs. There are not many races where the result has been so uncertain – where practically anything can happen and it would not be surprising for the polls to be completely off. It will be quite interesting to watch.

MA-Sen: Coakley +8 according to Research 2000

500 LV, MoE +-4%, 12-13/1

Martha Coakley (D) 49%

Scott Brown (R) 41%

Joseph Kennedy (L) 5%

The electorate is 40% Democratic, 18% Republican and 42% unenrolled/independent. Brown leads the latter by 49-36.

http://www.bluemassgroup.com/u…

And breathe. Hopefully this means the ads are sinking in and making Democrats get off their behinds for next Tuesday. President Clinton is up there tomorrow and First Read reports a Vicki Kennedy ad is in the can and ready to go up before the weekend.

Why Did Hillary Clinton Win Massachusetts?

By: Inoljt, http://mypolitikal.com/

I think we all remember the 2008 Democratic primaries, that exciting and epic battle. In many ways the campaign caused more excitement than the general election, whose result was never really in doubt (especially after the financial crisis).

Both candidates drew upon distinctly different coalitions. In an influential article, Ronald Brownstein analyzes the difference this way:

Since the 1960s, Democratic nominating contests regularly have come down to a struggle between a candidate who draws support primarily from upscale, economically comfortable voters liberal on social and foreign policy issues, and a rival who relies mostly on downscale, financially strained voters drawn to populist economics and somewhat more conservative views on cultural and national security issues.

President Barack Obama assembled a coalition from the former, these “wine-track” Democrats. When most Americans think of liberals, they think of wine-track Democrats. Mr. Obama, then, was the liberal candidate; Mrs. Clinton the “beer-track,” working-class representative.

So candidate won the most liberal place in America?

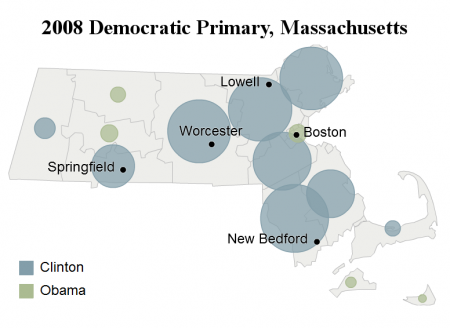
In fact, Secretary of State Hillary Clinton won the state of Massachusetts (you may have realized this by reading the title of this post). The result wasn’t even close; Mrs. Clinton’s margin was 15.37%.

Photobucket

These results are most strange. Barack Obama supposedly built a coalition upon liberal Democrats – yet he lost Massachusetts, the very image of liberalism. He then proceeded to win the nomination.

I will attempt to explain this puzzling result below.

There are several elements to it. Firstly, the state Massachusetts does not contain as many wine-track Democrats as most Americans tend to think. Rather, it includes a number of working-class, beer-track Democrats. These voters support Democrats based upon economic issues (which is not to say they are socially conservative). The state holds a strong union presence along with a high percentage of Catholics, numbering almost half the population. While in many places Catholics no longer vote Democratic, in Massachusetts they still are loyal to the party. According to exit polls, Catholics (45% of voters) went for Clinton by a 2-1 margin, while union households (27% of voters) supported Clinton 60-35.

Nevertheless, Clinton’s overwhelming victory remains surprising. Taking working-class support for Clinton into account, one still would expect Obama to do relatively well.

Remember, however, that this is Hillary Clinton we are talking about. Hillary Clinton, the champion of women’s rights. Hillary Clinton, the powerful and polarizing First Lady conservatives absolutely hated. Though the memory has dimmed, Hillary Clinton once stood at the forefront of “wine-track” liberalism. In February 5th, 2008 many liberal Democrats still remembered Hillary the feminist. Only later did Hillary the working-class fighter emerge.

Moreover, at that time Barack Obama continued to be a relative unknown, a bolt of lightning who had come out of nowhere. Hillary Clinton, therefore, made substantial inroads into Obama’s coalition, just as Obama took away a central pillar of working-class Democrats (blacks). Exit polls indicated that 62% of women supported Clinton (36% supported Obama); progressive white women probably went for her even more strongly. Throughout the primaries, Jews and gays (both deeply liberal groups) tended to support Clinton.

I am not terribly satisfied with this analysis; it does not seem to fully explain how the most liberal state in the union supported the more conservative candidate. The result perplexes me even today.

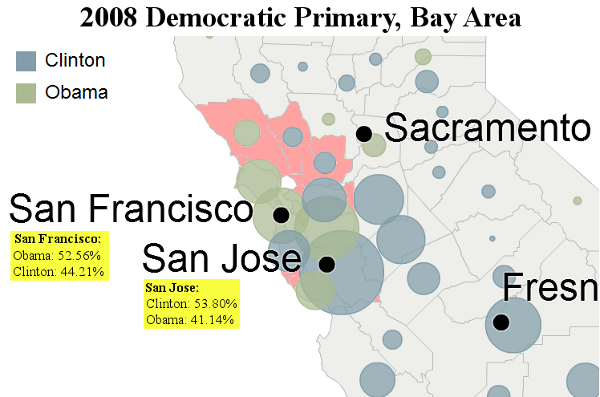
Nor did Massachusetts constitute an anomaly; Clinton did well in other liberal areas. She and Obama, for instance essentially tied the San Francisco Bay Area:

Photobucket

Reasonable explanations behind this result also exist. Working-class Latinos gave Clinton strong support; thus her large margins in heavily Latino San Jose and Fresno. Moreover, upper-class Asians – a major Bay Area constituency – supported her 3-1.

Yet the fact remains that, out of the two most liberal regions in the nation, Hillary Clinton won a landslide in one and tied another (if one adds together the Bay Area’s nine metropolitan counties, Obama actually wins by 1.2%). All this against an opponent whose base lay amongst liberal Democrats. It is all very puzzling.

Note: All images are modified pictures taken from the NYT.

Redistricting Massachusetts: Anti-Lynch Gerrymander

This is my first redistricting diary. I’ve used Dave’s redistricting before for other states; I’ve just never cared to post it. I chose to do Massachusetts, which is poised to lose one seat in 2010. Barring a Republican win at the state house (which is increasingly unlikely with the candidacy of Tim Cahill), Democrats should be able to push through a liberal gerrymander. Here were my goals:

1. Take out Stephen Lynch: Lynch is the very definition of a DINO. He represents a D+11 district, but votes like a Blue Dog. I don’t know a single progressive in Massachusetts that doesn’t have sweet  dreams about primarying him.

2. Make sure that all representatives continue to live in the district they represent: This, I knew, would be hard, considering that 4 representatives live in Middlesex county alone, but it remained important to maintain the Democratic machine

3. Make the state look less gerrymandered: This, for reasons described above would also be hard, but I hoped that I could, at the very least, make my map look better than this:

4. Give Boston a compact district: Just personal, for me. I want the best city in the country to basically have a district all to itself

Here’s what I came up with:

State Map:

Image Hosted by ImageShack.us

Boston area:

Image Hosted by ImageShack.us

District 1-Blue-John Olver(D): I know that others who have redistricted MA decided to take out Olver, because of his age, but, again, my goal is to send Lynch packing.  This district loses some territory in Berkshire and Worcester, but gains in Middlesex and Norfolk (this was to allow other representatives to eat up Lynch’s strongholds in center-east Norfolk). Olver retains his home base in Amherst (assuming he runs). Looks a little gerrymandered, but it isn’t too bad, in my opinion.

District 2-Green- Richard Neal(D): This district just changed to take in more population. Gains territory from District 1 in Berkshire and Worceter.

District 3-Purple-Jim McGovern(D): Out of all the districts, this one probably looks the most gerrymandered. I had to make sure that McGovern kept his home base in Worceter (the city) while still gaining most of Frank’s territory in Bristol  (so that Frank was free to eat up the bulk of Lynch strongholds). McGovern will be very happy with this district, since he’ll probably be even safer than he was before (if that’s even possible)

District 4-Red-Barney Frank(D): Yeah, I know, Frank isn’t going to exactly be thrilled about this district, but I had to make do. He loses strongholds in exchange for Lynch territory (which is obviously less progressive) in Norfolk. But he retains his home in Newton and a stronghold in Taunton, and he also picks up territory in the city of Brockton, which is decently progressive. Frank’s margins may go down, but it won’t be my much. He’ll be fine.

Note: Theoretically, since this district contains a lot of his old strongholds, Lynch could run here, but I doubt he’d want to go head up against Frank.

District 5-Yellow-Niki Tsongas(D): Not much going on here, really. Tsongas loses some territory in Essex and gains some in Middlesex, at the expense of Markey. Her margins shouldn’t change at all, and she ratains her base in Lowell.

District 6-Turquoise-John Tierney(D): I decided to make this more compact, putting almost all of it in Essex. I did, however, have to give Tierney the town of Melrose to avoid splitting Methuen between two districts and retain population equality. Looks a bit prettier than before, and Tierney should have an easier time when he is essentially responsible for one county.

District 7-Gray-Edward Markey(D): This will be the Boston suburb district. It contains every town and city adjacent to Boston except for Newton (where Frank lives) and Somerville (where Capuano lives). Markey keeps his home in Malden, and should be happier with this more compact district

District 8-Light Purple-Stephen Lynch (D) vs. Michael Capuano (D): This district contains all of Boston, as well as Capuano’s home in Somerville and a small bit of Norfolk. I’m hoping that something like this will put Lynch in a rage, since he loses all of his old district in the moderate parts of Norfolk and Plymouth and now has to deal with the entire city of Boston. Given that this is urban and the most liberal district in the state (indeed, it would rank pretty high nationwide, I’d imagine), I’d expect Capuano to be favored on his merits (he should also win the labor backing), though things could get interesting if Lynch is still ahead in the money column. Another thing: at only 53% white, this district is almost minority-majority, and could very well be in a decade or so.

District 9-Teal-Bill Delahunt(D): I knew that Lynch might try to be clever and run in this district with this map (even though he lives in Boston), so I had Frank’s district take up as much of Norfolk as possible. Now this district is just Quincy (Delahunt’s home base), a small bit of Lynch’s old territory, and the Cape, where Lynch isn’t accustomed to.

Redistricting 2011: Mass. & Texas

Crossposted at Daily Kos

With the 2010 Census just a year away and the next round of nationwide redistricting two or three years away, I’ve decided to start looking at the redistricting situations in different states and begin some conversation about what kinds of changes we can expect to see. These diaries will be sporadic, and the data is always subject to change (for now, county population estimates are from 2007; 2008 numbers will be out soon, meaning my number-crunching will need constant adjusting)…but for we super-geeks, merely the discussion of redistricting and speculation on its effects will be sufficiently entertaining.

My “state focus” redistricting diaries will cover two states, usually one large and one a bit smaller.

Today, I was feeling the vibes of 2004, so we’ll delve into Massachusetts and Texas. Below the fold…

Massachusetts

The redistricting process in Massachusetts is expected to be run by the Democrats in 2011-2012, and even if Gov. Deval Patrick manages to lose to a Republican in 2010, it won’t make much difference for the sake of district maps; all ten congressional incumbents are left-of-center Democrats.

Unfortunately, Massachusetts is likely to lose one seat due to its lagging population growth. You can see the current Mass. congressional map (and it’s quite a mess; the late Bay Stater Elbridge Gerry himself would be proud) here.

So I tried to think like a Democratic state legislator forced to eliminate one of his/her own from Congress. Seeing that population growth was weakest in western Massachusetts, and that Rep. John Olver (D-Amherst) will be 76 at the 2012 election, it seemed logical to combine western Mass’s two districts and force Olver against his then-63-year-old colleague, Richard Neal of Springfield. Most think Olver would retire if pitted against Neal. The other eight seats mostly fell into place, though I dramatically redrew some of them for cleaner, more compact district lines. This was tough because four Congresspeople call Middlesex County home, yet I wanted to avoid splitting counties too many ways. It is doubtful that the legislature will be as averse to messy lines as I was, but this is a rough approximation of what I see coming out of the next round of redistricting (and yes, I think all nine seats should be comfortably Democratic):

Mass.

District 1 – Olver vs. Neal

District 2 – Jim McGovern (D-Worcester) — picks up the remainder of Hampden County not covered by District 1 but anchored in Worcester County.

District 3 – Barney Frank (D-Newton) — now entirely within Middlesex County.

District 4 – Niki Tsongas (D-Lowell) — dominated by Middlesex, picks up the remainder of Worcester.

District 5 – John Tierney (D-Salem) — now entirely within Essex County, ye olde witch-hunters.

District 6 – Ed Markey (D-Malden) — dominated by Norfolk County, nabs the small remainder of Essex and enough of Middlesex to retain Markey’s home base.

District 7 – Mike Capuano (D-Somerville) — why can’t he just move to Boston? This district grabs 96% of Suffolk County, but had to eat into a tiny section of Middlesex to keep his home intact.

District 8 – Stephen Lynch (D-South Boston) — this one changes significantly: it retains his base in South Boston but is now dominated by Bristol County, theoretically rendering him vulnerable to a primary challenge (not my intent by any means, but the bizarre lines in Middlesex, Suffolk, and Norfolk Counties simply had to end).

District 9 – Bill Delahunt (D-Quincy) — still the Cape Cod/Nantucket district, preserving his home in Norfolk but dominated by Plymouth and Barnstable Counties.

In the end, Massachusetts wasn’t too hard. Certainly not compared to Texas, a state of 32 seats that is expected to gain another four!

Texas

Barring a huge slowdown in migration during 2009 and before the Census on April 1, 2010 (and such a slowdown is possible), Texas should gain four seats for a whopping total of 36 districts. The Republicans currently hold the state government trifecta in the Lone Star State, but only with a fragile 76-74 lead in the state House. Democrats are bullish about winning the House in 2010.

The opportunity to prevent a wrenching repeat of the 2003 DeLaymander in Texas is an exciting one for political junkies, but if my map-making experiment (again, using 2007 estimates, so take with salt) was at all accurate, Republicans are nearly maxed-out on seats in Texas as it is. I attempted in this venture to put on my thinking cap, imagine I was a Republican state legislator, and work to protect all GOP incumbents, weaken Rep. Chet Edwards (D-Waco), and maximize GOP advantages in the four new seats…but because of where the four new seats ended up being located in my simulation, I can’t really imagine Republicans winning more than two of them. Of course, their map artistes are surely far superior in skill to me and my low-tech method, but the point stands: once all 32 incumbents were done, I found significant leftover population in urban Dallas-Fort Worth and Houston, in areas I would expect to tilt Democratic given voting trends in Harris and Dallas Counties.

The other two seats were odd rural-urban mixes that meander and should lean Republican (especially the one stretching down Central Texas from Tarrant County). Here’s the map:

Texas

Texas is so large, and its urban seats so small in area, that you can’t even see some of the 36 districts, so here are the details on each one:

District 1 – Louie Gohmert (R-Tyler) — stays safely GOP, merely contracts in area.

District 2 – Ted Poe (R-Humble) — ditto

District 3 – Sam Johnson (R-Plano) — I chose to keep this entirely within Collin County for purposes of compactness.

District 4 – Ralph Hall (R-Rockwall) — remains an odd mix of rural northeast Texas and the far outskirts of the Metroplex.

District 5 – Jeb Hensarling (R-Dallas) — snatches exurbs and small towns in East Texas, but Dallas County is still the largest population source.

District 6 – Joe Barton (R-Ennis) — looks rural on a map but is in fact dominated by Tarrant and Ellis Counties.

District 7 – John Culberson (R-Houston) — entirely within Harris County

District 8 – Kevin Brady (R-The Woodlands) — grabs 92% of Montgomery County and conservative marshy areas north of Houston.

District 9 – Al Green (D-Houston) — dominated by Houston but catches diverse parts of Fort Bend County to remain a Voting Rights Act African-American opportunity seat.

District 10 – Mike McCaul (R-Austin) — still the Austin-to-Houston seat, but weighted more toward Austin.

District 11 – Mike Conaway (R-Midland) — with 35 counties by my count, this is one rural district if ever I’ve seen one.

District 12 – Kay Granger (R-Fort Worth) — dominated by Tarrant, but kept safely GOP because of Parker and Wise Counties.

District 13 – Mac Thornberry (R-Clarendon) — no, actually, this is one rural district if ever I’ve seen one, with 44 counties wholly or partially included.

District 14 – Ron Paul (R-Surfside) — dominated by Brazoria and Galveston Counties, contracting a bit in area due to population growth.

District 15 – Rubén Hinojosa (D-Mercedes) — might be a tad whiter due to shedding some of Hidalgo County and picking up conservative areas up north, but still heavily Hispanic and Democratic.

District 16 – Silvestre Reyes (D-El Paso) — still contained in El Paso County.

District 17 – Chet Edwards (D-Waco) — I tried to think like a Republican and mess with him a bit by edging the district a bit further southeast and even into Montgomery County, but there’s only so much more that can be done to hurt this Dem survivor.

District 18 – Sheila Jackson Lee (D-Houston) — smaller in area, but should still be a VRA “African-American opportunity seat”.

District 19 – Randy Neugebauer (R-Lubbock) — Republicans might like to make him, Thornberry, and Conaway a bit less overwhelmingly safe to help the party elsewhere, but unfortunately for the GOP, its votes are concentrated thickly in West Texas.

District 20 – Charlie Gonzalez (D-San Antonio) — still heavily Hispanic, still entirely within Bexar County.

District 21 – Lamar Smith (R-San Antonio) — I removed Travis County to 1) make him even safer, 2) allow him to concentrate his base in Bexar County, and 3) keep GOP Hill Country voters together.

District 22 – Pete Olson (R-Sugar Land) — anchored in Fort Bend but snaking into Harris and Wharton; probably safer for Olson than before but trending the wrong way long-term for his party.

District 23 – Ciro Rodriguez (D-San Antonio) — the Big Bend district is still dominated by south San Antonio and is probably a bit more heavily Hispanic.

District 24 – Kenny Marchant (R-Coppell) — links northeast Tarrant with northwest Dallas Counties to preserve suburban GOP votes.

District 25 – Lloyd Doggett (D-Austin) — I think the Republicans will finally put him entirely in Travis County to pack Democratic votes and keep fast-growing Central Texas counties open for the taking. They’ve certainly given up on defeating him.

District 26 – Mike Burgess (R-Lewisville) — all of Denton County and a small slice of Tarrant.

District 27 – Solomon Ortiz (D-Corpus Christi) — really doesn’t change much; heavily Hispanic and Democratic-leaning.

District 28 – Henry Cuellar (D-Laredo) — growth is so strong in Hidalgo County that this district sheds its northern reaches and becomes possibly the state’s most Hispanic seat. 90% of Cuellar’s Webb County base is preserved but he could become more vulnerable to a McAllen-area primary challenge.

District 29 – Gene Green (D-Houston) — still a tiny sliver of Harris; I assume it will stay majority-Hispanic, but that mantle could be taken up by the new 35th…I’m not familiar enough with Houston geography.

District 30 – Eddie Bernice Johnson (D-Dallas) — concentrates black neighborhoods of Dallas.

District 31 – John Carter (R-Round Rock) — growth in Williamson County has been stupendous enough that this district is becoming surprisingly small in area.

District 32 – Pete Sessions (R-Dallas) — desperately attempts to grab Republicans in north Dallas.

And now, the four new seats as I found them:

District 33 – Dallas & Tarrant Counties — this lilliputian snake of land vaguely recalls Martin Frost’s (D-Arlington) former stomping grounds, a diverse urban-suburban Metroplex mélange presumably leaning Democratic. In fact, I’m fairly sure of it electing a Democrat, as Republicans have milked every seat they possibly can out of the Dallas area.

District 34 – remainders of Tarrant County, stretches all the way to Guadalupe County near San Antonio — this is an ugly district, with a barely-visible serpentine line down Williamson and Travis Counties. It is meant to find all the Republicans not already accounted for in the 12th, 17th, 21st, or 31st, but I would certainly hope the legislature doesn’t try to draw something so incoherent.

District 35 – Harris County — unlike the masterful DeLay-led cracking of Democratic votes in Dallas-Fort Worth, Houston already has three Democratic Reps., but all in VRA opportunity seats. Is it time for a “limousine liberal” seat in Houston, or is there room for another John Culberson-like Republican?

District 36 – arches from north of Laredo through San Antonio to the coast — less bizarre than the 34th, but still an oddity, this seat’s population base is Bexar County but should elect a Republican despite its decent Hispanic population. The odd nature of this district was necessitated by VRA Hispanic seats like the 23rd and 28th dropping their “whiter” counties. If Henry Bonilla (R-San Antonio) ever wanted to stage a comeback, my 36th would be a great shot for him.

I’m not exactly pleased with some odd boundaries in this map, especially the downright psychedelic 34th District. The explosive growth in three areas — the Metroplex, Houston, and Central Texas around Austin — meant some odd leftovers when all incumbents were solidified. But the real point here is that, even if Republicans still run the process in Texas next round, their room for growth is limited. My plan might allow them as great as a 24-12 majority should they defeat Chet Edwards, but 23-13 is more likely. Perhaps an experienced Friend of Elbridge (and by that I mean a professional gerrymander-er) could craft something more advantageous, but as long as Democratic strength grows in the metro areas, protecting suburban GOP incumbents like Kenny Marchant, Kay Granger, and Pete Olson will be the utmost priority. I really think redistricting could be a wash in the Lone Star State, whether Republicans control the House or not.

The next diary will map Michigan and Nevada; after that, we’ll get Iowa and my greatest masterpiece to date, Ohio.

MA-SEN: Kerry In Trouble?

I didn’t expect to be writing any diaries about the Massachusetts Senate Race, but I have been suspecting for some time that John Kerry might be wearing out his welcome. And now, according to a Suffolk University Poll, it appears to be just the case.

Senator John Kerry, who recently left the door open to a Presidential bid in 2008, could have problems staying in the US Senate.  When voters were asked whether Kerry should run for another six-year term in 2008 or if it is time to give someone else a chance, just 37% indicated that he should seek re-election while 56% said that it was time to give someone else a chance. Among political parties: 76% of Republicans, 62% of Independents, and 39% of registered Democrats said that it was time to give someone else a chance.

“This poll is showing us the early warning signs of a political storm for John Kerry,” said Paleologos.  “He may best be served by coming home to Massachusetts and taking care of business.”

Personally, I don’t think that coming home will be enough because Kerry has had a tough time before, and I’m not talking about 2006. Even before his legendary race against William Weld, he ran into a touch one six years earlier against James Rappaport who was, for a while, able to paint Kerry as a do-nothing Dukakis clone. Kerry fought his way partially helped by the fact that it was a Democratic year (and an excellent debate). What he has going for him heading into 2008 is a limp Republican Party with no one put against him. However, Massachusetts has never warmed to him the way they have with Ted Kennedy. If the Republicans somehow find someone al a Weld, he could be in serious trouble. It may be time for him to stand down.