Revisiting Nevada Redistricting: All About Shelley… And Sharron?

(Also at Nevada Progressive)

Here we are again. What, you thought one map was enough? Now that the US Senate race is heating up and speculation is picking up on who will be doing what, I wanted to explore alternative scenarios to one I posted earlier this month. So here’s another option… But I have to warn you, it isn’t pretty.

So what if Shelley Berkley doesn’t run? Last time, we just assumed she was, and certain legislators hope she will so that they can redesign the 1st Congressional District (and form the brand new 4th) to their liking. But hold on, what if Shelley doesn’t run? Certain folks in DC have already been whispering they prefer someone else run for Senate. And now that Dean Heller is officially in the race, they’re making their views more public that they want someone, like Ross Miller or Catherine Cortez Masto, who has already proven ability to win statewide.

So what if Shelley doesn’t run? This is the scenario I explore in the map below.

Share photos on twitter with Twitpic

Share photos on twitter with Twitpic

NV-02 (The Dark Green District)

Population: 674,966

69.3% White (73.8% voting age)

The State of Play

The geographic map hasn’t changed since last time, but the political one certainly has!

Who’s All In?

Again, it’s now official that Dean Heller is running for US Senate. And now that he’s endorsed Heller for Senate, current Lieutenant Governor Brian Krolicki (R) just may be angling to replace Heller in this seat. And on paper, he seems like the ideal candidate: libertarian-conservative, but not too extreme, and very focused on Nevada issues. However, there are three drawbacks for him:

The Wild Cards

– One, Sharron Angle hasn’t yet figured out where she will run. (And yes, it’s pretty much settled that she WILL run for federal office again!) If she runs for Senate again, it will mean extra heartburn for Heller. But if she runs for this seat again, it will mean extra trouble for Krolicki.

– Two, the outspoken and controversial former USS Cole commander Kirk Lippold has already hinted he’ll also run in NV-02, and Nevada “tea party” icon Chuck Muth may already be anointing him as “THE Tea Party’s Favored Son”. So if Sharron Angle runs for Senate instead and Nevada GOP Chair Mark Amodei remains adamant about staying in the race (and potentially siphoning away critical GOP establishment support for Krolicki), this could be a recipe for yet another embarrassing setback for Krolicki and the Nevada GOP.

– And three, the unexpected may finally happen: A prominent A-List Democrat, State Treasurer Kate Marshall (D), is now considering running. If this comes to fruition and the GOP nominee is either weakened by a brutal primary and/or someone that the GOP establishment won’t be happy to support, then NV-02 just might do the unthinkable for the first time ever (elect a Democrat).

2010 US Senate Results

49.6% Angle (R)

43.8% Reid (D)

Estimated 2008 Presidential Results

49% Obama (D)

48% McCain (R)

Estimated Cook PVI: R+4

Early Race Rating: Leans Republican for now, Tossup if Sharron Angle or Kirk Lippold is the GOP nominee

NV-03 (The Purple District)

Population: 675,257

66.4% White (69.7% voting age)

The State of Play

This district is just slightly more Democratic than its last incarnation, and that’s due to the return of the ritzy Summerlin North and Peccole Ranch (home of Shelley Berkley) Las Vegas neighborhoods to NV-01. The rest of the district remains intact, and the partisan makeup wasn’t too altered thanks to the remaining rural territories and the addition of some semi-rural (Las Vegas) West Side precincts along Sahara and west of Rainbow. And other than forming an even more disturbingly gerrymandered Reno-to-Vegas district, there isn’t anything more that can be done to save Joe Heck. And considering Heck’s recent vote to preserve the FHA program assisting  homeowners with underwater loans (which is badly needed in the district with the highest foreclosure rate in the country), he now realizes he will need to tack to the middle at times and at least pay some lip service to issues Southern Nevada cares about most (like housing and jobs) to win this still closely divided district.

Who’s All In?

See above. Heck looks to be preparing for reelection already. And since there’s a penchant for close elections and for ticket splitting here, he certainly shouldn’t be counted out in a district that President Obama will probably only narrowly win next year.

The Wild Cards

Should Heck prove to be “too independent” for teabaggers’ liking, or if/when he runs for another office later in the decade, State Senators Elizabeth Halseth (R-Northwest) and Barbara Cegavske (R-Summerlin) will likely remain waiting in the wings. But with the removal of Summerlin North, it may be a little harder to find a West Side Democrat to run here. However, Democrats may want to look at the other end of the valley (particularly at a couple folks on the Henderson City Council) for future recruits.

2010 US Senate Results

48.2% Angle (R)

46.5% Reid (D)

Estimated 2008 Presidential Results

51% Obama (D)

46% McCain (R)

Estimated Cook PVI: R+2

Early Race Rating: Leans Republican

Share photos on twitter with Twitpic

NV-01 (The Baby Blue District)

Population: 675,092

43.7% Latino (38.1% voting age), 32.2% White (37.6% voting age), 14.4% African American (14.4% voting age)

The State of Play

Shelley is back… Or at the very least, this seat is hers as long as she wants it. If Shelley Berkley does decide to sit out the Senate race next year and stay in The House for now, she still has a super safe seat ready for her.

This seat is just slightly more Republican than the last version, but still slightly more Democratic than the NV-01 drawn in 2001. And again, that’s just because the district (once again) has to stretch west toward Red Rock Canyon to dip into Shelley’s elegant stomping grounds of Peccole Ranch and Summerlin North. However, this does very much alter the ultimate state of play here.

Who’s All In?

Without Summmerlin, this district can finally send a North Las Vegas politico like State Senators Steven Horsford or Ruben Kihuen to Congress. But with this configuration, high turnout West End ‘hoods like Summerlin and Desert Shores will probably remain quite dominant in the primary, meaning Shelley will go untouched as long as she wants to remain in NV-01…

The Wild Cards

And should she finally run for higher office or retire later in the decade, a Summerlin area Democrat like State Senator Allison Copening (D-Summerlin) or Clark County Commissioner (and Future Las Vegas Mayor?) Larry Brown (D-Las Vegas) definitely has a good chance here. But if Ruben Kihuen can be patient and turn out his enthusiastic “NorTown” base, he will still have a strong fighting chance as this district continues to inch toward becoming majority Latino and supermajority minority-majority. And honestly, neither can Horsford be counted out, especially if he can wait another cycle or two for Shelley to step aside.

2010 US Senate Results

62.5% Reid (D)

33.1% Angle (R)

Estimated 2008 Presidential Results

66% Obama (D)

32% McCain (R)

Estimated Cook PVI: D+13

Early Race Rating: Safe Democratic, regardless of who ultimately runs here

Share photos on twitter with Twitpic

NV-04 (Light Spring Green)

Population: 674,936

48.6% White (53.2% voting age), 27% Latino (23.1% voting age), 11.8% Asian American (12.3% voting age)

The State of Play

It’s still open season here… Perhaps even more so if Shelley indeed decides to stay put next door. The district hooks into The West Side to take whiter neighborhoods left out of NV-01, then jumps down to the increasingly diverse Spring Valley, then hops across The Strip to The East Side and some of East Las Vegas (and ultimately to Lake Mead), then climbs uphill to grab the more Democratic leaning Henderson precincts of Green Valley and Green Valley Ranch, then sweeps through the diverse and increasingly Democratic friendly Silverado Ranch communuity, then hops back across The 15 to snatch some minority-majority neighborhoods in the once rapidly growing Southwest.

Who’s All In?

Need we ask? Rory Reid is probably out of the running for good, and Dina Titus‘ political stock continues to rebound. This time, she just might get a seat she can get comfy in.

The Wild Cards

However, Dina also can’t take this seat for granted. Both Former Assembly Speaker Barbara Buckley (D-Spring Valley) and current Assembly Speaker John Oceguera (D-Silverado Ranch) are eyeing this district, and both have far better relationships with the Nevada Democratic establishment than Dina Titus.

2010 US Senate Results

56.0% Reid (D)

39.3% Angle (R)

Estimated 2008 Presidential Results

60% Obama (D)

37% McCain (R)

Estimated Cook PVI: D+7

Early Race Rating: Likely Democratic, and will probably be downgraded to Safe Democratic so long as the eventual nominee isn’t caught in a Rory-like scandal

Suffice to say, a whole lot changes if Shelley Berkley decides to stay in The House rather than run for Senate. The Clark based districts will probably have to be gerrymandered at least somewhat to keep everyone happy.

And up north, the fate of NV-02 may very well rest on what Sharron Angle decides to do, and what her once ardent “tea party” supporters think of Brian Krolicki and Mark Amodei. If Angle can regain their trust, or if she runs for Senate instead and allows someone like Kirk Lippold to consolidate the tea tinged Northern Nevada far right base, Krolicki may not be in for an easy ride regardless of whether Dean Heller decides to anoint a successor. And with Kate Marshall now eyeing a run here as well, Democrats may actually have a pickup opportunity up north next year.

Home Means Nevada: Redistricting Congress (Part I)

(Also at Nevada Progressive)

It is here. After hours of careful line drawing and days of poring over precinct results, the map has arrived. This is Nevada redistricted, baby!

So will the actual final map look something like this? Honestly, I don’t know for sure. Perhaps legislators on both sides of the aisle will want even safer seats and are willing to configure some gruesome looking districts to get them… Or perhaps last minute talks of redistricting collapse as a casualty in an ongoing state budget brawl, leaving the courts to ultimately draw the lines. But most likely, as is usual tradition, The Nevada Legislature will agree on some sort of last minute budget deal, and on a bipartisan redistricting gerrymander.

Still, this year is different. As population continues to swell in Clark County (Greater Las Vegas), political power is slowly-but-surely shifting southward as well. Clark is destined to pick up as many as three legislative seats from the north, as well as a brand new Congressional District. For the first time ever, three Las Vegas area politicians will likely be sent to The House of Representatives.

And for the first time ever, Nevada will likely have three open House seats! It’s looking increasingly likely that both Rep. Dean Heller (R-Carson City) and Rep. Shelley Berkley (D-Las Vegas) will run for the US Senate seat currently held by John Ensign (R-Sleaze), so legislators may very well be drawing the new district map with this in mind. And more importantly, they will likely be keeping in mind that some of their own, as well as a few powerful friends outside, will want to run in each of these open seats.

Share photos on twitter with Twitpic

In drawing this map, I had several objectives in mind. First, I didn’t want to grossly “over-gerrymander” DeLay style, especially since law suits are already being filed here. But while I didn’t want to go overboard, I did clearly have campaign politics in mind while drawing these districts. There are two minority-majority seats, one having a Latino plurality, designed to elect Democrats, and two seats engineered to be as Republican leaning as possible.

So did I succeed? We’ll have to wait and see. Nevada Democrats may very well see unprecedented primary action in NV-01 and NV-04. And while NV-02 and NV-03 are currently held by Republicans, they will have to continue to fight an increasingly tough battle against changing Reno and Las Vegas demographics in the decade to come.

So enough of me blathering on and on… Let’s check out the new districts!

Share photos on twitter with Twitpic

NV-02

(The Green District)

Population: 675,162

69.4% White (73.8% voting age)

The State of Play

First up, the second district. (We’re starting north, and heading south.) Dean Heller currently represents this seat. And even though he’s only done so since 2007, it seems pretty natural for him. He’s a long time Carson City person (both in residence and in Nevada political experience), and he has a conservative-but-not-too-fire-breathing persona that allows him to win comfortably a district that only barely voted for John McCain (by fewer than 100 votes!) in 2008.

However, this will likely change. Again, Heller may very well soon announce his campaign for US Senate, leaving this seat open for the first time since Jim Gibbons left this seat to run for Governor in 2006. And due to Reno area growth, NV-02 has to shed some rural territory to meet the new Census Bureau population guideline. So what happens?

Long story short, NV-02 is now a district that narrowly voted for Barack Obama and Sharron Angle. It’s a closely divided district that will provide a challenge for the typically mighty Washoe Republicans, in that they will need to settle on a candidate who can please GOP primary voters while being able to win enough moderate voters in the general election to keep this seat in GOP hands.

Who’s All In?

Again, Dean Heller looks to be out, but a final decision hasn’t yet be made, so he might still surprise us by staying put. Of course, there has also been plenty of talk of Sharron Angle running (again) for this seat. Even though she carried this district by 5.8% in her Senate run against Harry Reid last year, 2012 will be a Presidential year with higher Reno area turnout. And as we saw on the campaign trail last year, Angle couldn’t even make peace with her fellow Washoe Republicans, so she will have a much harder time holding onto this seat than someone like Heller (who narrowly beat Angle in the 2006 NV-02 GOP primary).

The Wild Cards

Funny enough, I haven’t heard much gossip (yet) over who may be angling for this seat… Other than the obvious. And even though they were just recently sworn into The State Senate (one elected, the other appointed), Reno Republicans Ben Kieckhefer and Greg Brower may be attractive to GOP leaders as they likely search for electable mainstream conservatives to stop Sharron Angle. On the Democratic side, the options aren’t quite as wide. Nevada State Treasurer Kate Marshall does live in Reno, but she hasn’t expressed interest in running for Congress… Can Sharron Angle change that?

2010 US Senate Results

49.6% Angle (R)

43.8% Reid (D)

Estimated 2008 Presidential Results

49% Obama (D)

48% McCain (R)

Estimated Cook PVI: R+4

Early Race Rating: Likely Republican if Dean Heller runs here again, but upgraded to Leans Republican if Heller runs for Senate, and upgraded further to Tossup should Sharron Angle run to replace him!

NV-03

(The Purple District)

Population: 674,792

66.5% White (69.7% voting age)

The State of Play

In the “Republican Wave” year of 2010, Joe Heck barely won with less than 50% of the vote and by fewer than 2,000 votes. That worries Nevada Republicans, and that’s why GOP legislators (especially those in Clark) will likely go to the mat to make NV-03 safer for Heck.

Mr. “War Hero” Heck could barely beat supposedly reviled “Las Vegas LIB’RUL!!!” Dina Titus by fewer than 2,000 votes, and for Heck’s campaign to succeed in a likely more Democratic friendly environment in 2012, this must change. So it has… At least here on my map.

Dina’s political base is widely acknowledged to be the progressive minded, ethnically diverse, labor union heavy, and LGBT friendly confines of The East Side, also known as “Paradise Township“, which consists the older neighborhoods just east of The Las Vegas Strip. So to shore up Heck, I removed The East Side from NV-03 and placed it instead in the newly created NV-04 seat (more on that later!).

Now in addition to that, Heck also had a problem much closer to home. Even though Heck lives in Henderson, both he and Sharron Angle lost a number of Henderson precincts just down the hill from him in uber-exclusive Roma Hills, in the slightly older (meaning built in the 1980s and 90s) and increasingly Democratic friendly neighborhoods of Green Valley and Green Valley Ranch. So to further shore up Heck, I also placed these areas in NV-04 (again, more on that later, including who this also helps!).

Instead, I gave Heck only the most Republican friendly parts of NV-03, and supplemented them with mostly GOP heavy areas previously in NV-01 and NV-02. The perennially stylish and upscale Summerlin development (including “retiree heaven” Sun City Summerlin) is almost entirely reunited here, and joined by a number of previously fast growing Northwest and Southwest valley exurbs. From there, NV-03 almost exclusively picks up the most conservative neighborhoods of Henderson, including wealthy Seven Hills and Anthem (including “retirement resort community” Sun City Anthem), as well as Old Henderson. In addition, NV-03 takes in all the rural Clark County communities (such as Mesquite, Primm, and Laughlin) outside The Las Vegas Valley.

Oh, and of course, all those rural areas previously in NV-02, from Ely to Hawthorne to Pahrump, have to go somewhere. They end up here… But they could end up being a double-edged sword for Joe Heck.

Who’s All In?

From all indications, Joe Heck wants to run for reelection, and this map will surely entice him to do so again. However, he’s not completely out of the woods yet. In fact, like the situation in NV-02, he will have to balance appealing to moderate suburban voters who may very well vote for President Obama again (who STILL won this district in 2008) with keeping “tea party” GOP primary voters happy. It’s no easy task.

The Wild Cards

Should “Tea Party, Inc.” ever fall out of favor with Heck, or Heck just decides to run for yet another higher office later this decade, they have a number of local GOPers to choose from. State Senator Elizabeth Halseth (R-Las Vegas) is seen by many as a rising “tea party” superstar, and State Senator Barbara Cegavske (R-Summerlin) is a long time right-wing stalwart. They’re basically Vegas’ answer to Sharron Angle, and Cegavske has already dropped hints of a future Congressional run. And of course, it’s not like “Chicken Lady” Sue Lowden is ever really leaving the political stage any time soon.

However, they can easily be stopped cold in their tracks. Why? Look at the partisan numbers. Angle only barely won this district last year, and Obama may very well win this district again next year. Joe Heck may have a hard enough time locking down this seat, but the task becomes even more difficult should he ever leave (or be primaried out).

Even though the rural areas (save for Mineral County) may be incredibly difficult for any Democrat to win, a Democrat may once again win this district if he or she can run up the margin enough in Vegas. In the future, the incredibly smart and talented State Senator Allison Copening (D-Summerlin) may have a once-in-a-lifetime opening to go from Carson’s Capitol to Capitol Hill… Or perhaps it will be Henderson Mayor Andy Hafen, someone from a long-time “Nevada royal family” who lives in the slice of Henderson staying in NV-03… Or maybe wonky “deficit hawk”, Clark County Commissioner, and current Las Vegas Mayoral Candidate Larry Brown (D-Summerlin)?

2010 US Senate Results

Angle (R) 48.5%

Reid (D) 46.3%

Estimated 2008 Presidential Results

Obama (D) 51%

McCain (R) 47%

Estimated Cook PVI: R+2

Early Race Rating: Leans Republican

Share photos on twitter with Twitpic

NV-01

(The Blue District)

Population: 675,212

44.4% Latino (38.7% voting age)

31.7% White (37.3% voting age)

14.7% African American (14.7% voting age)

Share photos on twitter with Twitpic

The State of Play

“Your Favorite Congresswoman”, Shelley Berkley, may soon be looking to move to greener pastures. And who can blame her? She’s back in the minority in The House. She doesn’t have the best relationship with Nancy Pelosi. In many ways, she’s boxed in… Unless she stomps outside that box in her signature bedazzled pumps and forges new ground with a Senate run.

So that may very well happen, and if it does we have yet another open seat battle here in Nevada! But unlike NV-02, all the drama will be in the Democratic primary.

Assuming Shelley runs for Senate, her Summerlin area stomping grounds are moved aside to NV-03 and NV-04, so NV-01 can become more of a minority-majority district and help the state’s Congressional Delegation better reflect the diversity of our fine state.

So instead, some heavily Latino Northeast precincts previously in NV-03 are moved here, even as other heavily Latino East Side precincts are shifted from NV-01 to the new NV-04 seat. Now, Latino and African American heavy North Las Vegas becomes the centerpiece of the district, complemented by the Democratic dominant inner city neighborhoods of Las Vegas.

See the recurring theme here? Notice how this affects the 2012 field below.

Who’s All In?

State Senate Majority Leader Steven Horsford (D-North Las Vegas) had been seen as a rising star for years, but now he’s made it to the top. He’s among the most powerful pols in Carson City today, as well as the highest ranked African American in state government alongside Supreme Court Chief Justice Michael Douglas. His career has been illustrious, but it hasn’t always been easy.

He’s now locked in a tough budget battle with Governor Brian Sandoval (R) and GOP legislators, and he is one of the very people overseeing this entire redistricting process. If he truly wants to run for Congress, he has to make miracles happen in Carson City this year, otherwise…

The Wild Cards

“Conventional Wisdom” here in Vegas may again be turned on its head. After all, this is now a Latino plurality seat. State Senator Ruben Kihuen (D-North Las Vegas) knows this first hand as one of the youngest Senators, as someone raised in an immigrant Mexican American family who climbed his way all the way up here, and as someone who’s succeeded despite earning the ire of the once omnipotent Culinary 226. While Kihuen himself hasn’t expressed interest in running, especially after just being elected as State Senator, his name has been floated around.

State Senator John Lee (D-North Las Vegas) actually has signaled interest in running, but he’s probably too moderate to win the Democratic primary in this district.

And sorry, Republicans, but there are virtually no GOP candidates who even want to try here.

2010 US Senate Results

62.9% Reid (D)

32.3% Angle (R)

Estimated 2008 Presidential Results

67% Obama (D)

31% McCain (R)

Estimated Cook PVI: D+14

Early Race Rating: Safe Democratic

NV-04

(The Red District)

Population: 675,294

49.0% White (53.4% voting age)

27.0% Latino (23.2% voting age)

11.5% Asian American (12.0% voting age)

Share photos on twitter with Twitpic

The State of Play

This is the story of “The Comeback Kid”. After being beat up and beat down, it’s time to rise again and shine in the glorious Mojave Desert Sun. But wait, whose comeback are we talking about?

Can it be Dina Titus‘? After all, she’s no stranger to comebacks. After her surprisingly-but-still-painfully close loss to Jim Gibbons in the 2006 Gubernatorial Election, she was written off for (politically) “dead”. But when Democrats wanted to contest NV-03 in 2008 (and Harry Reid’s political team wanted to do away with Jon Porter as a possible 2010 candidate against him) and their originally preferred candidate turned out to be a dud, they had nowhere else to go. Dina obliged, and she then found her redemption… Only to lose it again last year, and by less than 2,000 votes! But is Dina’s story really over?

Or can Rory Reid‘s find a new beginning? He was heralded for ending a painful period of local political corruption culminating in the saucy, racy “G Sting” FBI probe that took down a voting majority of Clark County Commissioners for taking bribes from stripper clubs out to put rival clubs out of business. He was commended for thinking ahead and pushing Clark County to take seriously matters of sustainable growth. He was seen as a real contender, then the 2010 Gubernatorial race happened and he was lost in translation as the Reno powers that be championed Brian Sandoval as their “anointed one”. It was so strange to see Rory’s political career cut short so abruptly last year, but can it be regrown?

UPDATE: Apparently the answer to my earlier question is a resounding Hell to the No! Sorry, but Rory did this to himself… Even if he broke no laws. Score one for Teams Titus and Buckley in Round 1.

Or can Barbara Buckley‘s be reborn? After all, she was seen as the most powerful Assembly Speaker seen in ages. She was the once dismissed “bleeding heart liberal” who then rocked the political establishment with legislative accomplishments on everything from patients’ rights to child welfare to home foreclosure mediation and prevention. And at one point, she looked to be quite the formidable candidate for Governor… Until she stepped aside for Rory Reid… But will she be so willing to step aside again?

Funny enough, all three of these big name Clark Democrats live in this newly created Congressional District. It starts in the more Democratic friendly Summerlin area neighborhoods, then leaps down to Buckley’s home base of Spring Valley, then crosses The 15 and Las Vegas Boulevard to jump into Dina’s East Side turf, then turns south to take in Rory’s ‘hood in the Green Valley part of Henderson. Either there will be some heated back room negotiations among party leaders on who gets this seat, or there will be a primary so exciting it may even eclipse the drama of the 2006 Democratic Gubernatorial Primary that Dina wasn’t “supposed to win”.

The Wild Cards

But wait, the list of candidates isn’t even over yet! There’s another potential suitor possibly waiting in the wings. After Barbara Buckley was termed out of The Assembly last year, John Oceguera became the new Speaker. However, this gig won’t last long. He will be termed out himself next year. And even though he himself hasn’t suggested it, his name has also been rumored for a run here. If he wins, he will be Nevada’s first Native American member of Congress. His challenge will probably be succeeding in this legislative session (a shared goal with Horsford) and not letting the recent drama over Las Vegas/Clark County firefighter pay take him down (even though he’s actually a North Las Vegas firefighter, and they’ve had no labor trouble there).

On the Republican side, however, it’s slim pickings. Perhaps Assembly Member Mark Sherwood (R-Henderson) or State Senator Michael Roberson (R-Henderson) can try, but both are far too conservative to even get close. After all, both only barely defeated their Democratic opponents last year.

2010 US Senate Results

55.9% Reid (D)

39.3% Angle (R)

Estimated 2008 Presidential Results

60% Obama (D)

37% McCain (R)

Estimated Cook PVI: D+7

Early Race Rating: Likely Democratic for now… And probably eventually becoming Safe Democratic barring any major scandal or unusually strong GOP candidate.

So this is my first Nevada map, a map I had with state legislators and certain big name pols in mind. In the future, I may draw more maps under different scenarios, such as Dean Heller and Shelley Berkley staying put in The House, or what might happen should The Legislature come crashing down over the state budget, forcing the courts to draw the final lines.

Let me know what you think and/or if you have your own maps to share. 🙂

Census 2010 Quick Cuts: A 5-5-1 Virginia

As David posted earlier, Census data for the first four states has been released.

Democrats don’t control redistricting in Virginia…but that doesn’t mean it wouldn’t be interesting to see what could happen.

Here’s one proposal, a 5-5-1 map, with the swing district being perfect for a Tom Perriello comeback.

Greetings, loved ones.  Let’s take a journey…

We’ll start out in Hampton Roads:


County Pop Black% Hisp% Asian% Obama% McCain% Deeds% McD%
1 727,092 14.63% 4.50% 3.69% 40.87% 58.15% 30.98% 68.93%
Accomack 33,164 28.05% 8.59% 0.55% 48.69% 50.14% 37.56% 62.42%
Chesapeake City 142,972 19.74% 3.66% 3.08% 40.39% 58.73% 31.76% 68.16%
Gloucester 36,858 8.67% 2.54% 0.78% 35.98% 62.89% 27.77% 72.09%
Hanover 61,394 7.67% 2.06% 1.54% 29.98% 69.24% 20.95% 78.94%
James City 56,095 11.96% 4.01% 2.26% 44.34% 54.78% 33.85% 66.03%
Mathews 8,978 9.17% 1.16% 0.35% 35.55% 63.53% 29.96% 69.92%
Middlesex 10,959 18.05% 1.51% 0.34% 39.81% 59.02% 30.43% 69.52%
New Kent 18,429 13.48% 2.12% 0.88% 34.96% 63.91% 25.47% 74.43%
Northampton 12,389 36.55% 7.05% 0.67% 57.70% 41.19% 48.86% 51.03%
Poquoson City 12,150 0.64% 1.82% 2.14% 24.74% 74.01% 19.78% 80.16%
Virginia Beach City 301,190 14.05% 5.77% 5.97% 44.17% 54.80% 33.24% 66.67%
York 32,514 6.34% 3.29% 3.56% 35.23% 63.69% 27.26% 72.65%

Rob Wittman’s 1st district shifts eastward, now taking in part of the Northern Neck, the Virginia section of the Delmarva, and parts of Virginia Beach and Chesapeake City. A side consequence of this would be the turf war between Wittman and Scott Rigell, as this district is 22% from the old 1st and 48% from the old 2nd. Nothing much else to see here, Obama lost by 17, Deeds by 38, Steve Shannon (2009 Dem AG nominee) by 35, and Jody Wagner (2009 Dem LG nominee) by 29.


County Pop Black% Hisp% Asian% Obama% McCain% Deeds% McD%
2 727,700 38.14% 7.08% 3.93% 64.62% 34.46% 51.85% 48.03%
Chesapeake City 79,237 47.98% 5.64% 2.50% 69.76% 29.49% 59.19% 40.73%
Hampton City 96,757 42.01% 4.83% 2.51% 63.23% 35.91% 50.30% 49.57%
James City 10,914 19.20% 7.07% 2.19% 48.64% 50.46% 36.88% 63.09%
Newport News City 114,167 34.85% 9.71% 3.75% 60.62% 38.53% 46.36% 53.53%
Norfolk City 242,803 43.11% 6.65% 3.29% 71.03% 28.06% 60.08% 39.79%
Virginia Beach City 136,804 31.89% 8.49% 6.42% 62.03% 37.00% 46.33% 53.57%
Williamsburg City 14,068 13.99% 6.69% 5.74% 63.77% 34.67% 54.60% 45.26%
York 32,950 20.30% 5.53% 6.21% 47.38% 51.55% 35.25% 64.58%

Bobby Scott’s current 3rd is clearly overpacked, with the choicest parts of Hampton, Norfolk, Newport News, and Portsmouth dumped into his district. We unpack the 3rd a bit, lending some of its Democratic strength here.  This new district contains the entirety of Norfolk, parts of Newport News, Chesapeake, and VA Beach.  There’s also an arm to grab Williamsburg,  one of the few instances in this area of relatively white precincts voting Dem.  19% old 1st, 37% old 2nd, and 33% old 3rd, we get a district that Obama won by 30% (!!), and was even carried by all three Dems in 2009.


County Pop Black% Hisp% Asian% Obama% McCain% Deeds% McD%
3 727,246 50.91% 5.89% 1.84% 71.40% 27.79% 60.71% 39.13%
Charles City 7,256 48.42% 1.21% 0.34% 68.34% 31.01% 58.53% 41.38%
Chesterfield 56,895 42.34% 17.85% 2.96% 66.34% 32.93% 54.21% 45.58%
Hampton City 40,679 67.49% 3.84% 1.38% 82.45% 16.87% 74.80% 25.03%
Henrico 145,098 51.47% 5.37% 2.45% 70.10% 29.14% 60.91% 38.95%
Hopewell City 22,591 37.04% 6.55% 0.80% 55.49% 43.56% 37.38% 62.39%
Isle Of Wight 22,515 26.29% 1.91% 0.95% 44.01% 55.21% 34.97% 64.94%
Newport News City 66,552 50.67% 3.76% 1.01% 68.96% 30.31% 55.37% 44.52%
Petersburg City 32,420 79.11% 3.75% 0.82% 88.64% 10.19% 80.99% 18.97%
Portsmouth City 95,535 53.26% 3.06% 1.07% 69.27% 29.97% 59.76% 40.18%
Prince George 26,433 35.43% 6.87% 1.67% 47.60% 51.60% 31.72% 68.17%
Richmond City 204,214 50.60% 6.27% 2.33% 79.09% 20.03% 69.23% 30.55%
Surry 7,058 46.10% 1.22% 0.34% 60.72% 38.45% 53.61% 46.18%

The 3rd, having been unpacked, sees its black percentage drop from 56% to 51%. However, the VAP also remains over 50% African-American. In what would be a relief to Randy Forbes, Petersburg is removed from this district, which becomes more Richmond-centric. 59% old 3rd, 20% old 7th, and 15% old 4th. Obama dominated here (no surprise), and all three Dems in 09 scored 20%+ wins.


County Pop Black% Hisp% Asian% Obama% McCain% Deeds% McD%
4 727,955 17.68% 3.79% 3.88% 42.13% 56.97% 30.93% 68.95%
Amelia 12,690 23.10% 2.29% 0.21% 38.11% 60.81% 28.85% 71.10%
Chesterfield 259,341 17.48% 4.90% 3.32% 42.25% 56.88% 30.45% 69.38%
Colonial Heights City 17,411 10.24% 3.87% 3.32% 28.95% 69.63% 16.83% 83.14%
Dinwiddie 28,001 32.87% 2.41% 0.44% 48.45% 50.62% 37.34% 62.60%
Fluvanna 25,691 15.33% 2.96% 0.57% 48.57% 50.41% 36.48% 63.39%
Franklin City 4,422 25.28% 2.53% 1.40% 38.99% 60.08% 32.73% 67.27%
Goochland 21,717 19.25% 2.10% 1.04% 38.31% 60.84% 29.11% 70.77%
Hanover 38,469 11.95% 2.21% 1.05% 37.48% 61.65% 28.09% 71.75%
Henrico 161,837 9.88% 4.46% 10.20% 43.75% 55.40% 31.29% 68.58%
Isle Of Wight 12,755 21.90% 1.79% 0.53% 40.77% 58.29% 32.36% 67.61%
Louisa 33,153 17.71% 2.30% 0.48% 45.45% 53.29% 34.58% 65.34%
Nottoway 15,853 39.28% 3.84% 0.32% 48.84% 50.07% 41.58% 58.28%
Powhatan 28,046 13.63% 1.79% 0.47% 29.31% 69.78% 20.03% 79.85%
Prince George 9,292 22.22% 2.60% 1.10% 38.52% 60.75% 29.86% 70.09%
Southampton 8,698 24.88% 0.86% 0.39% 39.95% 59.19% 33.08% 66.89%
Suffolk City 41,589 27.77% 2.93% 2.29% 44.48% 54.73% 35.79% 64.17%
Sussex 8,990 57.33% 2.49% 0.46% 57.72% 41.49% 42.28% 57.72%

With the eastward shift of the 1st, the 4th and 7th also rotate accordingly along the Richmond-Norfolk axis created by the 2nd and 3rd. Nothing to see here, other than we’ve cut out part of Forbes base and drew in much of the old 7th (53% is from the old 7th, compared to 43% old 4th). But Cantor could clearly run in the new 7th and Forbes in the new 4th.  Dems in 09 lost by 30%+.


County Pop Black% Hisp% Asian% Obama% McCain% Deeds% McD%
5 727,351 29.89% 3.43% 2.03% 57.47% 41.45% 47.35% 52.54%
Albemarle 98,970 9.70% 5.47% 4.67% 58.43% 40.36% 49.41% 50.48%
Amherst 12,637 22.50% 1.75% 0.51% 47.46% 51.77% 38.61% 61.39%
Brunswick 17,434 57.31% 1.71% 0.28% 62.84% 36.35% 49.41% 50.49%
Buckingham 17,146 35.08% 1.68% 0.37% 49.89% 49.01% 36.60% 63.40%
Charlotte 12,586 29.80% 1.91% 0.21% 43.93% 54.77% 33.24% 66.62%
Charlottesville City 43,475 19.41% 5.11% 6.37% 78.35% 20.35% 73.65% 26.21%
Cumberland 10,052 32.61% 1.80% 0.35% 47.73% 51.19% 35.87% 64.09%
Danville City 43,055 48.30% 2.89% 0.94% 59.13% 40.02% 44.93% 54.96%
Emporia City 5,927 62.53% 4.42% 0.73% 65.04% 34.28% 47.57% 52.35%
Franklin 38,514 8.83% 2.68% 0.49% 39.06% 59.55% 31.66% 68.25%
Franklin City 4,160 90.53% 0.70% 0.05% 94.65% 4.88% 91.81% 8.06%
Greensville 12,243 59.80% 1.41% 0.29% 63.88% 35.38% 52.64% 47.36%
Halifax 36,241 36.68% 1.62% 0.37% 48.23% 51.04% 38.25% 61.53%
Henry 11,930 39.81% 5.58% 0.45% 57.61% 41.49% 51.27% 48.73%
Lunenburg 12,914 34.75% 3.64% 0.19% 47.84% 51.33% 37.45% 62.52%
Lynchburg City 25,110 53.21% 2.53% 0.67% 71.04% 27.58% 61.07% 38.72%
Martinsville City 13,821 44.95% 3.99% 0.93% 63.48% 35.44% 51.66% 48.18%
Mecklenburg 32,727 36.82% 2.46% 0.67% 47.26% 51.83% 32.32% 67.67%
Montgomery 46,128 3.37% 2.88% 7.02% 58.99% 39.52% 53.93% 45.87%
Nelson 15,020 13.10% 3.06% 0.45% 53.99% 44.84% 46.23% 53.67%
Pittsylvania 37,893 26.92% 1.56% 0.19% 42.81% 56.26% 32.76% 67.24%
Prince Edward 23,368 33.19% 2.25% 0.88% 54.34% 44.46% 44.95% 54.97%
Roanoke 3,003 3.13% 0.93% 0.27% 40.93% 57.70% 31.39% 68.51%
Roanoke City 97,032 28.46% 5.51% 1.76% 61.15% 37.76% 51.89% 48.01%
Southampton 9,872 48.14% 1.30% 0.12% 57.84% 41.21% 48.82% 51.13%
Suffolk City 42,996 57.15% 2.78% 0.92% 69.00% 30.31% 55.41% 44.47%
Sussex 3,097 60.35% 1.42% 0.23% 69.11% 30.45% 57.34% 42.66%

A leaner, meaner 5th for Tom Perriello.  We could have also tried to bring back Rick Boucher, but when you’re forced to decide between a young up-and-coming progressive vs. a career Blue Dog in a more hostile district, the choice is obvious. This is a pretty blatant gerrymander, meant to string together all the Dems in Southside and to connect them to Dems in Charlottesville, Roanoke, … and even Blacksburg. The result is a district Obama won by 16%, a massive improvement from the 3% loss he earned in the old 5th.  63% of the population is retained, along with 19% of the old 6th. Deeds kept it respectable, losing by 5; Shannon lost by 6 and Wagner by 3.


County Pop Black% Hisp% Asian% Obama% McCain% Deeds% McD%
9 727,482 4.65% 1.92% 0.90% 37.28% 61.12% 30.64% 69.28%
Bland 6,824 3.34% 0.57% 0.26% 29.20% 68.64% 24.06% 75.88%
Bristol City 17,835 5.66% 1.24% 0.68% 36.21% 62.22% 27.48% 72.44%
Buchanan 24,098 2.56% 0.39% 0.22% 46.52% 51.99% 36.74% 63.22%
Carroll 30,042 0.59% 2.58% 0.18% 32.67% 65.08% 26.96% 72.97%
Craig 5,190 0.10% 0.69% 0.15% 33.46% 64.67% 32.17% 67.76%
Dickenson 15,903 0.32% 0.54% 0.11% 48.54% 49.22% 39.46% 60.46%
Floyd 15,279 1.83% 2.70% 0.23% 39.08% 59.09% 34.08% 65.77%
Franklin 17,645 6.66% 2.23% 0.35% 34.81% 63.58% 29.69% 70.26%
Galax City 7,042 6.23% 14.04% 0.53% 43.80% 54.83% 37.38% 62.40%
Giles 17,286 1.51% 1.21% 0.32% 40.95% 57.24% 36.56% 63.35%
Grayson 15,533 2.06% 2.68% 0.10% 34.35% 62.88% 29.71% 70.29%
Henry 42,221 16.80% 4.45% 0.43% 39.85% 58.67% 32.38% 67.61%
Lee 25,587 3.70% 1.59% 0.22% 34.89% 63.13% 25.71% 74.27%
Montgomery 48,264 4.48% 2.50% 3.89% 41.25% 57.32% 35.04% 64.83%
Norton City 3,958 6.32% 1.72% 1.41% 49.14% 49.21% 39.34% 60.55%
Patrick 18,490 5.87% 2.40% 0.23% 33.75% 64.37% 29.86% 70.04%
Pittsylvania 25,613 14.91% 2.89% 0.42% 30.51% 68.54% 23.11% 76.89%
Pulaski 34,872 5.04% 1.24% 0.51% 39.32% 58.85% 34.84% 65.12%
Radford City 16,408 7.79% 2.35% 1.56% 53.97% 44.54% 45.33% 54.56%
Roanoke 59,667 5.22% 2.27% 3.29% 39.92% 58.89% 32.83% 67.01%
Russell 28,897 0.81% 0.95% 0.18% 42.91% 55.59% 37.55% 62.42%
Salem City 24,802 7.11% 2.42% 1.62% 41.63% 57.13% 33.39% 66.45%
Scott 23,177 0.58% 1.01% 0.16% 27.59% 70.68% 21.14% 78.81%
Smyth 32,208 1.99% 1.64% 0.25% 34.46% 63.54% 26.38% 73.53%
Tazewell 45,078 2.96% 0.66% 0.64% 32.80% 65.65% 26.58% 73.36%
Washington 54,876 1.26% 1.32% 0.37% 32.91% 65.62% 25.10% 74.87%
Wise 41,452 5.16% 1.14% 0.34% 35.33% 63.05% 29.55% 70.33%
Wythe 29,235 2.80% 0.96% 0.44% 32.88% 65.70% 27.24% 72.63%

There simply isn’t enough Democratic strength down here to support both Perriello and Boucher, and protecting Boucher would likely be a poor investment given the political trends.  We cede this district to Morgan Griffith, who retains 81% of his current territory.  With the adjustments to help Perriello, we see a bit of a shift rightward, with Obama losing by 24. Again, all the 09 Dems lost by 35%+.


County Pop Black% Hisp% Asian% Obama% McCain% Deeds% McD%
6 726,966 7.04% 3.79% 1.10% 36.94% 61.83% 29.18% 70.72%
Alleghany 16,250 4.68% 1.08% 0.23% 48.22% 50.41% 61.23% 38.71%
Amherst 19,716 16.76% 2.05% 0.46% 38.06% 60.93% 28.68% 71.25%
Appomattox 14,973 20.08% 1.12% 0.23% 34.61% 64.26% 25.65% 74.33%
Augusta 73,750 3.97% 2.07% 0.50% 29.47% 69.35% 22.53% 77.40%
Bath 4,731 4.69% 2.13% 0.15% 42.89% 55.47% 63.47% 36.47%
Bedford 68,676 5.74% 1.59% 1.03% 30.75% 68.16% 22.87% 77.07%
Bedford City 6,222 20.19% 2.15% 0.66% 44.18% 54.75% 35.25% 64.75%
Botetourt 33,148 3.03% 1.07% 0.53% 32.71% 65.90% 28.56% 71.26%
Buena Vista City 6,650 5.22% 1.55% 0.44% 45.73% 52.91% 39.05% 60.95%
Campbell 54,842 14.16% 1.67% 1.00% 31.34% 67.58% 22.90% 76.92%
Covington City 5,961 12.51% 1.54% 0.57% 55.40% 43.33% 65.79% 34.07%
Frederick 42,487 2.93% 4.92% 0.80% 36.23% 62.27% 23.78% 76.07%
Greene 18,403 6.34% 4.24% 1.40% 38.43% 60.29% 27.37% 72.53%
Harrisonburg City 48,914 6.36% 15.67% 3.51% 57.54% 41.21% 42.16% 57.67%
Highland 2,321 0.26% 0.78% 0.17% 37.97% 59.85% 44.93% 55.07%
Lexington City 7,042 9.66% 3.85% 2.20% 62.24% 36.87% 60.53% 39.34%
Lynchburg City 50,458 17.40% 3.30% 3.37% 37.43% 61.36% 30.31% 69.59%
Madison 13,308 9.78% 1.77% 0.56% 42.72% 56.10% 30.46% 69.47%
Page 24,042 1.94% 1.55% 0.30% 40.76% 58.16% 29.73% 70.15%
Roanoke 29,706 4.84% 1.92% 1.67% 36.46% 62.48% 29.68% 70.19%
Rockbridge 22,307 2.66% 1.33% 0.47% 42.64% 56.22% 41.88% 58.07%
Rockingham 76,314 1.67% 5.34% 0.60% 31.36% 67.40% 21.75% 78.14%
Shenandoah 41,993 1.75% 6.14% 0.52% 35.96% 62.45% 25.00% 74.85%
Staunton City 23,746 12.15% 2.16% 0.78% 50.56% 48.39% 41.40% 58.54%
Waynesboro City 21,006 10.61% 6.36% 0.73% 44.09% 54.35% 30.97% 68.91%

Again, nothing to see here. Goodlatte retains 68% of his old territory, a strip along the Blue Ridge. The 2009 Dems lost by 40%+; Warner only won by 10 here in 2008.


County Pop Black% Hisp% Asian% Obama% McCain% Deeds% McD%
7 727,428 15.09% 7.03% 1.94% 46.08% 52.82% 33.13% 66.74%
Caroline 28,545 29.34% 3.36% 0.62% 55.45% 43.48% 43.47% 56.47%
Clarke 14,034 5.32% 3.49% 0.90% 46.52% 51.68% 36.59% 63.31%
Culpeper 46,689 15.78% 8.90% 1.30% 44.59% 54.26% 29.61% 70.25%
Essex 11,151 38.09% 3.13% 0.77% 54.70% 44.35% 39.19% 60.81%
Fauquier 65,203 8.16% 6.41% 1.28% 42.71% 56.19% 31.10% 68.77%
Frederick 35,818 5.39% 8.59% 1.76% 41.35% 57.16% 26.68% 73.19%
Fredericksburg City 24,286 22.64% 10.73% 2.84% 63.60% 35.27% 50.84% 48.94%
King & Queen 6,945 28.44% 2.65% 0.24% 51.77% 47.58% 41.03% 58.87%
King George 23,584 17.87% 3.35% 1.16% 42.71% 56.22% 29.69% 70.18%
King William 15,935 17.69% 2.03% 0.74% 39.87% 59.20% 28.40% 71.54%
Lancaster 11,391 27.95% 1.04% 0.57% 46.63% 52.57% 35.16% 64.59%
Northumberland 12,330 25.33% 3.10% 0.30% 44.72% 54.56% 34.39% 65.41%
Orange 33,481 12.71% 3.40% 0.73% 44.98% 53.83% 32.66% 67.28%
Prince William 48,819 7.26% 8.41% 5.35% 40.63% 58.36% 29.10% 70.79%
Rappahannock 7,373 4.35% 3.09% 0.53% 47.79% 50.56% 42.20% 57.70%
Richmond 9,254 30.30% 5.51% 0.43% 43.20% 55.86% 31.69% 68.26%
Spotsylvania 122,397 15.25% 7.58% 2.31% 46.05% 52.91% 31.51% 68.35%
Stafford 128,961 16.97% 9.21% 2.81% 46.37% 52.69% 32.44% 67.39%
Warren 37,575 4.62% 3.51% 0.96% 43.39% 55.06% 31.32% 68.58%
Westmoreland 17,454 28.02% 5.74% 0.57% 54.64% 44.40% 41.38% 58.57%
Winchester City 26,203 10.93% 15.42% 2.33% 52.02% 46.66% 39.18% 60.67%

We could try to screw Eric Cantor out of a district, but again, that wouldn’t necessarily be successful. Democratic voters(which would have likely had to come from NoVA) are better kept in the three decently solidly Dem NoVA districts. Without touching the Dems in NoVA though, we still try to draw as Democratic a district as possible, taking in various parts of the Northern Neck and the DC exurbs.  Hopefully, those areas – Fauquier, Culpeper, Winchester, etc. – will keep drifing left as DC’s influence grows. While Obama lost by 7 here, there are still miles to go, with the 09 Dems having lost by 30% or more.  56% of this district is from the old 1st, 17% from the old 7th, and 21% from the old 10th (showing some of the growth it’s experienced).


County Pop Black% Hisp% Asian% Obama% McCain% Deeds% McD%
8 727,839 9.84% 13.29% 11.17% 63.39% 35.60% 53.71% 46.10%
Alexandria City 139,966 21.78% 16.09% 6.02% 71.73% 27.26% 62.76% 37.04%
Arlington 207,627 8.49% 15.11% 9.60% 71.71% 27.12% 65.49% 34.26%
Fairfax 82,317 2.50% 6.38% 16.70% 56.50% 42.63% 48.79% 51.06%
Falls Church City 12,332 4.31% 8.99% 9.42% 69.56% 29.19% 64.92% 34.94%
Loudoun 285,597 7.31% 12.76% 13.32% 53.59% 45.48% 38.92% 60.94%

Again, a shameless gerrymander.  But, we did manage to keep Alexandria and Arlington intact. Jim Moran probably needs a little more support than most Dems, which also factored into this decision. He keeps 52% of his old territory, with the balance coming from the 10th. Obama romped with a 28% victory, and Deeds even scored an 8% win here.


County Pop Black% Hisp% Asian% Obama% McCain% Deeds% McD%
10 726,728 6.69% 14.60% 20.33% 59.46% 39.56% 48.16% 51.68%
Fairfax 677,449 6.75% 14.82% 20.12% 59.69% 39.33% 48.49% 51.34%
Fairfax City 22,565 4.75% 15.76% 15.21% 57.69% 41.16% 46.91% 52.98%
Loudoun 26,714 6.85% 7.98% 29.86% 54.50% 44.69% 37.43% 62.46%

The 10th has grown massively, and accordingly, needed to contract. This iteration of the 10th becomes an almost all-Fairfax affair, with a slight section of Loudoun added. This would have swingy-ish characteristics in bad years, but Obama won by 20 and Deeds only lost by 3.5; both Shannon and Wagner won here as well.  Only 30%, though, is from the old 10th (30%), with more being from the old 11th (54%); this district is probably a bit more inner suburban than outer (think Annandale v. Sterling).


County Pop Black% Hisp% Asian% Obama% McCain% Deeds% McD%
11 727,237 18.72% 21.55% 9.69% 61.05% 38.08% 46.98% 52.89%
Fairfax 321,960 15.98% 19.52% 12.30% 62.16% 36.93% 50.62% 49.23%
Manassas City 37,821 13.72% 31.40% 4.98% 55.17% 43.85% 38.00% 61.92%
Manassas Park City 14,273 12.98% 32.54% 8.97% 59.49% 39.47% 39.83% 60.17%
Prince William 353,183 21.99% 21.90% 7.84% 60.51% 38.66% 43.76% 56.10%

Gerry Connolly’s district shifts southward a bit, taking in more of Prince William County.  But unlike before, this district takes in the southern (and Democratic) part of PW.  Connolly retains 47% of his old territory, but the parts he sheds he won’t necessarily miss.  Interestingly, Obama did better here than in the new 10th (23 point win), but this area swung harder against the Dems in 09, with Shannon and Wagner losing by 1 and Deeds by 6. This, of course, is still an improvement over the 10-point loss Deeds suffered in the current 11th.

Redistricting Michigan: What can the GOP do? (Part 1)

As we all know, the GOP did very well in a lot of state-level races around the country, in addition to their big gains in the House.  This was especially true in Michigan, where the Michigan House of Representatives flipped from D to R after a 20 seat Democratic loss, and the Republicans gained seats in the Michigan Senate, going from a 22-16 majority to a 26-12 supermajority.  Republican gubernatorial candidate Rick Snyder won convincingly.  And over on the Michigan Supreme Court, two GOP-backed candidates (one incumbent justice, one challenger to an incumbent recently appointed by outgoing Gov. Jennifer Granholm) won their races as well, turning a narrow 4-3 “Democratic” majority into a 4-3 “Republican” majority.  (The races and the court are nominally non-partisan…but everyone knows.)

There has been much buzz about exactly what this complete GOP control of the redistricting process means for the reapportionment process.  Given the fact that Michigan is home, I’ve been among those wondering just that.  This is my attempt at a prediction (or two).  As an added bonus, it is my first diary ever here at SSP!

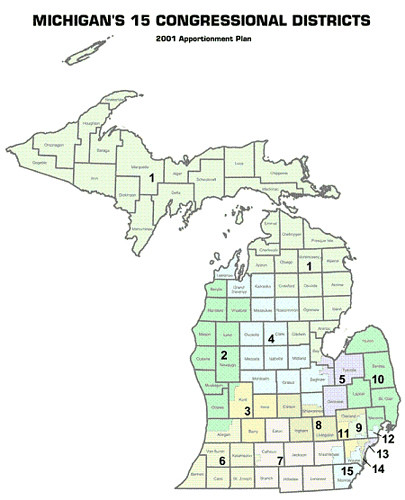
First, there’s the current map:

2001 Apportionment

This is the 2001 apportionment plan based on the 2000 census.  Like the forthcoming map, it was drawn when the state government was largely under Republican control (Legislature and Governor certainly were…I’m not sure about the MI Supreme Court at the time).  As such, the map as it stands is already a GOP gerrymander, though it doesn’t look as obvious as, say, some of the districts in Pennsylvania ::cough::PA-12::cough::.  This map flipped a 9-7 D-R delegation to 9-6 R-D.  As with the 2000 census, Michigan loses one seat in 2010, down to 14 overall.

After the 2010 elections, we’re back from an 8-7 D-R map (Democrats flipped two districts in 2008) to a 9-6 R-D map.  Districts 1, 2, 3, 4, 6, 7, 8, 10, and 11 will be represented by Republicans in the coming Congress; Districts 5, 9, 12, 13, 14, and 15 will be represented by Democrats.  The only real change from 2000 is that District 1 is now in Republican hands and District 9 is in Democratic hands.  As many of you know, the 9th (my district!) was drawn as a Republican district, but has trended away from the GOP and is now held by Democrat Gary Peters.  District 1 was Bart Stupak’s district, which fell in the wave this year after he retired.

Obviously, if the Republicans want to try to protect all their incumbents, new and old, they will have to put two Democrats together to account for the loss of one seat.  Much of the discussion I’ve seen has revolved around the idea that the Republicans are likely to match Gary Peters in the 9th and Sandy Levin in the 12th and either let them fight it out or encourage/force Levin into retirement.

I decided to explore the idea of such a match up to see exactly how it would impact redistricting throughout the rest of the state.  Based on copious hours of work on the maps you’ll see below, a Peters-Levin match-up is eminently doable, but it will likely wreak havoc throughout the rest of the state for Republican incumbents.  Although this seemed the most likely match-up to me, I’m starting to think that the GOP may instead try to pair John Dingell (MI-15) and John Conyers (MI-14), leaving Levin and Peters alone.  I plan to explore that match-up another time.

Before we get to the maps, here are the principles I used in drawing them:

1.  Wherever possible try to keep districts as compact as possible and without breaking county or municipal/township lines.  This was not as high a priority as it otherwise might have been, as the Supreme Court is, IMO, likely to be a bit flexible with these requirements which are embodied in state law.

2.  Keep each Republican incumbent in a single district, without matching them up with another Republican or forcing them to move.  (While they obviously don’t have to live in the district, it always helps from a PR standpoint…)

3.  Try to shore up shakier Republican districts.

4.  Maintain two minority-majority districts based in Detroit (currently the 13th and 14th).

I used Dave’s App without using the “estimate new population” check box, as it had projected the state’s population to increase, rather than go down as it did.  So, the current population figure on the app is actually closer to what it will be than the estimate.  Obviously the population will change within the voting blocks, so take these maps with a grain of salt.

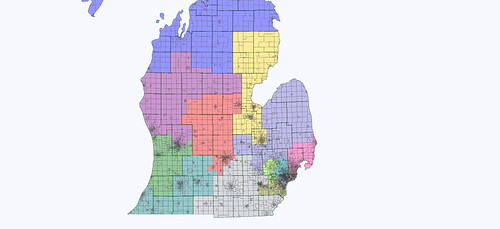
My first attempt at a Peters-Levin mash looked overall as follows:

Peters Levin Mash 1 Overview

Without the partisan numbers, I had to kind of eyeball the districts based on county-level returns and my own knowledge of the state.  I figured the 2008 Obama numbers were the high mark in most counties since McCain basically gave up the state a month before the election.

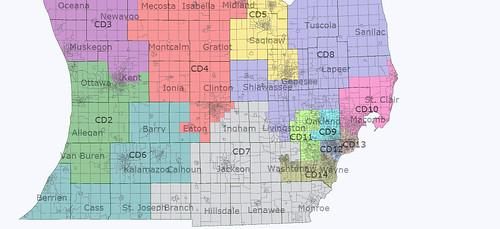
Here is the Lower Peninsula, and then a close up of the southern Lower Peninsula:

Peters Levin Mash 1 LP

Peters Levin Mash 1 Southern Lower

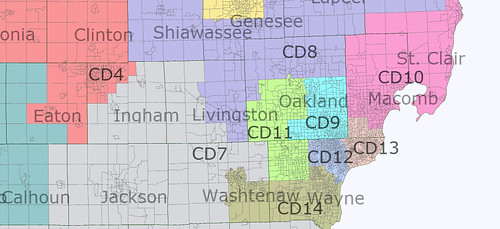
The first mash-up district I built more closely resembles Peters’ current 9th, but swoops south to take in Ferndale and Royal Oak (Levin’s home) in the southeast corner of Oakland County.  The district surrenders its northern reaches (making Mike Rogers my Congressman…again) and West Bloomfield, becoming more compact, but probably more Democratic than it is currently.  The district remains entirely within Oakland County.

Peters Levin Mash 1 SE Mich

As the maps show, though, this configuration likely causes chaos elsewhere.  What was much of Sandy Levin’s 12th in southern Macomb (Democratic) has to go somewhere, and Candice Miller is unlikely to want all of it.  So, the 13th, which will be held by incoming freshman Hansen Clarke, shifts a bit north from Wayne County.  The district stays majority African American, but just barely.  This pulls Candice Miller’s 10th south a bit, which costs her much of the thumb area.  John Conyers’ district then shifts east a bit, but remains firmly African American majority.  John Dingell’s district (now the 15th, here renumbered the 14th) is then pulled north out of swingy Monroe County and into friendlier territory in Wayne and Washtenaw Counties.  Finally, Thad McCotter (MI-11) suffers as he picks up more Dem-friendly West Bloomfield in a mild attempt to keep his district compact.

Outside SE Michigan, things get even more interesting.  I’ve pretty much concluded that Crazy Tim…I mean, Tim Walberg (MI-07) is stuck with a swing district unless the GOP folks in Lansing throw Mike Rogers (MI-08) under the bus and give Walberg all of heavily Republican Livingston County…which is where Rogers is from.  So not happening.  In this map, Walberg’s district shifts east, giving up more Dem-friendly Calhoun County (Battle Creek) and swingy Eaton County for swingy Monroe County and a slice of Livingston County.  Calhoun County still has to go somewhere, and the only district really in the area is Fred Upton’s 6th.  I doubt Upton will let this happen, as he already has heavily-Democratic Kalamazoo to contend with.

Likewise, someone needs to pick up Democratic Lansing and Walberg certainly won’t want it.  Rogers seemed a likely contender at first (even though he wouldn’t want it either), but in the end his 8th District ended up (hideously, I must say) going east into the thumb area to pick up Candice Miller’s losses.  (I tried at least 3 configurations to try to stretch Rogers’ district west and Dale Kildee’s 5th or Dave Camp’s 4th east into the thumb…I just couldn’t get anything that looked workable though.)  This seemed like the best I could get, as ugly as it is.  So, in the end the lucky winner of Lansing was Republican Dave Camp (MI-04).  Camp’s district now occupies much of the farm country heartland of the state and includes his home in Midland, in an attempt to counterbalance Lansing.  Dale Kildee’s 5th District takes in the Democratic areas in Flint, Saginaw, and Bay County, then stretches north to take in a few rural areas; I’d guess it stays firmly Democratic, though.

Finally, in the west and north, the 1st District which will be held by Republican Rep.-elect Dan Benishek shifts west and takes in Traverse City, probably shoring up the district for him.  Republican Rep.-elect Justin Amash’s 3rd District gets a bold new look, but probably stays Republican, splitting urban Grand Rapids with the neighboring and still heavily Republican 2nd.  (I realized after I finished everything that Amash may have to pick up and move a few miles after all, as I think I accidentally put him in the new 2nd with fellow Republican freshman Bill Huizenga.  Oops.)  The new 2nd, instead of stretching up the Lake Michigan coast, consolidates ruby red Ottawa County with southern Kent County (Grand Rapids) and areas further south.

Given the chaos that such a map could cause, I knew that it was unlikely that the Republicans in Lansing would try this.  Even if they managed to tweak things (say, finding a way to stretch the 4th or 5th into the thumb instead of the 8th), having a Peters-Levin mash-up with a 9th District as I’ve constructed it here could cause too much of a headache to be worth the trouble.  The real problem seemed to be with the shift in the districts caused by the leftover Democratic-leaning territory in southern Macomb, which is currently in Sandy Levin’s district.

I think the bottom line is that the current map is already close to an effective Republican gerrymander as you can get.  There are islands of Democratic strength, especially in SE Michigan and sprinkled across the rest of the state that make it hard to make the Republican incumbents much stronger without hurting a fellow Republican.  Without threading the needle precisely, the whole house of cards could end up collapsing in a Dem-friendly year, wave or no.

My next set of maps for Part 2 of this diary (to be posted within the next couple days) looks at a Peters-Levin match up in a district that looks more like Levin’s current 12th, rather than like Peters’ current 9th.  The results were a little more encouraging for the GOP, but still caused problems that make me think they won’t go for that either.  I’ll leave you all with that as food for thought until next time.

By what margin will Bob Shamansky win?

View Results

Loading ... Loading ...

Redistricting 2010: Who Controls What

Sourced partially from StateVote from the National Conference of State Legislatures (PDF). Note that “seats” refers to “projected seats after 2010”.

A few notes:

  • Arizona: Uses a bipartisan commission.

  • California: Will be done by commission following passage of Prop 20.

  • Florida: Amendment 6 mandates compactness and community of interest standards.

  • Georgia: Underwent mid-decade redistricting under GOP control.

  • Iowa: Uses a nonpartisan commission, but the legislature has veto power.

  • New Jersey: Uses a bipartisan commission with a 11th wild card member.

  • New York: Control of the State Senate remains uncertain, with three seats still in the balance.

  • North Carolina: Governor Bev Perdue does not have veto power, meaning the GOP controls the entire process.

  • Oregon: Control of the State Senate remains uncertain, with two seats still in the balance.

  • Texas: Underwent mid-decade redistricting under GOP control.

  • Washington: Uses a bipartisan commission. Control of the State Senate remains uncertain, with three seats still in the balance.

Notably, we’re not that screwed. Control of the FLOHPA (+MI) set of swing states remains under the GOP trifecta, just as it was in 2000.

Redistricting MN: An on the ground perspective

Since I live here in Minneapolis, MN and am addicted to Dave’s Redistricting App, I decided to try my hand at redistricting MN two different ways, first, assuming we lose a district and second, assuming we do not lose a district. The 7 district plan is below and should produce a 6-1 DFL map, or at worst a 5-2. The 8 District Map could be 7-1, but will be 6-2 once Peterson retires I think.

I’m very much a compactness kind of guy, but that doesn’t mean you can’t get a good Democratic Gerrymander with a compact map. The Maps and district descriptions are below the fold:

Here’s the seven district map:

District 1: Tim Walz (DFL) Blue

I originally forgot to include Mankato, Walz’s home, in this district and had to do some fancy work with MN-7 to make in in the district, but it worked. This district has three main bases Mankato, Rochester and then the motherload, Dakota County and the suburbs it contains. This should be a significantly more DFL friendly district than the 1st as it exists now.


District 2: John Kline (R)
Green

Kline should be the lone GOP Representative in MN under this map; I seriously packed GOP votes in here, though I almost forgot to include his home in Lakeville. Carver, Scott and Wright Counties house the GOP leaning exurbs that are the backbone of this district. It encompasses about half of the old 2nd and half of the old 6th. I took a couple of the GOP leaning portions of the 7th as well. Obama definitely lost this district, probably by about 10 points.


District 3: OPEN (formerly Erik Paulson (R))
Purple

I took Paulson’s home in Eden Prairie out of this district and gave all the GOP parts of Hennepin over to the 2nd. This district is based in Anoka County and will be a fairly 50-50 district I think, but will lean DFL over the next few years if it does not already lean that way. I considered including Bloomington in it, but it just got too messy.

District 4: Betty McCollum (DFL) vs Michelle Bachmann (R) Red

Placing Bachmann’s residence here was accidental at first, but too amusing not to go ahead with. This will be a walk in the park for McCollum, and Bachmann may move to run in the 2nd, but she might be crazy enough to think she can beat McCollum. This is essentially the old 4th plus a chunk of Washington County

District 5: Keith Ellison (DFL) vs Erik Paulson (R) Yellow

Now, some of you may be scared that Ellison won’t win this district. That’s ridiculous. Ellison did better in the 5th in 2008 than did his predecessor Martin Sabo who help the district for decades. Paulson may move to run in the new 3rd rather than go up against Ellison, but The addition of Eden Prairie and Edina to the true blue 5th helps spread some of the DFL love around.

District 6: Jim Obrestar (DFL) Teal?

The old 8th becomes the 6th and essentially stays the same. I reddened it a litle to help the 7th blue up a bit, but it still leans DFL.


District 7: Collin Peterson (DFL)
Grey

Peterson’s district added a LOT considering its low population growth. It expanded to include much of the old 1st district and I had the 6th take some of the more red parts of the old 7th. It essentially is a R+2-4 district I think, but competative for the right Democrat when Peterson retires. He’ll hold it until he leaves though.

Now for the 8 District Map

District 1: Tim Walz (DFL)

I didn’t strengthen it much, but some of the GOP leaning rural areas went to the 7th. Walz will be fine here and Obama won the district.


District 2: OPEN (formerly John Kline(R) )

Kline might move here, as this is the heavy GOP seat, but then again, Paulson and Bachman may move here too, since I drew all 3 GOP reps out of their districts. Whoever represents the 2nd could be the lone GOP Representative in MN under this map; I seriously packed GOP votes in here. Carver, Scott and Wright Counties house the GOP leaning exurbs that are the backbone of this district, as well as St. Cloud. It encompasses about half of the old 2nd and half of the old 6th. I took a couple of the GOP leaning portions of the 7th as well. Obama definitely lost this district, probably by about 10 points.


District 3: John Kline (R)


Kline lives in this new version of the 3rd which is based around Bloomington, MN and Dakota County. Obama won this district by a few points and its prolly around D+1. Kline may run here or he may move to the 2nd but this is a lean DFL district.

District 4: Betty McCollum (DFL) vs Michelle Bachmann (R)

This will be a walk in the park for McCollum, and Bachmann may move to run in the 2nd or the 6th, but she might be crazy enough to think she can beat McCollum. This is essentially the old 4th plus a chunk of Washington County

District 5: Keith Ellison (DFL) vs Erik Paulson (R)

Now, some of you may be scared that Ellison won’t win this district. That’s ridiculous. Ellison did better in the 5th in 2008 than did his predecessor Martin Sabo who help the district for decades. Paulson may move to run in the new 2nd rather than go up against Ellison, but The addition of Eden Prairie and Edina to the true blue 5th helps spread some of the DFL love around.

District 6: OPEN (formerly Michelle Bachmann (R) )

This is a new incarnation of the 6th, based in Anoka county, but much more suburban than the old 6th. This leans DFL and it would be an easy win for Tinklenberg or another Mainstream DFLer.


District 7: Collin Peterson (DFL)

Peterson’s district added a bit considering its low population growth. It expanded to include some of the old 1st district and I had the 2nd take some of the more red parts of the old 7th. It essentially is a R+4-6 district I think, but could competative for the right Democrat when Peterson retires. He’ll hold it until he leaves though.

District 8: Jim Obrestar (DFL) Purple

The 8th essentially stays the same. I reddened it a little to help the 7th blue up a bit, but it still leans DFL.

Redistricting 2011: Oklahoma & Wisconsin

This is now Episode 12 of my seemingly never-ending redistricting series. (In reality, it has a definite end — after this diary, there are only 9 states I’m planning to address: California, Washington, New Mexico, Maryland, West Virginia, Virginia, North Carolina, Kansas, and Tennessee. The other 15 states are either at-large states, or are unlikely to see substantive boundary changes.)

Today comes Oklahoma and Wisconsin. I struggled with whether to include Oklahoma at all, since my Oklahoma effort is barely different from the current map. But given the fluid partisan dynamics in Sooner State politics, and the potential issue over how to handle the “conservative Democratic” 2nd District, I thought it might be worth a look. On the other hand, I drew two maps for Wisconsin based on the highly changeable atmosphere in that state’s 2010 elections.

Previous efforts:

Diary 1: Massachusetts and Texas

Diary 2: Michigan and Nevada

Diary 3: Iowa and Ohio

Diary 4: Georgia and New Jersey

Diary 5: Florida and Louisiana

Diary 6: Pennsylvania and Utah

Diary 7: Illinois and South Carolina

Diary 8: Indiana, Missouri, and Oregon

Diary 9: Alabama, Arizona, and Kentucky

Diary 10: Colorado and Minnesota

Diary 11: Mississippi and New York

Hark, to the extended text!

Oklahoma

In a few short years, the legislature has gone from an eye-poppingly enduring history of Democratic reign as of 2004 to full GOP takeover by 2008. The governor’s mansion will be open in 2010 as popular Democratic Gov. Brad Henry is term-limited. Fortunately, the Democrats have two strong candidates to retain that office, but Republicans are still even odds at worst for a pickup. So what would GOP control of redistricting mean in 2011? There is only one Democrat in the delegation, the rebellious Dan Boren of the rural (and Native American-heavy) 2nd District. But my gamble is that, even with Republican control, district lines will only be adjusted, and no real effort will be made to dismantle Boren’s territory.

I can’t say my confidence in this prediction is exceedingly high, but look at the signs: even though Tom Coburn won this heavily evangelical, highly socially conservative district for the Republicans as recently as the late 1990s, the GOP has made no effort to target the seat, even when it was open in 2004 (their sacrificial lamb back then lost to Boren 66-34%, and Boren’s two reelections have both topped 70%). Considering Boren racks up urban New England-like Democratic margins in a district that broke 2-to-1 for McCain, and that Oklahoma redistricting has historically revolved around the preservation of culturally cohesive regions, it would seem a dangerous overreach for the GOP to aim its fire at Boren at the risk of softening up less conservative turf around Tulsa and Oklahoma City. Other than completely breaking the traditional boundaries around Eastern Oklahoma, how would they crack his constituency, anyway? And how much worse would it be for Boren to compete for votes in Tulsa than to compete for them in Little Dixie?

So that’s my gamble. And as a result, the differences between this map and the current one are scarcely visible:

Photobucket

There’s not much to even describe here, except that the Oklahoma City-based 5th is contracting in area as the two most rural districts (especially the 3rd) expand.

Wisconsin

As in neighboring Minnesota, circumstances of state politics pushed me to draw two possible maps for America’s Dairyland. The Democrats currently enjoy a redistricting monopoly here, but a tenuous one, with a narrow 52-47 edge in the Assembly, 18-15 in the Senate, and a controversial governor in Jim Doyle. Given the high possibility/probability that any one of these pillars of state power could flip to the Republicans in 2010 (the most likely loss being the governor’s mansion, Doyle’s approval rating hovering in the 30s), it seemed logical to draw a bipartisan compromise map to accompany a hypothetical Democratic gerrymander. Since it would be an incredible feat for the GOP to pick up all three levers in one election cycle, I thought it unnecessary to draw a Republican gerrymander map.

Democratic gerrymander first: this map creates two or three solid Democratic seats, just one solid Republican seat, and as many as five swing seats, all of which would have voted for Obama. Most importantly, it concentrates GOP areas in the 5th and pits two veteran Republican incumbents, Tom Petri of Fond du Lac and Jim Sensenbrenner of Menomonee Falls, against each other. Petri’s 6th is then opened up for Democratic poaching, as is Paul Ryan’s 1st south of Milwaukee. It’s possible Petri could move north and run for the 6th, but when he retired, this iteration would be a prime pickup opportunity. Meanwhile, all five Democratic incumbents are kept about as solid as they were (Kagen gets a very slight boost, though none are pointedly shored up). In toto, a good year under this map might produce a 7-1 Democratic majority; an average year would result in 6-2, and a bad year might retain the standing 5-3 edge, either with the status quo remaining, or with Kagen’s seat traded for Ryan’s.

Photobucket

District 1 – Paul Ryan (R-Janesville) — with all of Kenosha and Racine Counties along with 36% of Milwaukee County, Ryan would face his first truly difficult race in 2012 under these lines (though many think he’ll bail for a gubernatorial try in 2010), and as an open seat this district would be likely to elect a moderate suburban Democrat.

District 2 – Tammy Baldwin (D-Madison) — made only slightly less Democratic to help Dems in the 1st and 3rd.

District 3 – Ron Kind (D-La Crosse) — still somewhat Dem-leaning, as before. The three Dem seats in small town Wisconsin (Kind, Kagen, and Obey) are all only modest Obama districts, but seem to be a bit stronger for their incumbents.

District 4 – Gwen Moore (D-Milwaukee) — the other 64% of Milwaukee, plus 24% of GOP-friendly Waukesha County; a strong urban Rust Belt Democratic seat.

District 5 – Jim Sensenbrenner (R-Menomonee Falls) vs. Tom Petri (R-Fond du Lac) — geography would seem to favor former Judiciary Chairman Sensenbrenner, and Petri might choose to move north in this scenario, but muddying the waters was clearly my goal. This packs Republican votes as well as can be expected anywhere in Wisconsin.

District 6 (open) — without Petri, this would be a fairly good shot to elect a Democrat, with Obama having performed somewhere in the neighborhood of 51-53%. But much like the current 6th, if Petri ran, it would be on loan to the GOP until his retirement.

District 7 – Dave Obey (D-Wausau) — as chairman of the Appropriations Committee, Obey obviously has nothing to worry about, though Democrats have long noted the fairly marginal nature of the 7th. When he does retire, this will still probably be a somewhat Dem-leaning/Obama-friendly rural seat, but a slam dunk? No.

District 8 – Steve Kagen (D-Appleton) — I only had minimal room to strengthen his district, since most rural Wisconsin counties are competitively balanced, but made the necessary trades to up his chances a bit.

Now the bipartisan compromise map: this adhered to clean, simple, aesthetic district lines and made superficial efforts to help incumbents without going out of its way to do so. The reason I didn’t make an aggressive “incumbent protection” map is that the current lines are fairly incumbent-friendly, especially as Democratic strength has increased in the once-Republican 8th. So my primary goal for this scenario was pretty boundaries, with a dash of Petri, Ryan, and Kagen protection thrown in (for Petri, I had no concerns about his ability to be reelected, but rather about the GOP’s chances of holding the open seat). Needless to say, I’d rather see the Democrats retain control, but at least this map appeases my “good government” instincts.

Photobucket

Redistricting North Carolina

(From the diaries – promoted by DavidNYC)

So you all know the drill by now – take some VTDs, consolidate them to reflect updated population stats, then piece them together. I couldn’t think of a witty title today either. Oh well.

My goals for North Carolina were to:

  • strengthen Kissell (8th) and Shuler (11th)
  • draw Foxx (5th) out of her district
  • obey the VRA – that is, a majority-black district for Butterfield (1st) and a majority-minority district for Watt (12th)
  • maintain percentages for the other Democrats: Etheridge (2nd), Price (4th), McIntyre (7th), and Miller (13th)
  • get rid of that touch-point continuity in Guilford County between the 6th (Coble) and the 13th

Update: Many of you have correctly pointed out that NC may be gaining a 14th seat. There’s a plan for that in the works too.

Here’s the new map (yes, everything is contiguous!):

So here are two useful pieces of info that I had:

Here’s average Democratic performance, by consolidated VTD, across 10 contests (US President, US Senate, Governor, Lieutenant Governor, State Treasurer, State Auditor, Commissioners of Agriculture, Insurance, and Labor, and State Superintendent of Education). Average performance in 2008 was 51% Democratic.

Here’s also a map of the minority population of each VTD:

Stats here are: Population, Black Population, Latino Population, Average Democratic and Republican performance, Obama%, McCain%, the number of Democratic and Republican VTDs. SQL is getting angry at me for putting too much data in, so if you want the county breakdown, you’ll have to look here.

So district-by-district:


01 708,845 354,742 22,994 66.73% 32.51% 62.03% 37.50% 260 43

One of the hardest districts I’ve had to draw. The problem is, with NC’s population growth, each district has to contain more people. Additionally, the majority-minority areas of Northeastern NC have also lost population. Thus, the far reaching tentacles that hit so many counties, including Pitt (Greenville), Lenoir (Kinston), Wayne (Goldsboro), Wilson, Nash (Rocky Mount), Beaufort (Washington), and the list goes on. I like to think of this as the Petey Pablo district (listen to ‘Raise Up’ if you have any questions.) As you can see, we barely cross the threshold at 50.04% African-American. Average Democratic performance is 66.7% – Butterfield’s not in any danger. Obama and Hagan underperformed at 62.0% and 64.5% respectively; Bev Perdue crusied here with 69.3%.


02 708,383 203,577 51,146 54.85% 43.96% 51.35% 47.92% 76 50

Bob Etheridge’s district has never been that Democratic on a presidential level – Obama winning was a big surprise – but still quite Democratic on a local level. This district reflects that reality as well, but shifted somewhat further south. Etheridge’s home in Lillington (Harnett County) isn’t moved, and Harnett and Lee Counties remain in this district entirely. A large chunk of Republican leaning Johnston County is cut out in the north, replaced by Anson, Hoke, and Richmond counties along the SC border. Instead of anchoring Democratic performance in Raleigh, an updated 2nd finds its strength in Fayetteville.  Average Democratic performance is 54.9%. Obama got 51.4%, Hagan 54.9% and Perdue 55.0%.


03 709,086 103,074 34,867 41.25% 57.37% 36.01% 63.15% 33 173

This district contains 33 Democratic precincts, which in my mind is 33 too many. However, the 3rd has to accommodate all the parts that would dilute the minority-concentrated 1st district too much, and many of those urban precincts do lean left. This is most evident in Pitt County, where average Democratic performance was 49%. Given the polarized voting often evident in the South though, the rest of this district scores 41.3% overall. Obama severely underperformed, getting 36%.  Hagan and Perdue did better, getting 40% and 47% respectively. This has potential, but it simply isn’t possible to satisfy the VRA and make this district Democratic at the same time.


07 708,733 176,916 29,459 54.74% 43.74% 49.71% 49.46% 128 69

Mike McIntyre’s district is pretty much like Etheridge’s, more Democratic at the local level than nationally. This district stays with Wilmington and Lumberton, along with a part of Fayetteville not in the 2nd. This district really doesn’t change all that much, other than some traded precincts with the 3rd to make this more Democratic. Obama nudged out a win with 49.7%, 5 points below the average of 54.7%. Hagan and Perdue both did well here at 55.4% and 56.4% respectively.


04 709,502 168,493 37,358 59.17% 39.34% 60.65% 38.43% 99 59

David Price, we seem to forget, actually lost in the Republican tide of 1994 before reclaiming his district in 1996. The Triangle, of course, has changed quite a bit since then. This district remains centered on Durham and Chapel Hill (52% of the population), with some Republican-leaning sections of Wake County thrown in for another 22%. This district does expand eastward to grab some rural areas that couldn’t fit into the first 3 districts, but Price need not be concerned. It’s 59% Democratic, but this is one of those districts where Obama overperformed (60.7%). A 60.6% showing for Hagan is a testament to the Democratic nature of this district; Perdue did underperform at 57.1%.


13 708,616 153,464 41,474 57.07% 41.40% 59.86% 39.17% 83 32

Even in the most gerrymandered of states, you still have some examples of compactness. This is this map’s token compact district, if you will. It consists of Wake County only, losing a good chunk of border territory along the Virginia border and an arm into Greensboro (and that touch-point!). It contains all of Raleigh and Cary, along with some suburbs. Another strong Democratic district; average performance is a bit low at 57%, but this is where Obama excelled with 59.9%, an improvement over Brad Miller’s current district, actually.


05 708,588 142,544 30,781 53.80% 44.77% 52.85% 46.21% 130 85

This is the other half of Brad Miller’s district, featuring the Northern border counties – Person, Caswell, Rockingham, and Stokes. That’s not where the population is though, and to compensate, this district has a southern arm that hits parts of Orange, Alamance, Guilford, and Forsyth counties, including significant parts of Greensboro and Winston-Salem not drawn into Mel Watt’s 12th. Virginia Foxx doesn’t even live in this district, and I have a hard time seeing her winning this 53.8% Democratic district. Obama scored a respectable 52.9%, and Perdue 54.0%. Hagan, being from Greensboro, stomped here with 56.4%.


06 708,652 37,671 24,307 33.30% 65.21% 33.11% 65.90% 3 187

All the Republicans in central NC have to go somewhere, and this district is it. I think the packing of Republicans is especially evident, given that there are 3 Democratic precincts out of 190. With the Democrats in Alamance, Guilford, Union, and Mecklenburg drawn into other districts, all the Republicans are left here. At 33.3%, this is the most Republican district in NC on average. Obama scored 33.11%. Hagan did comparatively well at 37.3%, and Perdue absolutely bombed here, netting 29.2%. Sue Myrick may have less incentive to retire now.


12 709,069 306,416 48,281 65.15% 33.77% 65.35% 33.99% 122 58

Mel Watt’s VRA district was significantly easier to draw than Butterfield’s, partially because of the looser requirement. In essence, you have to have the majority-black precincts of Charlotte (Mecklenburg) and the Triad (Greensboro, High Point, and Winston-Salem) along with some connecting precincts. Much like the current 12th, I chose to run this district through Cabarrus, Rowan and Davidson Counties, roughly paralleling I-85. New is an arm into Statesville in Iredell County. In the interest of leaving more high-performing Democratic precincts for the 5th and 8th districts, this district also barely makes the cut at 50.02% minority. Watt’s still in no danger though, at 65.2% Democratic, 65.4% Obama, 66.7% Hagan, and 61.9% Perdue.


08 708,785 163,472 55,333 57.16% 41.60% 58.96% 40.24% 99 58

Larry Kissell gets a significant boost out of this district, though it becomes much more Charlotte-centric. His home in Montgomery County remains, although with a connecting strip through Stanly and Union counties into Mecklenburg. 72.6% of this district is now in Mecklenburg County, which is nice for Kissell since this district’s part of Charlotte was on average 63.3% Democratic (Obama did better at 66.3%). Overall, this makes for a 57.2% Democratic district; Obama did better at 59.0% and Hagan better still at 59.7%. Even Bev Perdue, who underperformed heavily in Charlotte (where Pat McCrory is Mayor) won, eking out a 400-vote win. This, I think, is a testament to the Democratic nature of this district, which should be safe for Kissell.


09 708,310 32,978 22,045 35.74% 62.55% 32.14% 66.53% 14 250

This district sets the stage for a Foxx-Coble showdown. I know the core of Coble’s district is actually in the new 6th, but Sue Myrick lives in the Mecklenburg part. Coble also lives in the Guilford part of this district. Funny how that works. (Foxx lives in the Avery County section.) More of this district is Foxx’s, but Coble’s also actually sane. I’ll leave you to decide how a primary between the two works out. The college town of Boone (Appalachian State) is removed, replaced by an arm into the Republican sections of Greensboro and Alamance County. Again, packing Republicans is at work here, with 14 out of 264 precincts being Democratic for an average of 35.8%. Obama got 32.1% (this is Appalachia, after all); Hagan 38.2%, and Perdue 36.9%.


10 708,675 50,090 26,779 37.10% 61.41% 35.10% 63.89% 15 162

Patrick McHenry’s district doesn’t change too much – he and Heath Shuler trade some precincts in the South to make Shuler’s district more Democratic by removing the vast majority of Republican Henderson County. I had originally wanted to draw a good district for 2008 candidate Daniel Johnson, but another Democratic district in Western NC was simply unrealistic. 15 out of 177 precincts are Democratic, leaving it at 37.1% Democratic, 35.1% Obama, 39.6% Hagan, and 33.0% Perdue.


11 708,808 62,133 17,174 52.09% 46.21% 48.89% 49.78% 120 127

I really tried to get Heath Shuler a district that Obama won, but it simply wasn’t possible without the district hitting Charlotte. Thus, we’re left with an Asheville-centered district that takes all of WNC to the west, and then sprouts two arms. One arm reaches northeast to grab Boone, and the other goes sawtooth along the SC border to get Forest City (Rutherford County), Shelby (Columbus), and finally, Gastonia (Gaston). This makes a 52.1% Democratic district, with Hagan and Perdue overperforming at 52.7% and 52.4% each. Obama came closer, falling 3,000 votes or 0.9% short, at 48.9%.

And there you have it, a 9-4 map of North Carolina. Without the VRA, it would be possible to squeeze at least one more Democrat out, but you can’t have everything. Questions, comments, and witty remarks about what these districts actually look like welcome.

By what margin will Bob Shamansky win?

View Results

Loading ... Loading ...

Redistricting 2011: Mississippi & N.Y.

After a couple-week hiatus, I’m back to Episode 11 of my redistricting series! On tap for tonight’s episode: a magnolia founds the next world empire! Or, rather, I’ve paired two unlikely diary neighbors, New York and Mississippi.

There were a number of people who earlier asked me why I hadn’t yet covered New York, one of the obvious choices for an early redistricting diary. The reason is that back in March I drew a map for NY that assumed Jim Tedisco would win NY-20 and be primed for elimination in 2012. Just tonight I redrew New York to, on the contrary, make the 20th more Democratic to help Murphy (though the news wasn’t all good, and I’ll get to that momentarily).

Previous efforts:

Diary 1: Massachusetts and Texas

Diary 2: Michigan and Nevada

Diary 3: Iowa and Ohio

Diary 4: Georgia and New Jersey

Diary 5: Florida and Louisiana

Diary 6: Pennsylvania and Utah

Diary 7: Illinois and South Carolina

Diary 8: Indiana, Missouri, and Oregon

Diary 9: Alabama, Arizona, and Kentucky

Diary 10: Colorado and Minnesota

The chasm lies below…

Mississippi

With only four districts and a Democratic legislature offset by Republican Gov. Haley Barbour, the goal here was simple: help Travis Childers and make his 1st District considerably more Democratic without noticeably diluting the 2nd (a VRA-protected black-majority district). Much like ArkDem’s Mississippi map from some time ago, mine keeps the 2nd solidly black-majority while moving the needle in the 1st several points in the Democrats’ favor. Unfortunately, there seems to be literally no way to prevent Gene Taylor’s 4th, in 2008 McCain’s strongest district in the state, from eventually flipping to the GOP. The Gulf Coast counties are just too absurdly Republican (little-known fact: Trent Lott represented the 4th not long before Taylor, who won a 1989 special election when Lott’s GOP successor died).

Photobucket

District 1 – Travis Childers (D-Booneville) — the overwhelming Republican nature of Mississippi’s northernmost counties prompted me to make a truly audacious move (hat tip to ArkDem on this) in removing DeSoto County, a major source of GOP votes, from this district and putting it instead with the mostly black, Delta-based 2nd. This district carefully grabs more marginally Republican counties that were previously with the 3rd and some black counties that were in the 2nd without, I think, overreaching. McCain would likely have still won here, but not with 62% as before (since my methods are so low-tech, I can only guesstimate, and I’ll say with only minimal knowledge that this variation of the 1st is probably about 55-57% McCain, enough to keep Childers solid and keep the district well in play for a future Democrat).

District 2 – Bennie Thompson (D-Bolton) — other than its two-county northern reach, this district is heavily Democratic and hopefully at least 60% black, with an Obama percentage somewhere around 63-65%.

District 3 – Gregg Harper (R-Pearl) — once I had set aside most available Democratic turf for Thompson or Childers, and drawn a logical Southern Mississippi seat for Taylor, this constitutes what was left over (hint: a lot of white Republicans, who easily overwhelm the significant minority of black Democrats).

District 4 – Gene Taylor (D-Bay St. Louis) — I hoped against hope that there was a way to bring the McCain share under 60%, even under 65%, but that’s impossible as far as I can tell. Consider this district a loan that can be deferred only as long as Taylor chooses to stay.

New York

Well, then…I had to eliminate one seat (it’s possible the Empire State will lose two, as in the last reapportionment, but all models currently project that its 28th slot will barely be saved). Murphy winning NY-20, much as it thrilled me, put a real monkey wrench in my plans and forced me to start over with the upstate districts, especially since there are a handful of upstate Democrats with marginal districts needing protection (damn all those votes being wasted in the city!). I started my do-over looking for a way to eliminate Pete King without jeopardizing shaky Democratic strength on Long Island…turns out, not a good idea. Population loss is mostly confined to upstate, so any NYC or Long Island seat elimination will cause havoc with the necessarily illogical lines. Simply put, the dropped seat will have to be upstate. If New York ends up dropping two, maybe King can be drawn out.

I tried drawing upstate a few different ways, each messier and more gerrymandered than the last, until deciding to try something a little controversial: put Mike Arcuri at risk. Of course, I started this process wanting to shore up Arcuri, just like Massa, Murphy, Maffei, and Hall, but eventually discovered that his district would be the most difficult to shore up based on pure geography. It’s not hard to move the 20th north, or put a little Rochester into Massa’s district, but with so many narrowly GOP-leaning and swing counties in the middle of the state, helping Arcuri would have been a lot tougher.

So I paired Arcuri with veteran Republican John McHugh in a relatively even-handed district. That may bode ill for Arcuri (whose first reelection in 2008 was shockingly close) against the longtime incumbent from up north, but with Obama likely to again command some coattails in 2012 New York, maybe he has a good shot. On the flip side, McHugh hasn’t faced a tough race in forever and may bow out rather than test his probably rusty survival skills. So my proposed 23rd is a tough call, and Democrats in the legislature might prefer to seek a certain GOP loss, but they’ll be forced to resort to some mighty contortions of mapmaking to derive that result.

Other than that risky move, my other choices were, I think, logically conceived and beneficial to the Democrats. Murphy and Massa are the big winners in this map, as are Hall and Maffei to a lesser degree. It was hard not to spread upstate Dem votes too thin, especially since upstate counties tend to be within 55% one way or the other (unlike the overwhelming Democratic margins in the city), but I think I may have pulled it off, at least as well as I could while equipped with such minimal redistricting tools.

Photobucket

You can’t easily see the urban districts, which is good because I wasn’t able to be very precise with them (what with only a calculator, Excel, and Paint to guide me). In fact, my changes to the NYC and Long Island districts were so minimal that there’s little point to addressing each district individually. Suffice to say that, other than maintaining VRA racial protections, the only “downstate” district I thought carefully about was the 13th, which in my map comprises all of Staten Island plus a small portion of Brooklyn. Beginning at the bottom of the Hudson Valley, then:

District 17 – Eliot Engel (D-Bronx) — stretches from the Bronx to Orange County. I diluted Democratic strength a little bit to help John Hall, but the 17th stays a safe seat.

District 18 – Nita Lowey (D-Harrison) — entirely within Westchester County, safely Democratic.

District 19 – John Hall (D-Dover Plains) — 91% of Dutchess, 28% of Orange, all of Putnam, and 23% of Westchester = Dem-leaning and more clearly Dem-trending suburban/exurban district.

District 20 – Scott Murphy (D-Glens Falls) — altered not just to become more Democratic (and it obviously is, in this iteration) but specifically to strengthen Murphy, by grabbing more of the rural north and dropping most of Saratoga. Perhaps Murphy will do well in Saratoga in 2010, without a regional pol as his opponent, but since Obama’s numbers were stronger up north than in Saratoga anyway, this seemed like a sensible choice.

District 21 – Paul Tonko (D-Albany) — a bit less Democratic, this district still includes all of Albany County but also all of Schenectady and 79% of Saratoga. Tonko would represent three major upstate towns under my map, which may present occasional conflicts of interest, but certainly appeases the “geographical compactness” fetishists.

District 22 – Maurice Hinchey (D-Hurley) — sheds a few Democrats to help Arcuri and Massa, but stays Dem-leaning and reasonably compact. The toughest pill to swallow for Hinchey would be ceding liberal Tompkins County (Ithaca) to Arcuri/McHugh while picking up some moderate Republican turf in the Hudson Valley. This is what I mean about having to balance the interests of different Democrats upstate. Hinchey, and a future Democrat, should still be just fine here.

District 23 – John McHugh (R-Pierrepont Manor) vs. Mike Arcuri (D-Utica) — combines some of McHugh’s rural northern counties (the more Democratic of which were given to Murphy) with Arcuri’s Oneida County base and some overwhelmingly Arcuri-friendly territory down in Ithaca. Knowing McHugh’s moderate reputation, popularity with military interests, and seniority advantage, I went out of my way to give Arcuri a fighting chance. For whatever it’s worth, this district would have voted for Obama, as did both of the current districts — Arcuri’s 24th and McHugh’s 23rd.

District 24 – Dan Maffei (D-Syracuse) — what was involved with this district was more tinkering than careful strategy, as any reasonable take on Maffei’s district will result in something Onondaga County-heavy and Dem-leaning.

District 25 – Chris Lee (R-Clarence) — a true “leftovers” district after I had done everything within reason to put Massa’s 28th in the Obama column while keeping Slaughter and Higgins rock-solid. Other than Chautauqua County and some Buffalo-area neighborhoods, this district should be plenty Republican. And yes, I know some of you would have liked me to eliminate Lee, but there are enough GOP votes in this part of New York that Massa (or Higgins) would have been doomed for defeat under that plan.

District 26 – Brian Higgins (D-Buffalo) — literally stretches from Buffalo to Niagara Falls, for a Rust Belt-ish industrial and Democratic-leaning district.

District 27 – Louise Slaughter (D-Fairport) — much like its current form, this covers most of the “lakeshore curve” in Western New York, stretching east from Niagara Falls to Rochester (about 2/3 of Monroe County is here, with the other third given to Massa, who definitely could use the electoral aid, while Rules Committee Chairwoman Slaughter is safe as can be).

District 28 – Eric Massa (D-Corning) — if this district were a tourism ad, its slogan would be “where West and Central meet”. The Rochester portion of the district likely puts Massa in a much more advantageous position and results in a slightly Obama-supporting district (the current 29th voted for McCain). Monroe County is easily the largest population source, with Ontario, Steuben, Chemung, and Cayuga (88% of which is here) rounding out the top five. Though it’s far from a Democratic stronghold, this district may be my most effective upstate seat in terms of the overall change in its partisan composition.

Overall, this map does what we’d all like in somewhat solidifying a three-seat ceiling for the Republicans (a very bad year might result in defeats for Massa and either Hall or Murphy, but the average year would preserve at least 25 Democratic seats out of 28), one of which is quite vulnerable. More sophisticated technology would doubtlessly allow me to create more precise boundaries and more accurately estimate the partisan dynamics of each district, but given the limited resources I have, I think I did pretty okay.

Thoughts on either state? What else do you want to see from this redistricting series?