Virginia 9-2-1

Virginia was really bad for democrats in 2010 (what state wasn’t?). The republicans picked up the 2nd, 5th, and 9th. As I am a democrat I usually make maps leaning that way so I decided to make a republican map. This is an 8-2-1 map and preserves the VRA district while weakening only Morgan Griffith and Cantor a bit.  It’s not perfect but I think it pretty good. For those who don’t know, in the individual district pictures, light green is new district only, pink is old only, and the darkish green is areas in both.


District 1


Incumbent: Rob Wittman

New Stats:

Deviation from Target: 176

Obama: 47.8%

McCain: 52.2%

Dem: 44.6%

GOP:  55.6%

White: 67.2 %

Black: 20.6 %

Hispanic: 6.3%

Old Stats:

Deviation from Target: 45,520

Obama: 48.4%

McCain: 51.6%

Dem: 44.8%

GOP:  55.2%

White: 67.7 %

Black: 19.6 %

Hispanic: 6.8%

The 1st had to lose some population and so it moved a bit, but it is largely unchanged with the exception of taking up a little more of the suburbs in SE Virginia.  Likely R

District 2:


Incumbent: Scot Rigell

New Stats:

Deviation from Target: -26

Obama: 49.2%

McCain: 50.8%

Dem:  46.4%

GOP:  53.6%

White: 65.7%

Black: 20.4%

Hispanic: 6.0%

Old Stats:

Deviation from Target:  -70,482

Obama:  52.4%

McCain: 47.6%

Dem: 49.1%

GOP:  50.9%

White: 62.6%

Black: 21.7%

Hispanic: 6.9%

Nye was elected on the backs of two very poor republican congressmen. While he is young, attractive, and from Philadelphia (awww yeah), with this new district he would not have won in 08. Rigell’s biggest worry is the primary with his donations to Obama and all that jazz. This seat mainly took what district one gave up.  Likely R

District 3:


Incumbent: Robert Scott

New Stats:

Deviation from Target:  -267

Obama: 82.2%

McCain: 17.8%

Dem:  76.9%

GOP:  23.1%

White: 28.9%

Black: 61.0%

Hispanic: 5.3%

Old Stats:

Deviation from Target: -53,960

Obama: 75.7%

McCain: 24.3%

Dem:  28.7%

GOP:  71.3%

White: 36.2%

Black: 53.7%

Hispanic: 5.0%

Mr. Scott would probably be happy with this district as it gets more black and democratic. The district did have to pick up people, and it did this by snaking to as many areas of strength as possible.  I have to say it is horrendous looking. The VRA  mapping standards I have mixed feelings about… Yes they are good for protecting the rights of minorities. This though? Ugh. Safe D

District 4:


Incumbent: Randy Forbes

New Stats:

Deviation from Target:  -255

Obama: 48.8%

McCain:  51.2%

Dem: 46.4%

GOP:  53.6%

White: 61.7%

Black: 28%

Hispanic: 5.3%

Old Stats:

Deviation from Target:

Obama: 51.0%

McCain: 49.0%

Dem:  48.2%

GOP:   51.8%

White: 57.8%

Black: 33.2%

Hispanic: 4.5%

Randy Forbes is unfortunately a skilled politician.  While he wins in a current Obama district easily, I don’t think anyone in the GOP would mind his district getting a bit safer. The only serious challenge he had was his first against Louise Lucas in the 2001 special election. Likely R.

District 5:


Incumbent: Robert Hurt

New Stats:

Deviation from Target: 122

Obama:  43.3%

McCain:  56.7%

Dem: 42.7%

GOP:  57.3%

White: 75.1%

Black: 19.5%

Hispanic: 2.7%

Old Stats:

Deviation from Target: -39,711

Obama:  48.5%

McCain:  51.5%

Dem: 47.3%

GOP:  52.7%

White: 71.7%

Black: 21.9%

Hispanic: 3.1%

5 is the most important district. Perriello is not in this district, and half of his base in Charlottesville is gone. Included, however is Rick Boucher.  Neither Boucher or Perriello has much to run, as they both have a lot of new constitutions AND the district is 5 points more republican than it was before.  Safe R unless Perriello or Boucher run, than Likely R.

District 6:


Incumbent: Bob Goodlatte

New Stats:

Deviation from Target: -43

Obama:  43.9%

McCain: 56.1%

Dem: 42.8%

GOP:  57.2%

White: 81.5%

Black: 10.9%

Hispanic: 4.2%

Old Stats:

Deviation from Target: -23,285  

Obama:  43.2%

McCain: 56.8%

Dem: 42.1%

GOP:  57.9%

White: 81.2%

Black: 11.1%

Hispanic: 4.3%

This close save district remains close to safe. Little changes, mostly just to fill in where other districts no longer are because it was lacking population. Likely R.

District 7:


Incumbent: Eric Cantor

New Stats:

Deviation from Target: -601

Obama: 48.1%

McCain:  51.9%

Dem:  43.4%

GOP:  56.6%

White: 68.9%

Black: 14.5%

Hispanic: 8.6%

Old Stats:

Deviation from Target: 25,081

Obama: 46.6%

McCain: 53.4%

Dem: 43.3%

GOP:  56.7%

White: 72.3%

Black: 16.7%

Hispanic:  4.8%

Snaking into Prince William to shore in place of 1 and 11, the partisan numbers actually don’t change all that much as the district loses parts of Richmond. I kept in the most conservative precincts because I figure that’s where Cantor lives. Cantor should be fine. Likely R

District 8:


Incumbent:  Jim Moran

New Stats:

Deviation from Target: 531

Obama: 68.2%

McCain: 31.8%

Dem:  67.7%

GOP:  33.3%

White:  53.9%

Black: 13.2%

Hispanic: 18.4%

Asian: 11.4%

Old Stats:

Deviation from Target: -27,688

Obama:  68.2%

McCain: 31.8%

Dem: 67.7%

GOP:  33.3%

White: 54.4%

Black: 13.3%

Hispanic: 18.4%

Asian: 10.7%

Almost unchanged, just look at demographics. Safe D

District 9:


Incumbent: Morgan Griffiths

New Stats:

Deviation from Target: -196

Obama: 43.4%

McCain: 56.6%

Dem: 45.7%

GOP:  54.3%

White: 88.8%

Old Stats:

Deviation from Target:  -72,764

Obama: 40.3%

McCain: 59.7%

Dem: 43.7%

GOP:  56.3%

White: 92%

The district had to gain people and Griffith’s home of Salem. The district got more democratic by taking in parts of Charlottesville and some of its suburbs to weaken cut Periello’s base in two. Periello resides in this district but might still choose to run in the 5th.   Likely R, will move to Safe fairly soon as Griffith’s gains name recognition throughout the district.

District 10:


Incumbent: Frank Wolf

New Stats:

Deviation from Target: -98

Obama: 49.4%

McCain: 50.6%

Dem: 48.1%

GOP:  51.9%

White: 66.9%

Hispanic: 10.7%

Asian: 13.5%

Old Stats:

Deviation from Target: 144,282

Obama: 50.2%

McCain: 49.8%

Dem: 47.2%

GOP:  52.8%

White: 63.8%

Hispanic: 13.5%

Asian: 12.4%

Wolf has won for 30 years straight, usually with ease. His district is now a McCain district but it only moved by about .8%. Lean/Likely R

District 11:


Incumbent: Gerry Connolly

New Stats:

Deviation from Target: 645

Obama: 55.6%

McCain: 44.4%

Dem: 50.5%

GOP:  49.5%

White: 54.4%

Black:  10.2%

Hispanic: 16.9%

Asian: 14.9%

Old Stats:

Deviation from Target: 62,964

Obama: 56.6%

McCain: 43.4%

Dem: 52.3%

GOP:  47.7%

White: 55.0%

Black: 11.1%

Hispanic: 15.4%

Asian: 14.9%

This district becomes more swingy by taking away some liberal territory like Dale City and giving to Eric Cantor. Leans slightly D but I’d call it a toss-up. Connolly would have lost in 2010 with this district.
Redistricting Michigan: What can the GOP do? (Part 1)

As we all know, the GOP did very well in a lot of state-level races around the country, in addition to their big gains in the House.  This was especially true in Michigan, where the Michigan House of Representatives flipped from D to R after a 20 seat Democratic loss, and the Republicans gained seats in the Michigan Senate, going from a 22-16 majority to a 26-12 supermajority.  Republican gubernatorial candidate Rick Snyder won convincingly.  And over on the Michigan Supreme Court, two GOP-backed candidates (one incumbent justice, one challenger to an incumbent recently appointed by outgoing Gov. Jennifer Granholm) won their races as well, turning a narrow 4-3 “Democratic” majority into a 4-3 “Republican” majority.  (The races and the court are nominally non-partisan…but everyone knows.)

There has been much buzz about exactly what this complete GOP control of the redistricting process means for the reapportionment process.  Given the fact that Michigan is home, I’ve been among those wondering just that.  This is my attempt at a prediction (or two).  As an added bonus, it is my first diary ever here at SSP!

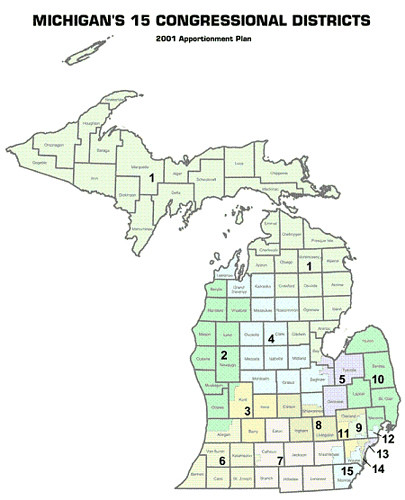
First, there’s the current map:

2001 Apportionment

This is the 2001 apportionment plan based on the 2000 census.  Like the forthcoming map, it was drawn when the state government was largely under Republican control (Legislature and Governor certainly were…I’m not sure about the MI Supreme Court at the time).  As such, the map as it stands is already a GOP gerrymander, though it doesn’t look as obvious as, say, some of the districts in Pennsylvania ::cough::PA-12::cough::.  This map flipped a 9-7 D-R delegation to 9-6 R-D.  As with the 2000 census, Michigan loses one seat in 2010, down to 14 overall.

After the 2010 elections, we’re back from an 8-7 D-R map (Democrats flipped two districts in 2008) to a 9-6 R-D map.  Districts 1, 2, 3, 4, 6, 7, 8, 10, and 11 will be represented by Republicans in the coming Congress; Districts 5, 9, 12, 13, 14, and 15 will be represented by Democrats.  The only real change from 2000 is that District 1 is now in Republican hands and District 9 is in Democratic hands.  As many of you know, the 9th (my district!) was drawn as a Republican district, but has trended away from the GOP and is now held by Democrat Gary Peters.  District 1 was Bart Stupak’s district, which fell in the wave this year after he retired.

Obviously, if the Republicans want to try to protect all their incumbents, new and old, they will have to put two Democrats together to account for the loss of one seat.  Much of the discussion I’ve seen has revolved around the idea that the Republicans are likely to match Gary Peters in the 9th and Sandy Levin in the 12th and either let them fight it out or encourage/force Levin into retirement.

I decided to explore the idea of such a match up to see exactly how it would impact redistricting throughout the rest of the state.  Based on copious hours of work on the maps you’ll see below, a Peters-Levin match-up is eminently doable, but it will likely wreak havoc throughout the rest of the state for Republican incumbents.  Although this seemed the most likely match-up to me, I’m starting to think that the GOP may instead try to pair John Dingell (MI-15) and John Conyers (MI-14), leaving Levin and Peters alone.  I plan to explore that match-up another time.

Before we get to the maps, here are the principles I used in drawing them:

1.  Wherever possible try to keep districts as compact as possible and without breaking county or municipal/township lines.  This was not as high a priority as it otherwise might have been, as the Supreme Court is, IMO, likely to be a bit flexible with these requirements which are embodied in state law.

2.  Keep each Republican incumbent in a single district, without matching them up with another Republican or forcing them to move.  (While they obviously don’t have to live in the district, it always helps from a PR standpoint…)

3.  Try to shore up shakier Republican districts.

4.  Maintain two minority-majority districts based in Detroit (currently the 13th and 14th).

I used Dave’s App without using the “estimate new population” check box, as it had projected the state’s population to increase, rather than go down as it did.  So, the current population figure on the app is actually closer to what it will be than the estimate.  Obviously the population will change within the voting blocks, so take these maps with a grain of salt.

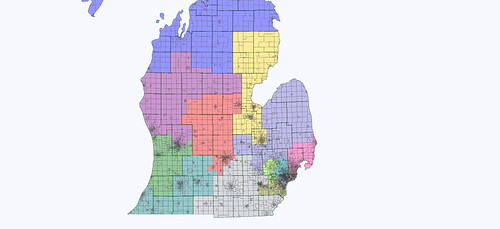
My first attempt at a Peters-Levin mash looked overall as follows:

Peters Levin Mash 1 Overview

Without the partisan numbers, I had to kind of eyeball the districts based on county-level returns and my own knowledge of the state.  I figured the 2008 Obama numbers were the high mark in most counties since McCain basically gave up the state a month before the election.

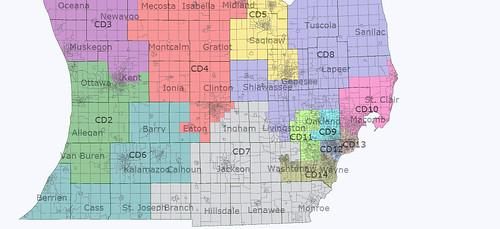
Here is the Lower Peninsula, and then a close up of the southern Lower Peninsula:

Peters Levin Mash 1 LP

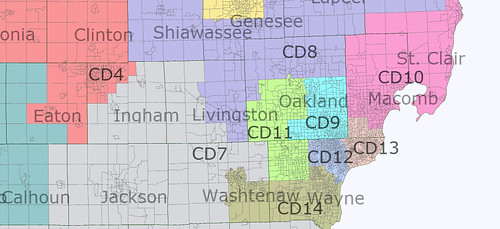
Peters Levin Mash 1 Southern Lower

The first mash-up district I built more closely resembles Peters’ current 9th, but swoops south to take in Ferndale and Royal Oak (Levin’s home) in the southeast corner of Oakland County.  The district surrenders its northern reaches (making Mike Rogers my Congressman…again) and West Bloomfield, becoming more compact, but probably more Democratic than it is currently.  The district remains entirely within Oakland County.

Peters Levin Mash 1 SE Mich

As the maps show, though, this configuration likely causes chaos elsewhere.  What was much of Sandy Levin’s 12th in southern Macomb (Democratic) has to go somewhere, and Candice Miller is unlikely to want all of it.  So, the 13th, which will be held by incoming freshman Hansen Clarke, shifts a bit north from Wayne County.  The district stays majority African American, but just barely.  This pulls Candice Miller’s 10th south a bit, which costs her much of the thumb area.  John Conyers’ district then shifts east a bit, but remains firmly African American majority.  John Dingell’s district (now the 15th, here renumbered the 14th) is then pulled north out of swingy Monroe County and into friendlier territory in Wayne and Washtenaw Counties.  Finally, Thad McCotter (MI-11) suffers as he picks up more Dem-friendly West Bloomfield in a mild attempt to keep his district compact.

Outside SE Michigan, things get even more interesting.  I’ve pretty much concluded that Crazy Tim…I mean, Tim Walberg (MI-07) is stuck with a swing district unless the GOP folks in Lansing throw Mike Rogers (MI-08) under the bus and give Walberg all of heavily Republican Livingston County…which is where Rogers is from.  So not happening.  In this map, Walberg’s district shifts east, giving up more Dem-friendly Calhoun County (Battle Creek) and swingy Eaton County for swingy Monroe County and a slice of Livingston County.  Calhoun County still has to go somewhere, and the only district really in the area is Fred Upton’s 6th.  I doubt Upton will let this happen, as he already has heavily-Democratic Kalamazoo to contend with.

Likewise, someone needs to pick up Democratic Lansing and Walberg certainly won’t want it.  Rogers seemed a likely contender at first (even though he wouldn’t want it either), but in the end his 8th District ended up (hideously, I must say) going east into the thumb area to pick up Candice Miller’s losses.  (I tried at least 3 configurations to try to stretch Rogers’ district west and Dale Kildee’s 5th or Dave Camp’s 4th east into the thumb…I just couldn’t get anything that looked workable though.)  This seemed like the best I could get, as ugly as it is.  So, in the end the lucky winner of Lansing was Republican Dave Camp (MI-04).  Camp’s district now occupies much of the farm country heartland of the state and includes his home in Midland, in an attempt to counterbalance Lansing.  Dale Kildee’s 5th District takes in the Democratic areas in Flint, Saginaw, and Bay County, then stretches north to take in a few rural areas; I’d guess it stays firmly Democratic, though.

Finally, in the west and north, the 1st District which will be held by Republican Rep.-elect Dan Benishek shifts west and takes in Traverse City, probably shoring up the district for him.  Republican Rep.-elect Justin Amash’s 3rd District gets a bold new look, but probably stays Republican, splitting urban Grand Rapids with the neighboring and still heavily Republican 2nd.  (I realized after I finished everything that Amash may have to pick up and move a few miles after all, as I think I accidentally put him in the new 2nd with fellow Republican freshman Bill Huizenga.  Oops.)  The new 2nd, instead of stretching up the Lake Michigan coast, consolidates ruby red Ottawa County with southern Kent County (Grand Rapids) and areas further south.

Given the chaos that such a map could cause, I knew that it was unlikely that the Republicans in Lansing would try this.  Even if they managed to tweak things (say, finding a way to stretch the 4th or 5th into the thumb instead of the 8th), having a Peters-Levin mash-up with a 9th District as I’ve constructed it here could cause too much of a headache to be worth the trouble.  The real problem seemed to be with the shift in the districts caused by the leftover Democratic-leaning territory in southern Macomb, which is currently in Sandy Levin’s district.

I think the bottom line is that the current map is already close to an effective Republican gerrymander as you can get.  There are islands of Democratic strength, especially in SE Michigan and sprinkled across the rest of the state that make it hard to make the Republican incumbents much stronger without hurting a fellow Republican.  Without threading the needle precisely, the whole house of cards could end up collapsing in a Dem-friendly year, wave or no.

My next set of maps for Part 2 of this diary (to be posted within the next couple days) looks at a Peters-Levin match up in a district that looks more like Levin’s current 12th, rather than like Peters’ current 9th.  The results were a little more encouraging for the GOP, but still caused problems that make me think they won’t go for that either.  I’ll leave you all with that as food for thought until next time.

By what margin will Bob Shamansky win?

View Results

Loading ... Loading ...

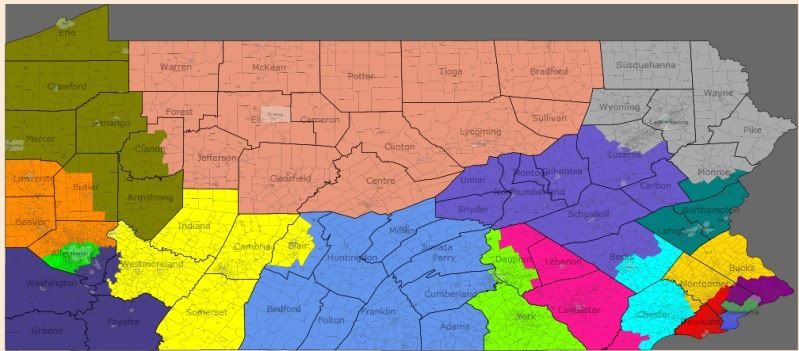
5-7-6 PA Gop compromise/fair districts

I made a map with two goals. They were:

1.) Keep cities together, and if possible, counties

2.) Make the district without care for partisanship

Philadelphia is the only city in more than one cd, and only four counties have 3 or more cds in them (Allegheny, Philadelphia, Chester, and Montgomery. 4 out of 69 aint bad, considering that Philadelphia has to be.)

There is high upside here for both parties, and this is a decent compromise, although more favorable to the republicans. It comes down to if you believe 2008 or 2010 is the closer to reality.

I really only think one picture is necessary due to the nature of this exercise. If anyone wants a zoomed view, lemme know. All are under 1000 off the ideal population.

District 1 (Blue): 53% Black, 88% Obama

Entirely Philadelphia. Safe as could be. 1-0-0

District 2 (Green): 36% B, 14 Hispanic, 5 Asia, 80% O

Entirely Philadelphia. Safe as could be. 2-0-0

District 3 (Dark Magenta): 58% O

North-East Philly, and parts of Montgomery and Bucks. Leans very D. 3-0-0

District 4 (Red): 61% O

Delco and a part of montco. Likely D. 4-0-0

District 5 (Gold): 54% O

Rest of Montgomery and Bucks, plus a tiny bit of chester. Toss-up, Leans slightly R. 4-0-1

District 6 (Teal): 56% O

Bethlehem, Allentown, Easton and their counties, plus a bit of monroe. Toss-up, Leans slightly D. 4-0-2

District 7 (Dark Grey): 56% O

Scranton, Wilkes-Barre and the surrounding area. Toss-Up, Leans slightly D. 4-0-3

District 8 (Slate Blue): 53% M

A few small cities (Hazelton, Bloomsburg, Pottsville), but a lotta empty area. Likely R. 4-1-3

District 9 (Cyan): 55% O

Reading, the rest of Berks and a huge part of chester county. Pure Toss-Up 4-1-4

District 10 (Deep Pink): 56% M

Lancaster, Lebanon and space. Likely R. 4-2-4

District 11 (Chartreuse): 51% M

Harrisburg and York. Lean M. 4-3-4

District 12 (Cornflower Blue): 63% M

Not a lot going on here. Safe R. 4-4-4

District 13 (Dark Salmon): 54% M

North PA. Surprised it is this close tbqh. Likely R. 4-5-4

District 14 (Olive): 49% O (Wins by about 600 votes).

Erie. Toss-Up, Leans R. However, I think obama underperformed what a congressional D could do here so i’m counting it in the toss-up.  4-5-5

District 15 (Dark Orange): 55% M

North of Pitt. Likely R. 4-6-5

District 16 (Lime): 64% O

Pittsburgh. Safe D. 5-6-5

District 17 (Dark Slate Blue): 50% O

South of Pitt. Toss-Up, Leans R. 5-6-6

District 18 (Yellow): 56% M

The rest, includes Altoona. Likely R. 5-7-6.

Not the best either side could do, but most definitely fair. Both sides have reason to believe they could win a lot of the toss-ups. I hope the gopers believe that anyways. Well, lemme know.

36-0 Texas

The hardest thing for me to remember when making GOP friendly gerrymanders is that a 50% John MctCain district isn’t a toss-up but a likely R district, similar in theory to a 60% Obama District. 5 points more friendly to the gop then the nation as an average implies that, but it is somewhat tricky for me, at least, to wrap my mind around it. However, that was my goal when I started North Carolina: create as many districts that went GOP in 08 as possible. After getting an 11-2 in a state that went for Obama, i figured a 36-0 in Texas was possible. and it was. One district voted for Obama by less than 1000 votes, so I’m going to count it. A 59% Obama district would be okay for most of us here… Without further ado, MAPS!

As always, ask me and i will provide a zoomed in map of whatever area you wish if it isn’t clear from the big one.

http://img.photobucket.com/alb…

http://img.photobucket.com/alb…

El Paso: http://img.photobucket.com/alb…

District 1 (Blue):  Mccain 56%, 56% Hispanic

El Paso and Odessa

District 2 (Green): M 53%, 63% H

Rest of El Paso and some nearby counties

San Antonio and Austin: http://img.photobucket.com/alb…

District 3 (Purple): M 50%, 60% H

South San Antonio

District 4 (Red): M 51%, 50% H

North and West Antonio

District 5 (Yellow):  M 51%, 40% H, 10% Black, 3% Asian

East and North San Antonio

District 6 (Teal): M 50%, 72% H

Laredo and some Border counties, then up to West Texas

District 7 (Gray): M 50%, 66% H

McAllen and Border areas all the way up to Bastrop and Fayette Counties

District 8(Violet) M 51%, 62% H

Brownsville, Mcallen and then up.

District 9(Sky Blue): M 51%, 59%  H

Brownsville, Harlingen, up to Williamson and Milam counties.

District 10 (Pink):  M 50%, 35% H, 16% B, 3% A

Corpus Christi and up

Houston:  http://img.photobucket.com/alb…

District 11 (Lemon-Lime Green): M 55%,  55% White

South of  Houston

District 12 (Blue-Line Green) :  M 56%, 22% H, 20% H, 11% A

Some of the south-west of Houston and then surroundin areas.

District 13(Light Brown): M 53%, W 52%

Houston and some areas north

District 14(Gold):  M 57%,  W 61%

Houston and some areas north

District 15 (Orange): M 52%, 32% H, 19% B, 4% A

South of Houston, with a bit of the city

District 16(Lime Green):  M 52%, 39% H, 12% B, 4% A

Houston and Areas East

District 17(Navy blue): M 52%, 41% H,  16% B

Houston and Areas North East

District 18 (Golden Yellow):  M 56%, 56% W

North of Houston

District 19 (Puke Green): M 56%, 65% W

Wraps around 11-17

District 20 (Light Pink): M 52%, 59% W

Wraps around Austin and takes part of the city then to Abilene

District 21 (Blood Red): M 54%, 66% W

Parts  of Austin then  going to sparsely populated Northern Texas

District 22 (Poo Brown):  M 51%, 79% W

Austin and North Texas

Dallas-FW: http://img.photobucket.com/alb…

District 23 (Robin’s Egg Blue): M 54%, 57% W

Dallas and some northern suburbs

District 24 (Dark Purple):  M 56%, 59% W

Dallas and Some Eastern areas

District 25 (Rose): M 54%,  59% W

Dallas then to some less populated eastern areas

District 26 (Silver) M 58%,   54% W

Dallas, FW, then to North Texas

District 27 (Sea Green) M 49%, 54% W

Dallas, FW, then to North Texas

District 28 (Pinkish Purple) M 60%, 57% W

Irving, then up to North Texas

District 29 (Gray Green): M 53%, 60% W

Waco and Forth Worth

District 30 (slightly lighter shade of rose then

the one touching it): M 55%, 60% W

Parts of Arlington, Dallas and Fort Worth

District 31 (Tan): M 61%, 71% W

North Fort Worth and Dallas then North

District 32 (Red Orange): M 64%, 79% W

North FW and then northern areas surrounding it

District 33 (I can’t name that many different shades of blue): M 63%, 80% W

North of Dallas

District 34 (Somewhat dark-green): M 69%, 75% W

Wraps around a lot of other districts, filling in a lot of gaps

District 35 (Royal Purple): M 62%, 64% W

Everything Else Part 1

District 36 (Not Flyers Orange, but I’m using it anyways): M 68%, 69% W

Everything Else, Part 2

This is not a perfect 36-0 Map. The last 5-6 districts could bleed some republican voters to some of the more borderline districts. However, in an ok to good year, the republicans win all 36 seats barring an exceptional democratic candidate.

Dave’s seems to have deleted my other maps. I’ll redo them later and either edit this diary or do a new one, depending on what you guys thing.

Texas dem redistricting

Had a whole write up posted but it got deleted. No comments this time but you guys know the deal by now. Its a 17-16-3 Democratic gerrymander.

http://img.photobucket.com/alb…

http://img.photobucket.com/alb…

El Paso: http://img.photobucket.com/alb…

District 1 (Blue) 54 Obama 66 Hispanic

El Paso and Odessa

Lean/Likely D

District 2 (Green) 57 O 72 H

El Paso and tentacles

Likely D

District 3 (Purple) 56 O 78 H

Mexican Border and some other counties

Likely D

District 4 (Red) 55 0 74 H

Mexican Border and it snakes up

Lean/Likely D

District 5 (Yellow) 55 0 72 H

Mexican Border and Corpus Christi

Likely D

District 6 (Teal) 34 O 59 White

Counties that border the Gulf of Mexico and going inward.

Safe R

San Antonio: http://img.photobucket.com/alb…

District 7 (Gray) 55 O 58 H

Southern San Antonio and surrounding areas

Likely D

District 8 (Lilac Purple) 54 O 54 H

Middle of San Antonio and some other parts of Bexar county.

Lean/Likely D

District 9 (Sky Blue) 33 O 69 W

Northern San Antonio and its conservative suburbs and exurbs.

Safe R

Austin: http://img.photobucket.com/alb…

District 10 (Bright Pink) 55 O 57 W

Austin and its suburbs

Likely D

District 11 (Lime Green) 54 O 63 W

Austin

Lean/Likely D

District 12 (Periwinkle) 53 O 67 W

Austin and Killeen

Lean D

District 13 (Burt Sienna) 31 O 74 W

Waco, Temple and empty spaces

Safe R

District 14 (Gold) 25 O 66 W

A lot of space and part of lubbock

Safe R

District 15 (Orange) 25 O 66 W

More Nothing.

Safe R

Fort Worth: http://img.photobucket.com/alb…

District 16 (Kelly Green) 52 O 51 W

Surprisingly Conservative Fort Worth

Toss-Up

District 17 (Navy Blue) 30 O 84 W

Suburbs of Fort Worth

Safe R

Dallas: http://img.photobucket.com/alb…

District 18 (Golden Yellow) 59 O, 30 Black 19 Hispanic 5 Asian

Dallas

Safe D

District 19 (Puke Green) 54 O, 22 Black 27 Hispanic 2 Asian

Dallas and a few southward counties

Likely D

District 20 (Rose) 55 O, 39 Hispanic 14 Black 6 Asian

Dallas and Irving

Likely D

District 21 (Blood Red) 50 O, 54 W

Dallas  and surrounding areas

Toss-Up

District 22 (Poo Brown) 39 O 72 W

North of Dallas and FW

Safe R (Winnable with a great candidate in a good year or an incumbent in an ok one, but tilts very r)

District 23 (Robin’s Egg Blue) 35 O 75 W

North of FW to OK border

Safe R

District 24 (Dark Purple) 29 O 72 W

Wraps Around 19, 13 to the end of 11

Safe R

District 25 (Salmon)  35 O, 79 W

North Of Dallas

Safe R

District 26 (Dark Gray) 33 O, 77 W

Between OK Border and 24

Safe R

District 27 (Seafoam Green)31 O 72 W

Along the LA Border

Safe R

Houston: http://img.photobucket.com/alb…

Note: I made a small error here in the large map. It is fixed in the numbers and in the close–up of houston (part of the district didn’t connect)

District 28 (Really Light Purple) 58 O  28 Black 13 Asian 26 Hispanic

Southwest Houston

Safe D

District 29 (Sage Green) 33 O 73 W

Northeast of Houston

Safe R

District 30 (Pinkish-Red near houston) 33 O 70 W

Wraps Around Houston

Safe R

District 31 (Pale Yellow) 39 O, 61 W

South of Houston

Safe R (See District 22)

District 32 (Bright Red) 37 O, 66 W

Wraps even closer around Houston then does 30

Safe R

District 33 (Denim Blue) 56 O, 24 B 7 A 28 H

Houston

Likely D

District 34 (Green in Houston) 51 O, 12 B 6 A 34 H

Houston

Toss-up

District 35 (Purple in Houston) 53 O, 16 B 3 A  43 H

North Houston

Lean D

District 36 (Orange in Houston) 62 O, 26 B 42 H

Southeast Houston riding up to Northwest Houston

Safe D

What I think makes this most effective is that the Democratic districts will only get more liberal over the Decade, cementing the safety of Incumbents and helping unseat any republicans who manage to pull an upset or win a toss-up.

Please reply, this took a while 🙂

And a big thank you for my girlfriend for help with the names of colors (You can tell which parts she left for, lol)

By what margin will Bob Shamansky win?

View Results

Loading ... Loading ...