5-7-6 PA Gop compromise/fair districts

I made a map with two goals. They were:

1.) Keep cities together, and if possible, counties

2.) Make the district without care for partisanship

Philadelphia is the only city in more than one cd, and only four counties have 3 or more cds in them (Allegheny, Philadelphia, Chester, and Montgomery. 4 out of 69 aint bad, considering that Philadelphia has to be.)

There is high upside here for both parties, and this is a decent compromise, although more favorable to the republicans. It comes down to if you believe 2008 or 2010 is the closer to reality.

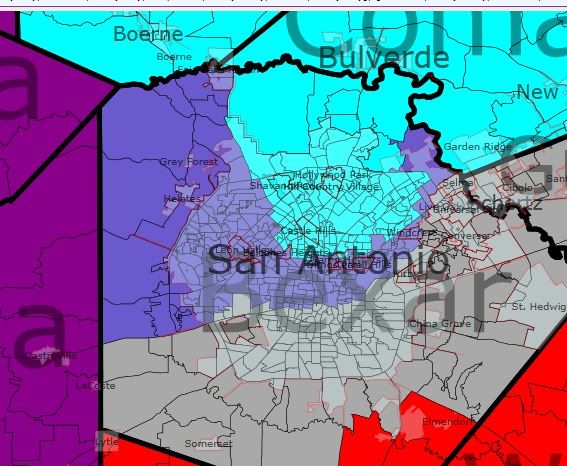
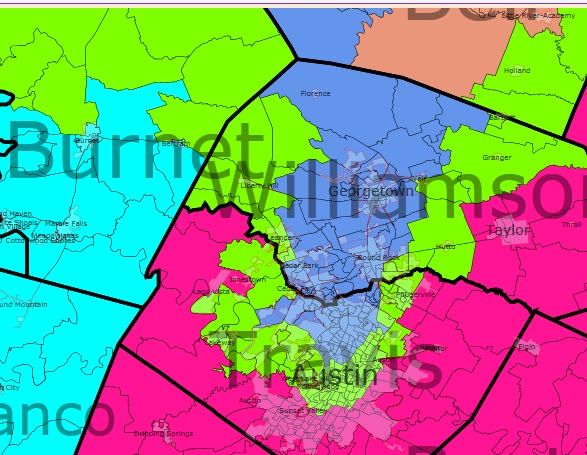
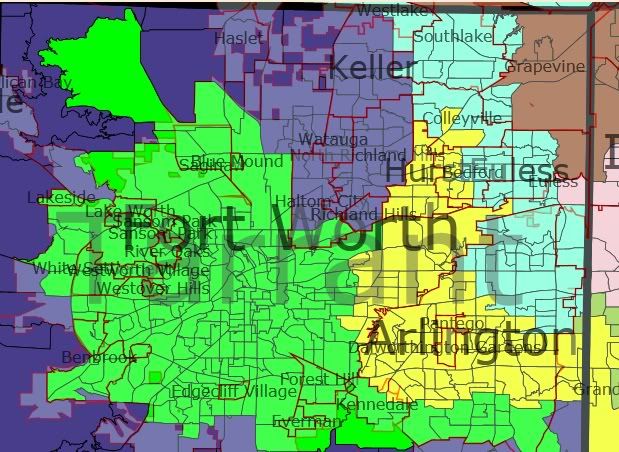
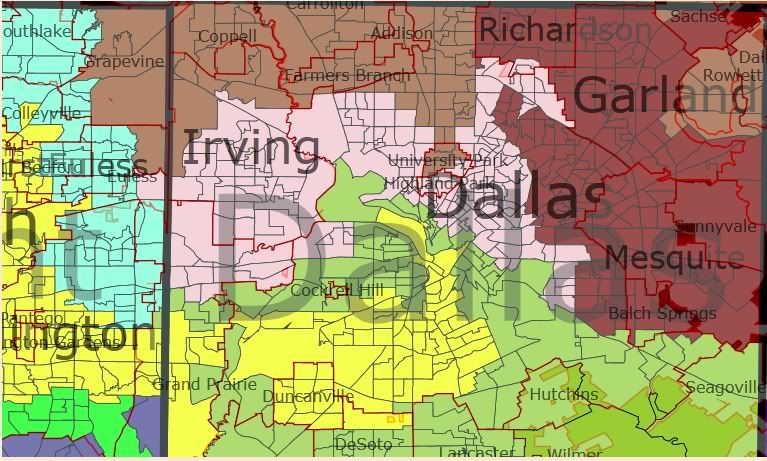
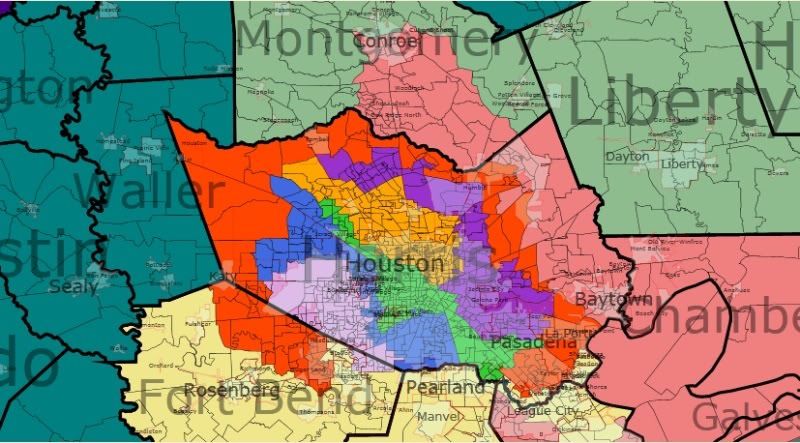
I really only think one picture is necessary due to the nature of this exercise. If anyone wants a zoomed view, lemme know. All are under 1000 off the ideal population.

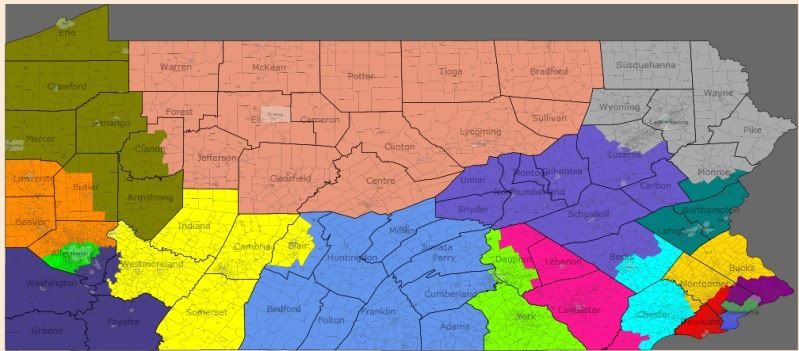
District 1 (Blue): 53% Black, 88% Obama

Entirely Philadelphia. Safe as could be. 1-0-0

District 2 (Green): 36% B, 14 Hispanic, 5 Asia, 80% O

Entirely Philadelphia. Safe as could be. 2-0-0

District 3 (Dark Magenta): 58% O

North-East Philly, and parts of Montgomery and Bucks. Leans very D. 3-0-0

District 4 (Red): 61% O

Delco and a part of montco. Likely D. 4-0-0

District 5 (Gold): 54% O

Rest of Montgomery and Bucks, plus a tiny bit of chester. Toss-up, Leans slightly R. 4-0-1

District 6 (Teal): 56% O

Bethlehem, Allentown, Easton and their counties, plus a bit of monroe. Toss-up, Leans slightly D. 4-0-2

District 7 (Dark Grey): 56% O

Scranton, Wilkes-Barre and the surrounding area. Toss-Up, Leans slightly D. 4-0-3

District 8 (Slate Blue): 53% M

A few small cities (Hazelton, Bloomsburg, Pottsville), but a lotta empty area. Likely R. 4-1-3

District 9 (Cyan): 55% O

Reading, the rest of Berks and a huge part of chester county. Pure Toss-Up 4-1-4

District 10 (Deep Pink): 56% M

Lancaster, Lebanon and space. Likely R. 4-2-4

District 11 (Chartreuse): 51% M

Harrisburg and York. Lean M. 4-3-4

District 12 (Cornflower Blue): 63% M

Not a lot going on here. Safe R. 4-4-4

District 13 (Dark Salmon): 54% M

North PA. Surprised it is this close tbqh. Likely R. 4-5-4

District 14 (Olive): 49% O (Wins by about 600 votes).

Erie. Toss-Up, Leans R. However, I think obama underperformed what a congressional D could do here so i’m counting it in the toss-up.  4-5-5

District 15 (Dark Orange): 55% M

North of Pitt. Likely R. 4-6-5

District 16 (Lime): 64% O

Pittsburgh. Safe D. 5-6-5

District 17 (Dark Slate Blue): 50% O

South of Pitt. Toss-Up, Leans R. 5-6-6

District 18 (Yellow): 56% M

The rest, includes Altoona. Likely R. 5-7-6.

Not the best either side could do, but most definitely fair. Both sides have reason to believe they could win a lot of the toss-ups. I hope the gopers believe that anyways. Well, lemme know.

36-0 Texas

The hardest thing for me to remember when making GOP friendly gerrymanders is that a 50% John MctCain district isn’t a toss-up but a likely R district, similar in theory to a 60% Obama District. 5 points more friendly to the gop then the nation as an average implies that, but it is somewhat tricky for me, at least, to wrap my mind around it. However, that was my goal when I started North Carolina: create as many districts that went GOP in 08 as possible. After getting an 11-2 in a state that went for Obama, i figured a 36-0 in Texas was possible. and it was. One district voted for Obama by less than 1000 votes, so I’m going to count it. A 59% Obama district would be okay for most of us here… Without further ado, MAPS!

As always, ask me and i will provide a zoomed in map of whatever area you wish if it isn’t clear from the big one.

http://img.photobucket.com/alb…

http://img.photobucket.com/alb…

El Paso: http://img.photobucket.com/alb…

District 1 (Blue):  Mccain 56%, 56% Hispanic

El Paso and Odessa

District 2 (Green): M 53%, 63% H

Rest of El Paso and some nearby counties

San Antonio and Austin: http://img.photobucket.com/alb…

District 3 (Purple): M 50%, 60% H

South San Antonio

District 4 (Red): M 51%, 50% H

North and West Antonio

District 5 (Yellow):  M 51%, 40% H, 10% Black, 3% Asian

East and North San Antonio

District 6 (Teal): M 50%, 72% H

Laredo and some Border counties, then up to West Texas

District 7 (Gray): M 50%, 66% H

McAllen and Border areas all the way up to Bastrop and Fayette Counties

District 8(Violet) M 51%, 62% H

Brownsville, Mcallen and then up.

District 9(Sky Blue): M 51%, 59%  H

Brownsville, Harlingen, up to Williamson and Milam counties.

District 10 (Pink):  M 50%, 35% H, 16% B, 3% A

Corpus Christi and up

Houston:  http://img.photobucket.com/alb…

District 11 (Lemon-Lime Green): M 55%,  55% White

South of  Houston

District 12 (Blue-Line Green) :  M 56%, 22% H, 20% H, 11% A

Some of the south-west of Houston and then surroundin areas.

District 13(Light Brown): M 53%, W 52%

Houston and some areas north

District 14(Gold):  M 57%,  W 61%

Houston and some areas north

District 15 (Orange): M 52%, 32% H, 19% B, 4% A

South of Houston, with a bit of the city

District 16(Lime Green):  M 52%, 39% H, 12% B, 4% A

Houston and Areas East

District 17(Navy blue): M 52%, 41% H,  16% B

Houston and Areas North East

District 18 (Golden Yellow):  M 56%, 56% W

North of Houston

District 19 (Puke Green): M 56%, 65% W

Wraps around 11-17

District 20 (Light Pink): M 52%, 59% W

Wraps around Austin and takes part of the city then to Abilene

District 21 (Blood Red): M 54%, 66% W

Parts  of Austin then  going to sparsely populated Northern Texas

District 22 (Poo Brown):  M 51%, 79% W

Austin and North Texas

Dallas-FW: http://img.photobucket.com/alb…

District 23 (Robin’s Egg Blue): M 54%, 57% W

Dallas and some northern suburbs

District 24 (Dark Purple):  M 56%, 59% W

Dallas and Some Eastern areas

District 25 (Rose): M 54%,  59% W

Dallas then to some less populated eastern areas

District 26 (Silver) M 58%,   54% W

Dallas, FW, then to North Texas

District 27 (Sea Green) M 49%, 54% W

Dallas, FW, then to North Texas

District 28 (Pinkish Purple) M 60%, 57% W

Irving, then up to North Texas

District 29 (Gray Green): M 53%, 60% W

Waco and Forth Worth

District 30 (slightly lighter shade of rose then

the one touching it): M 55%, 60% W

Parts of Arlington, Dallas and Fort Worth

District 31 (Tan): M 61%, 71% W

North Fort Worth and Dallas then North

District 32 (Red Orange): M 64%, 79% W

North FW and then northern areas surrounding it

District 33 (I can’t name that many different shades of blue): M 63%, 80% W

North of Dallas

District 34 (Somewhat dark-green): M 69%, 75% W

Wraps around a lot of other districts, filling in a lot of gaps

District 35 (Royal Purple): M 62%, 64% W

Everything Else Part 1

District 36 (Not Flyers Orange, but I’m using it anyways): M 68%, 69% W

Everything Else, Part 2

This is not a perfect 36-0 Map. The last 5-6 districts could bleed some republican voters to some of the more borderline districts. However, in an ok to good year, the republicans win all 36 seats barring an exceptional democratic candidate.

Dave’s seems to have deleted my other maps. I’ll redo them later and either edit this diary or do a new one, depending on what you guys thing.

Texas dem redistricting

Had a whole write up posted but it got deleted. No comments this time but you guys know the deal by now. Its a 17-16-3 Democratic gerrymander.

http://img.photobucket.com/alb…

http://img.photobucket.com/alb…

El Paso: http://img.photobucket.com/alb…

District 1 (Blue) 54 Obama 66 Hispanic

El Paso and Odessa

Lean/Likely D

District 2 (Green) 57 O 72 H

El Paso and tentacles

Likely D

District 3 (Purple) 56 O 78 H

Mexican Border and some other counties

Likely D

District 4 (Red) 55 0 74 H

Mexican Border and it snakes up

Lean/Likely D

District 5 (Yellow) 55 0 72 H

Mexican Border and Corpus Christi

Likely D

District 6 (Teal) 34 O 59 White

Counties that border the Gulf of Mexico and going inward.

Safe R

San Antonio: http://img.photobucket.com/alb…

District 7 (Gray) 55 O 58 H

Southern San Antonio and surrounding areas

Likely D

District 8 (Lilac Purple) 54 O 54 H

Middle of San Antonio and some other parts of Bexar county.

Lean/Likely D

District 9 (Sky Blue) 33 O 69 W

Northern San Antonio and its conservative suburbs and exurbs.

Safe R

Austin: http://img.photobucket.com/alb…

District 10 (Bright Pink) 55 O 57 W

Austin and its suburbs

Likely D

District 11 (Lime Green) 54 O 63 W

Austin

Lean/Likely D

District 12 (Periwinkle) 53 O 67 W

Austin and Killeen

Lean D

District 13 (Burt Sienna) 31 O 74 W

Waco, Temple and empty spaces

Safe R

District 14 (Gold) 25 O 66 W

A lot of space and part of lubbock

Safe R

District 15 (Orange) 25 O 66 W

More Nothing.

Safe R

Fort Worth: http://img.photobucket.com/alb…

District 16 (Kelly Green) 52 O 51 W

Surprisingly Conservative Fort Worth

Toss-Up

District 17 (Navy Blue) 30 O 84 W

Suburbs of Fort Worth

Safe R

Dallas: http://img.photobucket.com/alb…

District 18 (Golden Yellow) 59 O, 30 Black 19 Hispanic 5 Asian

Dallas

Safe D

District 19 (Puke Green) 54 O, 22 Black 27 Hispanic 2 Asian

Dallas and a few southward counties

Likely D

District 20 (Rose) 55 O, 39 Hispanic 14 Black 6 Asian

Dallas and Irving

Likely D

District 21 (Blood Red) 50 O, 54 W

Dallas  and surrounding areas

Toss-Up

District 22 (Poo Brown) 39 O 72 W

North of Dallas and FW

Safe R (Winnable with a great candidate in a good year or an incumbent in an ok one, but tilts very r)

District 23 (Robin’s Egg Blue) 35 O 75 W

North of FW to OK border

Safe R

District 24 (Dark Purple) 29 O 72 W

Wraps Around 19, 13 to the end of 11

Safe R

District 25 (Salmon)  35 O, 79 W

North Of Dallas

Safe R

District 26 (Dark Gray) 33 O, 77 W

Between OK Border and 24

Safe R

District 27 (Seafoam Green)31 O 72 W

Along the LA Border

Safe R

Houston: http://img.photobucket.com/alb…

Note: I made a small error here in the large map. It is fixed in the numbers and in the close–up of houston (part of the district didn’t connect)

District 28 (Really Light Purple) 58 O  28 Black 13 Asian 26 Hispanic

Southwest Houston

Safe D

District 29 (Sage Green) 33 O 73 W

Northeast of Houston

Safe R

District 30 (Pinkish-Red near houston) 33 O 70 W

Wraps Around Houston

Safe R

District 31 (Pale Yellow) 39 O, 61 W

South of Houston

Safe R (See District 22)

District 32 (Bright Red) 37 O, 66 W

Wraps even closer around Houston then does 30

Safe R

District 33 (Denim Blue) 56 O, 24 B 7 A 28 H

Houston

Likely D

District 34 (Green in Houston) 51 O, 12 B 6 A 34 H

Houston

Toss-up

District 35 (Purple in Houston) 53 O, 16 B 3 A  43 H

North Houston

Lean D

District 36 (Orange in Houston) 62 O, 26 B 42 H

Southeast Houston riding up to Northwest Houston

Safe D

What I think makes this most effective is that the Democratic districts will only get more liberal over the Decade, cementing the safety of Incumbents and helping unseat any republicans who manage to pull an upset or win a toss-up.

Please reply, this took a while 🙂

And a big thank you for my girlfriend for help with the names of colors (You can tell which parts she left for, lol)

By what margin will Bob Shamansky win?

View Results

Loading ... Loading ...