Democratic Gerrymander of Austin – GOP smackdown

Everyone who gerrymanders knows about the infamous GOP cracking of Austin during the GOP gerrymander of Texas.  If the Democrats magically got control of the state House, state Senate and Governorship they would be out for blood over the GOP mid-decade gerrymander

Time for the GOP’s turn to cry over a gerrymander of Austin!

CD-10

Obama 59%

McCain 40%

White 55% Black 6% Hispanic 35%

Since Doggett’s District has grown by over 120,000 people in the past 10 years it has been easy to make it more compact by removing several of the conservative counties, some of Austin was also removed to make room for the other districts.  Austin comprises the majority of the population, but San Marcos and Seguin are also in the district.  The PVI remains the same as Doggett’s old district.  If he can win with an 8 point margin in one of the worst years for Democrats in decades this new district should be no problem.  

Safe Democrat

CD-33

Obama 60%

McCain 39%

White 65% Black 8% Hispanic 20%

Clearly most of Austin is in this new district.  It is 2 points more Democratic than Doggett’s district and includes Round Rock and Georgetown in addition to the majority of Austin.  Again the massive population growth in Austin made this district possible.  Not much else to say on this one.

Safe Democrat

CD-31

Obama 56%

McCain 43%

White 52% Black 21% Hispanic 21%

As if two safe Democratic districts weren’t bad enough a third district including parts of Austin, Waco, Killeen/Temple and College Station/Bryan.  This is the crown jewel of this gerrymander.  This district is beautifully drawn for one reason, to get the GOP angry. I couldn’t quite make this district Democratic enough to be a safe Democratic Seat, but it is definitely winnable, toss-up at worst and lean D at best.

Lean D/Toss-Up

Post-mortem on the Slaughter – Who won and lost where?

66 seats previously held by Democrats in the House of Representatives fell to the Republicans. Open seats accounted for 14 losses and incumbents accounted for 52.

LA-03 (Open – Melancon)

TN-06 (Open – Gordon)

NY-29 (Open – Massa)

AR-02 (Open – Snyder)

KS-03 (Open – Moore)

IN-08 (Open – Ellsworth)

TN-08 (Open – Tanner)

WI-07 (Open – Obey)

PA-07 (Open – Sestak)

AR-01 (Open – Berry)

MI-01 (Open – Stupak)

WA-03 (Open – Baird)

NH-02 (Open – Hodes)

WV-01 (Open – Mollohan)

PA-03 (Dahlkemper)

FL-08 (Grayson)

OH-01 (Driehaus)

OH-15 (Kilroy)

TX-17 (Edwards)

FL-24 (Kosmas)

IL-11 (Halvorson)

CO-04 (Markey)

FL-02 (Boyd)

NH-01 (Shea-Porter)

WI-08 (Kagen)

GA-08 (Marshall)

NV-03 (Titus)

MD-01 (Kratovil)

PA-11 (Kanjorski)

VA-05 (Perriello)

OH-16 (Boccieri)

VA-02 (Nye)

SC-05 (Spratt)

MS-01 (Childers)

AZ-01 (Kirkpatrick)

NM-03 (Teague)

ND-AL (Pomeroy)

AZ-05 (Mitchell)

SD-AL (Herseth Sandlin)

IL-14 (Foster)

PA-10 (Carney)

NY-19 (Hall)

IL-17 (Hare)

CO-03 (Salazar)

PA-08 (Murphy)

IN-09 (Hill)

AL-02 (Bright)

ID-01 (Minnick)

NJ-03 (Adler)

FL-22 (Klein)

TX-23 (Rodriguez)

OH-18 (Space)

TN-04 (Davis)

MO-04 (Skelton)

MI-07 (Schauer)

NY-20 (Murphy)

VA-09 (Boucher)

OH-06 (Wilson)

MS-04 (Taylor)

NY-24 (Arcuri)

IL-08 (Bean)

NC-02 (Etheridge)

MN-08 (Oberstar)

TX-27 (Ortiz)

NY-25 (Maffei)

NY-13 (McMahon)

Now, what interested me was where these people lost and indeed, where did people survive?

Seats lost with a GOP PVI (52):

TX-17 R+20

MS-04 R+20

ID-01 R+18

AL-02 R+16

MS-01 R+14

MO-04 R+14

MD-01 R+13

TN-06 R+13

TN-04 R+13

LA-03 R+12

VA-09 R+11

GA-08 R+10

ND-AL R+10

SD-AL R+9

WV-01 R+9

PA-10 R+8

AR-01 R+8

IN-08 R+8

SC-05 R+7

OH-18 R+7

CO-04 R+6

NM-02 R+6

AZ-01 R+6

IN-09 R+6

FL-02 R+6

TN-08 R+6

VA-05 R+5

VA-02 R+5

C0-03 R+5

AZ-05 R+5

AR-02 R+5

NY-29 R+5

OH-16 R+4

NY-13 R+4

TX-23 R+4

FL-24 R+4

NY-19 R+3

PA-03 R+3

KS-03 R+3

MI-01 R+3

NY-20 R+2

NY-24 R+2

MI-07 R+2

FL-08 R+2

TX-27 R+2

NC-02 R+2

OH-06 R+2

IL-14 R+1

NJ-03 R+1

IL-11 R+1

IL-08 R+1

NH-01 R+0

In these hyper-partisan times even multi-term incumbents couldn’t hold on in the terrible environment despite having done so easily in the past.

Seats retained with a GOP PVI (17):

UT-02 R+15 (Matheson)

OK-02 R+14 (Boren)

KY-06 R+9 (Chandler)

AR-04 R+7 (Ross)

NC-11 R+6 (Shuler)

PA-04 R+6 (Altmire)

PA-17 R+6 (Holden)

WV-03 R+6 (Rahall)

MN-07 R+5 (Peterson)

NC-07 R+5 (McIntyre)

AZ-08 R+4 (Giffords)

IN-02 R+2 (Donnelly)

NC-08 R+2 (Kissell)

CA-11 R+1 (McNerney)

MN-01 R+1 (Walz)

NY-23 R+1 (Owens)

PA-12 R+1 (Critz)

These select few deserve kudos for surving.

Seats lost with a Dem PVI (14):

WA-03 D+0

WI-08 D+0

OH-01 D+1

OH-15 D+1

FL-22 D+1

NV-03 D+2

NH-02 D+3

PA-07 D+3

WI-07 D+3

NY-25 D+3

PA-08 D+3

IL-17 D+3

MN-08 D+3

PA-11 D+4

Proof positive that the wave was not confined to traditional Republican territory.

Republican seats with a Dem PVI (20):

WA-03 D+0

WI-08 D+0

FL-22 D+1

NJ-02 D+1

OH-01 D+1

OH-12 D+1  

OH-15 D+1

NV-03 D+2

PA-08 D+2

PA-15 D+2

IL-17 D+3

MN-08 D+3  

NH-02 D+3  

NY-25 D+3

PA-07 D+3

WA-08 D+3  

WI-07 D+3

PA-06 D+4  

PA-11 D+4

IL-10 D+6

Obviously redistricting makes this more difficult but there are some juicy targets here for Dems to go on the offense.

Seats lost that voted for Obama (30):

VA-02

TX-23

KS-03

NY-19

MI-01

NY-20

FL-08

MI-07

NY-24

NC-02

TX-27

WI-08

IL-14

IL-11

IL-08

NJ-03

NH-01

WA-03

OH-15

FL-22

OH-01

NV-03

PA-08

WI-07

MN-08

NY-25

NH-02

IL-17

PA-07

PA-11

Obama won big so it was to be expected that some of these districts would slip back.

Seats lost by incumbents that voted for Kerry (6):

NY-25

IL-17

PA-08

FL-22

MN-08

PA-11

The most disappointing group of losses in my mind.

The Myth of Anti-Incumbent Elections Part I: 2006 elections

Cross-posted at Politics and Other Random Topics

A little while back, ThinkProgress’s Matt Yglesias made a very good point about how it’s kinda weird that the media and many others are arguing that there is some sort of broad “anti-incumbency” mood going on in the country.

Yglesias writes:


There’s something inherently odd about the concept of an anti-incumbent wave in a country wherein the overwhelming majority of incumbents are invariably elected. In the 2008, for example, 23 House incumbents were defeated in an unusually eventful election. A year in which “only” 75 percent of incumbents running for re-election were successful result in a shockingly large amount of change in the House. Indeed, I think everyone regards such a scenario as wildly unrealistic. And yet it would be hard to describe a universe in which 75 percent of incumbents are re-elected as all that gripped by anti-incumbent sentiment.

The interesting thing is that both 2006 and 2008 are largely seen as being both anti-Republican and anti-Incumbent (2008 moreso than 2006), but by absolute numbers, the number of incumbents who lost and the number of seats where the incumbent party switched are actually pretty low. A lot of people might be asking the obvious question; how can you say that 2006 and 2008 weren’t extremely anti-incumbent? After all, those two years saw the House, the Senate, and the Presidency switch from the Democrats to the Republicans. Before delving further, I’m not saying that the most recent elections weren’t extremely significant and that there wasn’t a massive change in control of government, but I am saying that this did not happen because incumbents had been thrown out left and right (especially in the House of Representatives). I’m going to work on a series which involves looking at the last two elections (both of which were Democratic wave elections) to try and give some perspective to the “anti-incumbent” myth which pervades the House of Representatives.

(I’m going to insert the charts a bit later in this post, for now, just follow the cross-posted link, that will give you the pictures)

So, how well did incumbents (and incumbent parties) fare in 2006? According to the electoral compilation site The Green Papers, in the 2006 House elections, there were 390 incumbents running in the general election. Of those 390 incumbents, 22 lost their bid for re-election, of 435 seats, 31 seats were not held by the incumbent party (1 belonging to now-Senator Bernie Sanders (I-VT)).  Roughly 94% of incumbents who were renominated by their parties ultimately went on to win the election. When including all seats, 368 incumbents won re-election to the House of Representatives out of 435, which means that the 110th congress started out being made up of 85% of members who had served in the previous congress. Looking at the seats in which the incumbent party retained control of the seat they had before the election, that number is 404 out of 435 seats, or roughly 93% of all seats (meaning only 7% of seats switched control in 2006).

If we look at it from the perspective of the two parties, there were 202 Democratic incumbents, 232 Republican incumbents, and 1 independent incumbent. Of the 202 Democratic incumbents, 186 got their party’s nomination, and all of them won re-election (or 100% of all Democratic incumbents who were re-nominated won re-election). Of the 233 seats the Democratic party won after the elections, roughly 80% of those would be held by an incumbent member. Looking at the Republicans, out of 232 incumbents, 204 of them were successfully re-nominated and of those who were re-nominated, 182 won won re-election (or roughly 89% of those running for re-election). Of the 202 seats the Republican party won after the elections, roughly 90% of them were held by were held by incumbents.

Some of you might be asking why I’m not talking about incumbents who lost their primaries? After all that might skew these numbers. The reason is pretty simple, only 2 incumbents who sought re-nomination lost their bids (Republican Joe Schwarz (MI-07) and Democrat Cynthia McKinney (GA-04). That means that over 99% of incumbents who sought re-nomination by their party were successful (all the primaries haven’t ended yet yet, but 2010 appears to be heading in that direction again).

One might argue that 2006 wasn’t really an “anti-incumbent” year so much as it was an “anti-Republican” year (not even necessarily an anti-Republican incumbent year) but even granting that, it’s still pretty telling that what many considered to be a giant wave election, when only 7% of all seats (13% of all Republican seats) changed party hands. This should give a little more insight into American elections.

Next time: the 2008 House races.

Polarization: Past and Present

A number of commentators have lamented increasing polarization in Washington. Conventional wisdom has it that America is as divided and partisan as it ever has been. Sectional divisions are tearing this country apart and preventing problems such as the deficit from being addressed; the differences between blue America and red America, in this view, are rapidly approaching crisis point.

There is some justice to this view. Polarization has probably increased, by a number of metrics, over the past few elections. Indeed, I previously noted something to this exact effect.

Let’s take another look, however, at the hypothesis, using a different type of measurement. Do blue states elect Republican representatives, and vice versa? In a polarized nation, this would probably not be the case.

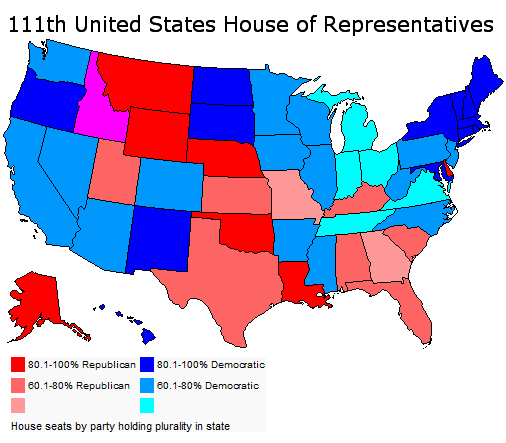
Here is the House today:

Polarization: Past and Present

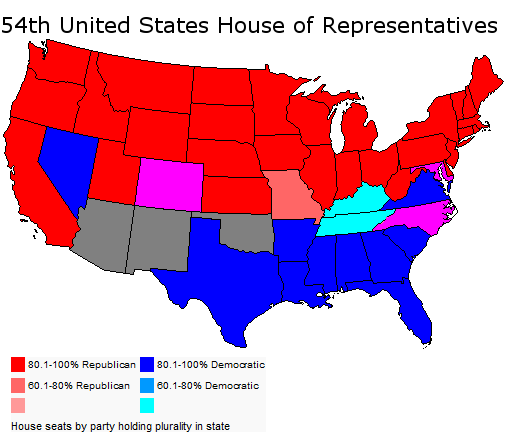
Here is 1894:

Polarization: Past and Present

As this stark contrast illustrates, perhaps polarization ain’t so bad as it used to be.

More below.

The 2008 image is a fascinating map in that it almost perfectly matches the 2008 electoral college. One sees the Republican corridor of strength in the South and Mountain West. Most of the map is blue since Democrats have a 255-178 majority, the result of two previous Democratic landslides.

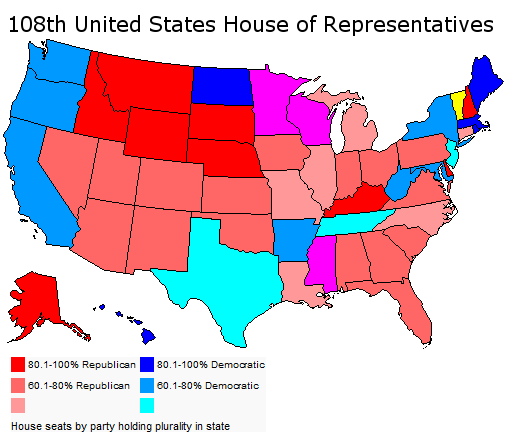
Here is a map of a House with a Republican majority:

Polarization: Past and Present

This House was the result of 2002 congressional elections. Republicans had done well in the wake of 9/11, and they had a 232-201 majority.

In the map there are relatively few states with 80-100% of representatives from one party. Blue states elect Republicans; red states elect Democrats. Moreover; for some states (e.g. Delaware, the Dakotas) it is mathematically impossible to be less than 100% Democratic or Republican.

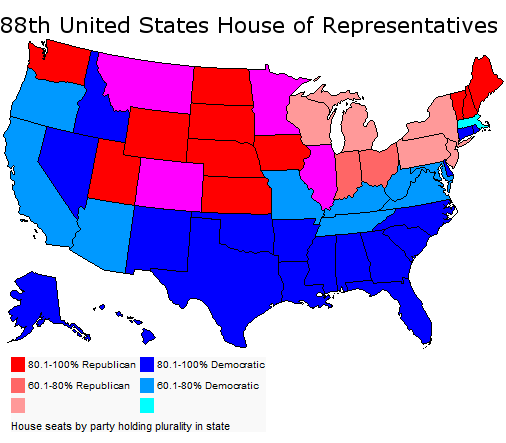
Let’s move back several decades:

Polarization: Past and Present

The date is 1960; President John Kennedy has just been elected. Democrats hold a 258-177 majority, almost identical to that today.

There are a lot more “one-party states” compared to the current map. Sectional division is far more pronounced; there is a line between North and South that simply does not exist in today’s House. In 1960 – especially in the still-standing Solid South – blue states generally did not elect Republicans, and vice versa.

Polarization grows even worse if one goes back further. Here is 2002, once again:

Polarization: Past and Present

Here is 1894:

Polarization: Past and Present

Republicans have just won 130(!) seats. They hold a 254 to 93 majority.

In this incredible map, there are only six states with congressional delegations less than 80-100% from one party. In it one can literally trace the battlefields of the Civil War.

This is real polarization, the results of a nation so divided it had literally torn itself in two. This is the type of polarization that results from scars so deep that they took more than a century to heal.

Perhaps today America is indeed growing more polarized, more divided into red states and blue states. But when one compares the present situation to past ones, there is literally no comparison. The United States has a long way to go before it gets as polarized as it did during the latter half of the 19th century.

–Inoljt, http://mypolitikal.com/

What is Charlie Cook Overlooking?

DC political prognosticator Charlie Cook is getting a lot of attention for his doom and gloom about Democrats’ chances this November. He has controversially asserted that health care reform is Barack Obama’s Iraq War and that the Democrats will likely lose the House.

It’s worth pointing out that other major political pundits don’t (yet) agree with Cook’s forecast; Larry Sabato and Stuart Rothenberg, for example, still see Republican gains in the House in the mid-to-upper 20s. Cook’s analysis can’t be totally dismissed, however. Congressional approval ratings, though always low, are scraping the bottom of the barrel. Democratic enthusiasm is hugely down, economic forecasts indicate slow job growth through the end of the year, and Obama’s approval rating is the second-lowest of any president at this point.

Moreover, young and minority voters are unlikely to turn out in large numbers; many, even if supportive of Obama and liberal-ish in their views, aren’t especially political and may treat the midterms with apathy. As Obama’s approval ratings are low with older voters and white voters, a turnout favoring them could well  deliver the GOP big gains.

Nonetheless, Cook’s analysis seems flawed to me. It’s not that Democrats couldn’t lose the House. And it’s not just the standard “a week is a lifetime in politics,” caveat. Rather, Cook seems to me to miss many mitigating factors, and I’m curious if others agree.  

First, I don’t think Cook accounts for the weakness of the GOP brand, which remains very low. It’s true that in an anti-incumbent year, Democrats will be the main losers as the party in power. But while large GOP gains aren’t out of the question, the voters’ low enthusiasm for the GOP seems to me to be a major hurdle. Hatred of the GOP could prove extremely potent in getting a higher proportion of Democratic-leaning voters to the polls. In 1994, pre-Newt’s speakership, surveys showed Democrats had relatively low disapproval of the Republican Party.

Second, I think Cook understates the potential for Democratic mobilization. Especially if Democrats can pass health care reform, they will likely at least stabilize their position with Democratic-leaners and have a concrete – and real – achievement to champion before the voters. Frankly, even without that, mobilization alone would shift turnout somewhat in their favor. And by all accounts, it appears that Obama will take a major personal stake in the midterms. This will be an all-out, nationalized campaign, and while there will be districts where that will be hindrance, revving up Democratic voters and convincing them to turn out and vote could well save several marginal seats.

Third, I think Cook underestimates Obama’s continuing popularity. There’s no doubt that Obama’s numbers have fallen, but the public still likes Obama personally by a heavy margin. And for all the talk of Democratic disillusionment, approval and enthusiasm for the president among Democratic-leaners remains extremely high. Comparisons with Bill Clinton are difficult, as Clinton’s approval ratings in early 1994 were actually quite high. But by the late spring of ’94, Clinton’s job and personal ratings were significantly down due to several big political defeats and the controversies over Whitewater. While Obama’s job approval ratings and personal favorability ratings could fall to the low 40s, I have a hard time seeing them doing so. And if Obama’s ratings are around 50% in November 2010 and if he maintains high personal approval ratings, it would add up to a less hostile climate for Democrats than they faced in 1994.

All of these factors suggest to me that Republican gains will likely top out at the mid-to-upper 20s or low 30s, in the House. And the potential is there, actually, for actual losses to prove smaller. Unless there is a double-digit recession, it is difficult (though, again, not impossible) for me to see Republicans picking up 40+ seats. If, as forecasted, we have at least some modest job growth, approval ratings for Obama around 50%, passage of health care reform and at least a few other popular items, and Democratic mobilization heavier-than-today, that points towards more modest losses than what Cook is forecasting.

In fairness to Cook, we’re in somewhat uncharted waters here. Neither 1994 or 2006 looked like wave elections this far out, although moderate gains for the opposition in both years seemed likely. In both years, voter anger grew and grew and didn’t peak prior to election day.

This year, the level of angst is present so early that it’s hard to predict what will over the coming months. It is entirely plausible that the seeming wave will crest. Democrats are aware of voter anger far earlier and for the GOP to look like they’re returning to power this early on may give time for wavering voters to have second thoughts. Alternately, the wave could build, which would indicate catastrophic losses for Democrats. Or it could remain roughly the same as it is today.

So do people agree? Disagree? Or is Cook right regardless of the factors I name?  

Fun with Utah, entertaining map

So Utah gains a seat, having no clue about Utah Politics I decided to make a district as ridiculously large as possible while keeping the deviation of population as low as possible.  I knew that most of the population in Utah was around Salt Lake City and the Provo area, but I had no idea it was that concentrated.

CD-01:  Blue deviates from the average district population with +7

CD-02:  Green deviates the least from the district average with -6 people

CD-03:  Purple deviates the most from the district average which is -26 people

CD-04:  I admit that the Red district is packed with people to make it larger.  +25 people from the district average :p

I think CD-04 may be geographically one of the largest not-at-large districts

2010 Texas Redistricting, a Democratic redistricting

After seeing all the great maps here I’ve decide to give it a try.  This is my first attempt at redistricting a state and my first diary.  While doing this for the first time I kind of wished I had lived in a smaller state, but Texas is where I grew up and where I live.  Since this is my first attempt at redistricting a state I want constructive criticism, but please be gentle 🙂 especially the long-time observers of Texas Politics because I am sure some of my commentary may be a bit off on some of the areas I am less familiar with.  I used Daves Redistricting App for this.  Please note I am not exactly familiar with the VRA law and how to apply it because I am new at this so if someone would like to critique this map for that it would be appreciated.

With Bill White running for Governor and the Democrats a few seats from the majority in the House, what would a Democratic Redistricting of Texas look like?

My goals for doing a Democratic redistricting of Texas were to

1.  Create at least two new Democratic seats in DFW

2.  Clean up Travis County

3.  Clean up Harris County, add another Dem seat.

4.  Work to weaken several GOP incumbents including Sessions and Culberson.

All districts have a +/- 2.5% population deviation from the average.  I will describe each group of district based on metro area or geographic location.

East Texas

CD-1 Largely consists of the currently existing CD-4.  Like most of rural Texas it is very white, very conservative. 71% White, 15% African American, 10% Hispanic  Safe R

CD-5 now includes Ellis County and the City of Tyler and is out of Dallas County entirely.  This new district has the potential for a very entertaining primary between Joe Barton, Louie Gohmert and Jeb Hensarling.  70% White, 10% African American, 16% Hispanic  Safe R

CD-6 which had a significant chunk of its population in the DFW metro area is now entirely rural.  69% White, 15% African American, 12% Hispanic.  Safe R

CD-17 although this district is in Central Texas it shows up good in the East Texas pic.  I am one of the people who remains amazed at Chet Edwards-D ability to hold on to his heavily GOP district.  Unsure of how to protect him I only have a few choices since his district gained population so Bosque, Somervell, Madison and Grimes Counties have been removed from his district.  Waco and Byran/College Station are still within CD-17  This district is probably still a Toss-up as Edwards will have to work hard to maintain this seat.  67% White, 9% African American, 19% Hispanic

Greater Houston Area (the Rural/Suburban districts)

CD-33 is a rural district which extends from greater Houston to Bastrop Country which is southeast of Austin  which is a solid GOP seat.  61% White, 11% African American, 25% Hispanic.  Safe R

CD-22 is now almost entirely contained within Fort Bent County with small pieces in Waller and West Harris County.  Obama barely lost Fort Bend County, and despite being a minority-majority district I think this seat stays GOP.  44% White, 17% African American, 24% Hispanic, 12% Asian  Likely R

CD-14 Ron Paul isn’t going anywhere.  56% White, 8% African American, 30% Hispanic.  Safe R

CD-08 contains north suburban Houston, the district is largely split between the fast growing Montgomery County and North West Harris County. 71% White, 5% African American, 16% Hispanic, 5% Asian.  Safe R

CD-02 Rural/suburban Houston contains Beaumont and Port Arthur.  62% White,, 18% African American, 15% Hispanic.  Safe R

Greater Houston (the Urban/Suburban districts)

CD-09 Now rests entirely within Harris County, other than a small extension to the west of CD-07 this district remains largely unchanged.  17% White, 32% African American, 36% Hispanic, 11% Asian.  Safe-D

CD-07 is now more Urban, it has essentially been shifted a big to the east which moves it a bit into south Houston.  The conservative west part of his district has been annexed by conservative CD-08.  46% White, 12% African American, 33% Hispanic, 5% Asian.  Leans D

CD-18 and CD-29 were both redrawn to undo the ugliness of the previous districts.  CD-18 15% White, 30% African American, 49% Hispanic.  CD-29 17% White, 14% African American, 65% Hispanic.  Both remain safe D.  

CD-35 Contains a good chunk of the currently existing CD-22 and is on the cusp of being a minority-majority district. 53% White, 10% African American, 29% Hispanic, 4% Asian  Lean R

Travis County (Austin)

CD-10 Contains most of Austin.  54% White, 6% African American, 32% Hispanic, 5% Asian,  Safe D

CD-25 At first I thought I drew a GOP leaning seat here but it may be a Dem leaning seat.  This district contains the remainder of Austin as well as Round Rock, Georgetown and Cedar Park.  If Dems organize well enough this could very well be a Dem held seat.  56% White, 9% African American, 27% Hispanic, 5% Asian.  Toss-up

Bexar County (San Antonio)

CD-21  This district is heavily Hispanic, much of this district is part of the former CD-23 and CD-20.  Ciro Rodriguez may opt to run here instead of CD-23 for reasons which will be clear when CD-23 is described. 29% White, 4% Black, 61% Hispanic  Safe D

CD-20  Central and South San Antonio, like CD-21 this district is heavily Hispanic. 30% White, 6% Black, 60% Hispanic  Safe D

South and Southwest Texas

CD-27 Remains largely unchanged, just tightened up because of the population increase in South Texas. 20% White, 2% African American, 75% Hispanic  Safe D

CD-15 Much of the Rio Grande Valley.  Safe D

CD-28 This guy extends from South San Antonio all the way down to Hidalgo county. 34% White, 6%, African American, 56% Hispanic  Safe D

CD-23 Laredo is back in this heavily Hispanic district.  82% Hispanic and 15% White makes this the most Hispanic district in the state.  

CD-16 In El Paso remains largely unchaged and is a bit more compacted.  Safe D

West and Central Texas

CD-13 A true West Texas district!  Contains the cities of Amarillo and Lubbock.  An interesting note about this district is that it is only 57% White, the remainder is 33% Hispanic and 5% African American.  I don’t know much about West Texas but I was expecting a much higher percentage of white folk.  However given the demise of the rural Democrats in Texas this district remains in the GOP hands.  Safe R

CD-19  Midland-Odessa and Abilene are the cities in this geographically huge district. 58% White, 5% African American, 33% Hispanic.  Safe R

CD-11  This one encompasses a lot of Lamar Smiths former CD-21.  San Angelo and part of New Braunfels make up this heavily GOP district.  Loving County which is also the least populous County in the Country is also here. 68% White, 2 % African American, 26% Hispanic.  Stonewall, the birth place of President Lyndon Johnson is in this district.  Safe R

CD-31  Another rural conservative district located in Central Texas. 64% White, 12% African American, 18% Hispanic.  Safe R

CD-04  Although this district is part of the DFW Metroplex it shows up nice on this image.  This district includes the northern parts of Denton and Collin County which are two of the fastest growing counties in the state.  At 78% White, 4% African American and 12% Hispanic this rural district is a GOP stronghold.  Contains Wichita Falls, Sherman and Denison, the later is the birthplace of President Dwight Eisenhower.  Safe R

DFW Metroplex

CD-36 This district which contains several Far North Dallas suburbs including McKinney, Allen, Frisco, Flower Mound and Denton is solid GOP all the way.  68% White, 7% African American, 17% Hispanic.  Safe R

CD-12  The C shape of this district obviously stands rightly for “conservative”.  The most conservative parts of Americas second largest conservative urban county are here.  Conservative parts of south and west Arlington, West and North Tarrant County lock up this district as a solid GOP seat.  Safe R

CD-26 Situated in Central Fort Worth extending out into south Fort Worth and west into Arlington.  The Democratic Party would lock this one up. 37% White, 21% African American, 37% Hispanic.  Safe Dem

CD-24 This guy straddles the Dallas-Tarrant County line and is in an area of Dallas and Tarrant County where local Democrats have been having a lot of success in state House races the past few cycles.  42% White, 14% Black, 34% Hispanic.  Lean D

CD-30  This was the sole Democratic Representative in DFW after the redistricting of 2003.  CD-30 does remain the most African American in the state, however the district now grabs the conservative enclave of Highland Park in near the center of Dallas county. 25% White, 38% African American, 32% Hispanic.  Safe D

CD-03  Another district where local Democrats have been having great success at winning State House Seats.  42% White, 16% African American, 33% Hispanic and 6% Asian.  I really want classify this seat as Lean D but I don’t think it is quite there yet.  Toss-up

CD-34  Now the “What…” moment will be answered regarding this creatively drawn district.  This district is drawn to strengthen the Democratic presence in CD-32 and CD-03 by moving a lot of the strong GOP north Dallas areas into a safe GOP seat with Plano.  CD-34 cuts straight down into Dallas County and ropes up University Park, a conservative enclave just north of Highland Park.  Plano is one of the most conservative cities in the country and is almost entirely within this district. 64% White, 7% African American, 12% Hispanic, 12% Asian  Safe R

CD-32  This majority Hispanic district is now ready for to be picked up by a Dem.  Heavily Democratic portions of south Dallas are included and heavily GOP sections of north Dallas are included in CD-34.  28% White, 11% African American, 54% Hispanic.  Likely D

By what margin will Bob Shamansky win?

View Results

Loading ... Loading ...

NY-23: Scozzafava running out of money

“Dede Scozzafava, the GOP nominee in a key upcoming House special election, is running dangerously low on campaign cash, according to several GOP sources familiar with her spending and fundraising.”

Interestingly the article goes on to say that the RNC has sent only two staffers and hasn’t contributed a cent to the race. Owens is outspending her 12-1. Even Hoffman has spent more. The NRCC is trying to make up the difference but even they have been overtaken by the DCCC.

“Despite a recent poll showing the GOP nominee with a 7-point lead over Owens, the spending disparity has many Republicans downbeat about her prospects.”

I have to say I’m surprised at this. You would think the RNC would be flooding cash into the district to try and get a clean sweep of all the big races on November 3. Politico suggests they are concentrating on the gubernatorial races but that seems dubious at best. Maybe they just don’t want her to win. I know I don’t.

http://www.politico.com/news/s…

UPDATE

The Rothenberg Political Report moves the race from Pure Toss-Up to Toss-Up/Tilt Democratic.

http://rothenbergpoliticalrepo…

Redistricting Louisiana

Using Dave’s Application, I have drawn a redistricting plan for Louisiana.  It appears that the state will be losing one seat in 2012, so the plan here has six seats.  There is currently only one Democrat in the entire delegation, and this plan aims to make that two or three Democrats, including two African-Americans.  I tried to make the map so districts are relatively compact, no parish is split among more than two districts, and altogether only 13 out of Louisiana’s 64 parishes are split at all.  

Louisiana’s legislature is currently Democratic controlled, although it may switch to GOP or divided control by 2012.  The governor is a Republican.  Nevertheless, the state is about 1/3 black, and so out of 6 seats, two should ideally be represented by an African-American.  With preclearance and VRA requirements, it may indeed be possible to draw a plan such as this and the Obama DOJ may even aim at making such a plan mandatory (even if state government control was all in GOP  hands).  Even with a huge loss of population in New Orleans, two relatively compact African-American Democratic seats centered on New Orleans (LA-2) and Baton Rouge (LA-6), respectively, are still quite feasible.  

The third possible Democratic seat, LA-4, would be in the northern part of the state (with GOP control, it would perhaps be hard to draw the seat this way, but if the legislature stays Democratic, it may be possible, especially because the seat as drawn is quite compact).  I must admit I am not that familiar with the intricacies of Louisiana politics, so perhaps this plan would not work at all, but I’m throwing it out there anyhow.

Photobucket

District 1 – blue

81% white; 9% black; 21% Obama; 78% McCain

Suburbs and exurbs of New Orleans and Baton Rouge, this district would become perhaps the most Republican congressional district in the country under this plan.

District 2 – green

50% black (50%+); 40% white; 66% Obama; 33% McCain

Due to large population losses following Katrina, this New Orleans based district has to necessarily expand geographically.  I make it go into areas south and west of the city, maximizing black and Democratic numbers.  The new district is less Democratic than the current one (which is 74% Obama) but whichever Democrat beats Cao in 2010 should have no trouble here come 2012.

District 3 – red

73% white; 18% black; 28% Obama; 70% McCain

This district includes a good part of “Cajun Country” in southern Louisiana as well as the eastern part of East Baton Rouge parish.  The new seat is heavily GOP.

District 4 – purple

55% white; 40% black; 44% Obama; 55% McCain

If Carmouche had run under these new lines, he would have very likely won last year, as the current district is only 40% Obama/59% McCain and Carmouche lost to Fleming by a couple hundred votes.  Whether Carmouche or another Democrat can win here in the future is another story, but the district might be competitive at some point in the next decade.

District  5 – teal

77% white; 17% black; 26% Obama; 73% McCain

The new 5th combines much of the current 5th and 7th districts in central and southwestern Louisiana, and should be a GOP stronghold under this plan.

District 6 – yellow

53% black; 42% white; 57% Obama; 41% McCain

This new district includes most of Baton Rouge and most areas bordering the state of Mississippi.  The current 6th is only 41% Obama/57% McCain and this plan flips those numbers around to 57% Obama/41% McCain.  The district is sufficiently Democratic and African-American to elect a black Democrat here.

So that’s my plan for Louisiana. I welcome your comments.

NY-23: Scozzafava leads 35-28-16

Five weeks from election day and Assemblywoman Dede Scozzafava (R) leads Bill Owens (D) by seven points with Doug Hoffman (C) trailing in the first independent poll of the special election to replace Army Secretary John McHugh in the House of Representatives for New York’s 23rd District.

The topline numbers from the Siena College Research Institute (LV, 9/27-29, MoE 3.9%) are:

Scozzafava 35%

Owens 28%

Hoffman 16%

http://www.siena.edu/uploadedf…

“This is a wide open race. One in five voters is currently undecided. Add to that the fact that one-third of Scozzafava’s current supporters and one-quarter of Owens’s current supporters say they are not very certain of their choice and that they very well may change their minds between now and Election Day.”

I think it fair to say this is a total tossup, particulary with the better known Scozzafava having such a small lead. I will update with more thoughts when I’ve poured over some of the internals.

UPDATE

Looking at the 2008 presidential race in the district we find Obama won Clinton, Essex, Franklin, Madison, Oswego and St. Lawrence counties. McCain carried Fulton, Hamilton, Jefferson, Lewis and Oneida.

The three-way makes it difficult to extrapolate but Scozzafava leads big in the West (which is where her Assembly district is located) matching McCain in Jefferson and Lewis counties but also in St. Lawrence where Obama won big.

On the contrary Owens leads in some of the central counties she represents and which McCain won, namely Madison, Oneiga and Oswego.

The good news is they are tied in places Obama won big – Clinton, Essex and Franklin. As andgarden mentions in the comments Obama is popular in the district so if people there get to know Owens and like what they hear I think there is a good chance he can take this one.

On the flipside McCain did well in Fulton and Hamilton so Owens is overperforming there though I suspect that has more to do with Hoffman taking conservative votes.

UPDATE 2

Favorables are interesting. Scozzafava clocks in at 33-20-47, favorable, unfavorable, no opinion. Hopefully Hoffman’s kamikaze act helps make people form a negative opinion.

Owens is at 23-12-64 so significantly more room to grow. Hoffman at 16-13-71.

Top issues, economy and health care, unsuprisingly, and the candidates are split.

McHugh’s endorsement would be key according to the numbers but if Obama comes out for Owens is it at all likely he will oppose his new boss? Interesting.