This diary presents an 18-seat map for Illinois. Illinois is a particularly difficult state for me to get my head around politically, so in this diary I am going to highlight a particular strategic approach to redistricting. I’m calling it “disincumbenting” — I don’t think I’ve encountered an existing term of art anywhere that covers quite the same ground.
The basic idea of disincumbenting is to make the new districts as unlike the current districts as possible. Doing so reduces the value of incumbency (hence the name) by reducing the number of constituents who are familiar with the incumbent representative.
Illinois strikes me as a particularly fertile environment for the technique, because the party out of power on the state level has a large number of contiguous seats. The Democrats have unified control over the line-drawing. In the most recent election, they lost four outstate districts, resulting in the Republicans controlling every non-Cook-County-based district except for Jerry Costello’s 12th district in the far southwest. (The Republicans also control the Cook-County-based 9th.) With so much adjacent territory under the control of the opposition party, it is fairly easy to draw new lines that wreak havoc on the political bases of each incumbent.
As I said above, I find it difficult to get my head around Illinois’ politics. This is because recent elections have been so very unrepresentative. 2010 was a Republican wave year. 2008 was a Democratic one, compounded by Obama’s favored son status. Blagojevich’s election numbers are impacted by the presence of a significant Green candidacy. And so on. I tried to design the new districts so as to maximize the number of “Democratic opportunity” districts outside of Cook County as best I could, but these districts aren’t as numbers-based as I would like. I welcome any feedback from those who know Illinois better.
Aside from the goals of disincumbenting Republican incumbents and maximizing Democratic chances outstate, I had two other, inter-related goals: create a second Hispanic majority seat in cook County, thereby eliminating Lipinski’s district. In a previous diary, I had created a second Hispanic seat by (inadvertantly) messing with Quigley. Geoneb suggested that Lipinski should be the target instead, so here’s a plan that does that. These two goals have an unintended spillover effect of somewhat disincumbenting the Chicago Democratic representatives. If resistance from the Democratic incumbents proves too great, these two goals could be abandoned.
To demonstrate the disincumbenting strategy, in my district descriptions I’m making use of silverspring’s Territory Transfer Percentage (TTP), introduced here. TTP is the percentage of the new district’s population that was part of the old district. My impression is that Silverspring introduced it with the general intent of keeping TTPs relatively high. Because of the set of goals I applied to the creation of this map, I’m actually trying to keep TTPs low (at least in the Republican districts.)
Pictures and descriptions of the plan start after the jump.
Overview Map
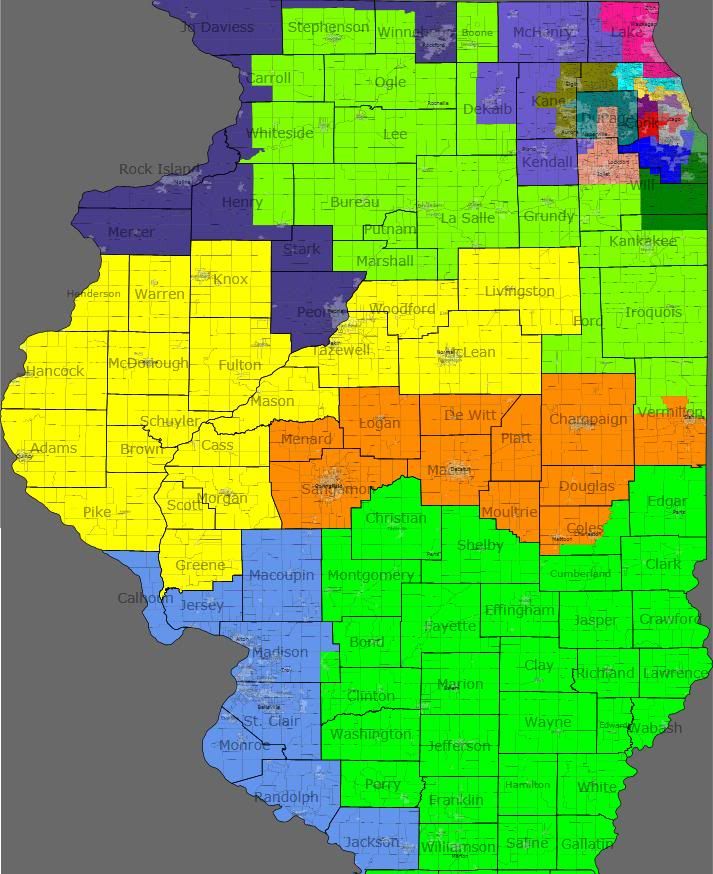
Note that the 16th is (roughly speaking) the seat lost through reapportionment. I relocated it south to cover for the missing number 19.
Chicagoland Map
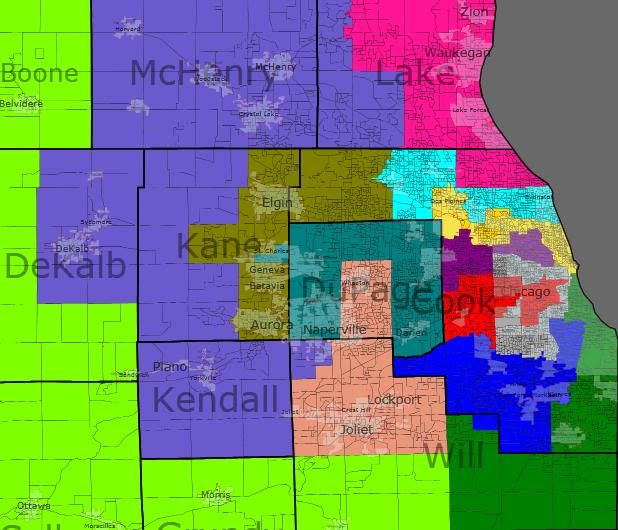
District-By-District
Given the strategy I’m following here, I’m presenting the old/new maps for each district. The pink outline is the old district. The green squiggles represent the new district.
Democratic Held Seats
My intention was that all of these seats would remain solidly Democratic. In the absence of sound numbers though, I’m slightly worried about the 9th. (And, I guess, the 12th — but I think I actually improved the 12th’s Democratic performance.)
District 1 — Bobby Rush (D)
VRA: B 53% W 35%
TTP: 49%
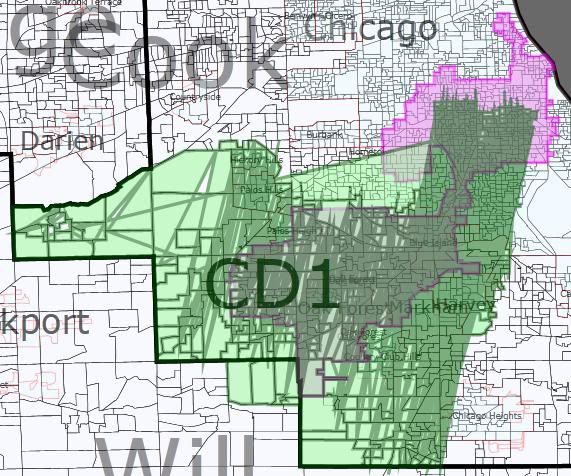
Rush’s district slides south somewhat, expanding into parts of what is currently the 2nd and 13th. I’m not sure if Rush still lives in this version of the district. Wikipedia says he used to represent the 2nd Ward. If he still lives there, it’s a relatively easy fix to swap some territory with the 2nd while keeping both majority African American.
District 2 — Jesse Jackson, Jr (D)
VRA: B 54% W 32% H 11%
TTP: 56%
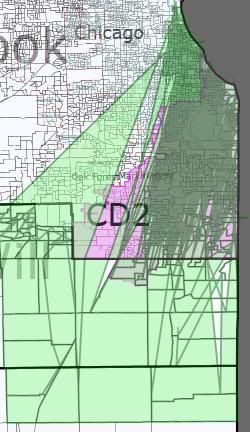
Jackson’s district narrows slightly to expand significantly to the north and south. Again, I’m not sure if Jackson lives here, but his wife represents the 7th Ward, so I think he probably does.
District 3 — Open Seat (D)
VRA: H 52%, W 34%
TTP: 2%
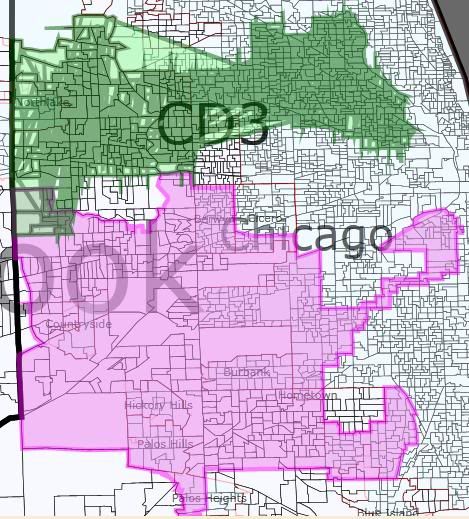
[Update: Per sapelcovits in the comments, my description of the ethnic background for the 3rd and 4th are flipped. This is Guiterrez’s district. It’s the 4th that’s open.]
This was Lipinski’s district, now almost entirely relocated to become a second Hispanic majority district. (The old district is split roughly evenly between the new 4th and 7th, both of which are still majority-minority.) My understanding is that the Hispanic population here is largely Mexican, so voting participation rates might not be enough to elect a Hispanic representative.
District 4 — Luis Guiterrez (D)
VRA: H 58%, W 35%
TTP: 51%
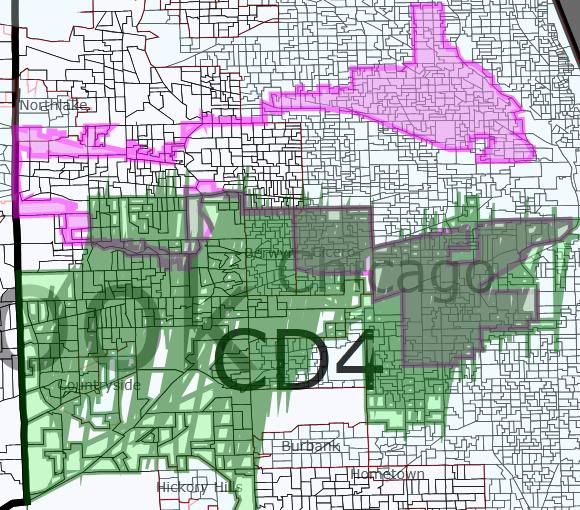
Guiterrez’s seat now takes in only the southern half of his old district (along with a good part of the old 3rd). My understanding is that the Hispanic population here is largely Puerto Rican (and therefore US citizens), so this district should pass VRA muster.
District 5 — Mike Quigley (D)
VRA: W 68%, H 15%
TTP: 53%
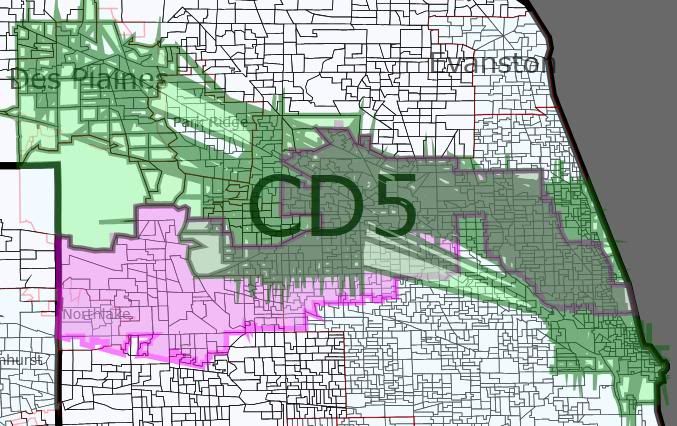
Quigley’s seat shifts northwest on its western end, now taking in Des Plaines instead of Northlake. I believe he should still live in the district; if not, the territory swap needed to make it happen shouldn’t be too difficult.
District 7 — Danny Davis (D)
VRA: B 50% W 34% H 11%
TTP: 50%
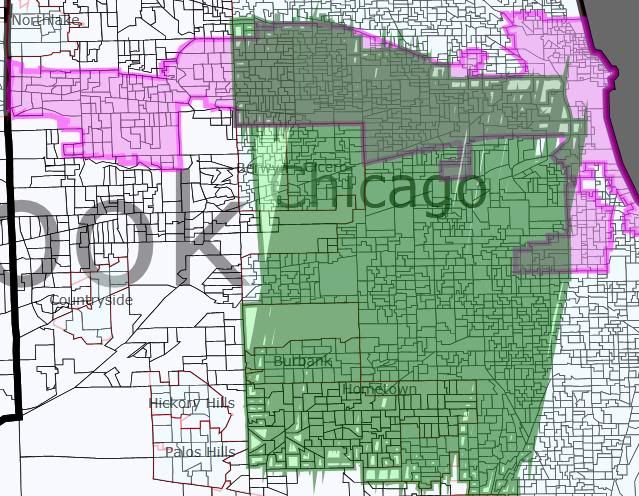
Sadly one of the less informative old/new maps. You might need to refer back to Chicagoland overview. Davis’s seat lurches south radically as part of the dismemberment of the old 3rd. The 29th Ward that he used to represent is still in the district, so I assume he is too. If 50% is too low an African-American percentage, some territory swaps with the 1st and/or 2nd could probably be arranged.
District 9 — Jan Schakowsky (D)
VRA: W 62% H 15% A 14%
TTP: 60%
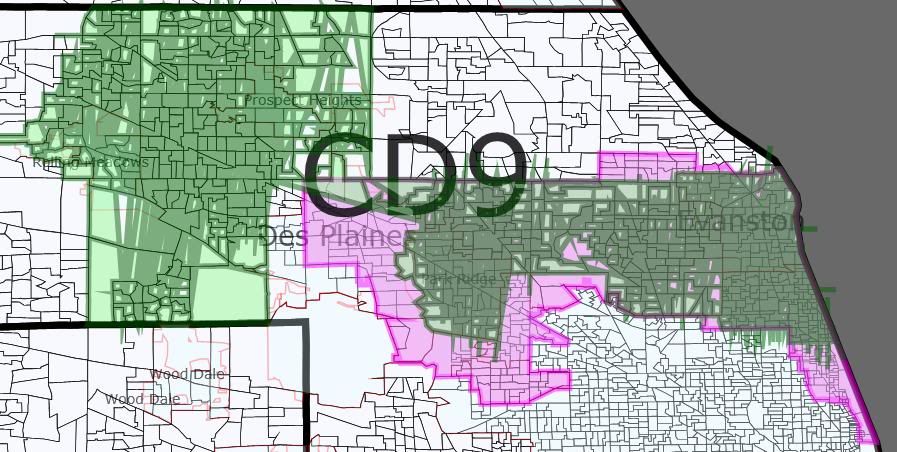
Schakowsky’s district stretchs significantly further west now. This is the only Democratic-held district I’m concerned about whether I weakened it significantly. Perhaps she and Quigley could swap Elk Grove for Des Plaines? (Is that even an improvement for her?)
District 12 — Jerry Costello (D)
VRA: W 80%, B 15%
TTP: 71%
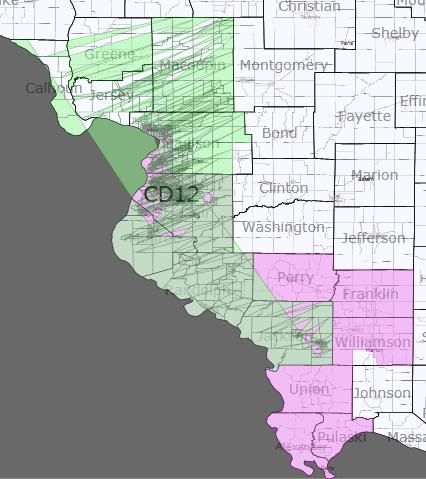
Costello’s district shifts north, and in doing so becomes more Democratic (I think.) One danger: I’ve technically drawn Shimkus into this district, but I’m assuming he’d run in what is now the neighboring 16th. I don’t think Shimkus is a problem (71% TTP for Costello!), but if he is, he could be drawn into the 16th properly. But I’m guessing that would require decreasing the 12th’s Democratic performance.
Republican Held Seats
Now the fun begins! Republicans, please met your new districts.
I have no firm idea what the Democrat’s chances in any of these districts are. I’m hoping that disincumbenting the Chicago suburban Republicans will make them vulnerable. Outstate from Chicagoland, I think I created two new districts that are at least competitive for the Democrats.
District 6 — Judy Biggert (R) vs Randy Hultgren (R)
VRA: W 71% H 14% A 10%
TTP: 55%
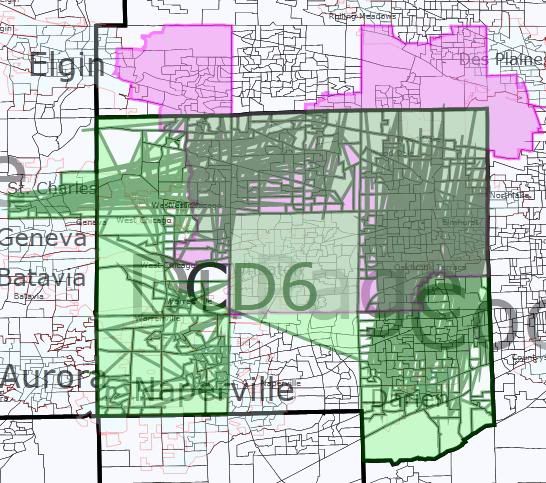
While remaining DuPage-based, the 6th now pairs the residences of two incumbent Republicans — neither of whom are the incumbent in the 6th! Its upside-down U-shape is to keep incumbent Peter Roskam’s hometown of Wheaton out of the district. The listed TTP is if Roskam ran here anyway. If Biggert ran here, her TTP would be 34%; for Hultgren, 11%.
District 8 — Joe Walsh (R)
VRA: W 82%, H 11%
TTP: 35%
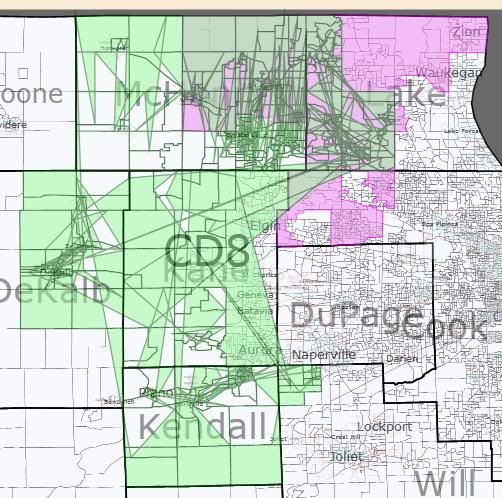
No longer stretching to Lake Michigan, Walsh’s seat now heads south into eastern Dekalb, western Kane, and Kendall Counties. Sadly, I suspect that this territory as at least as favorable to Walsh as his current one. Walsh would have nearly the same TTP if he ran in the new 10th at 30%. Representatives Manzullo and Hultgren would be at 28% and 29%, respectively, if they ran here — despite, you know, not living here.
As a side note, I believe Bean lives in my new 14th.
District 10 — Bob Dold (R)
VRA: W 67%, H 19%
TTP: 68%
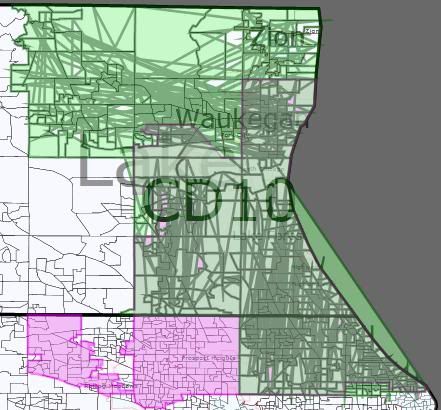
The GOP district I most failed to disrupt. Any suggestions on what I can do with this?
District 11 — Don Manzullo (R) vs Adam Kinzinger (R)
VRA: W 86%
TTP: 46%
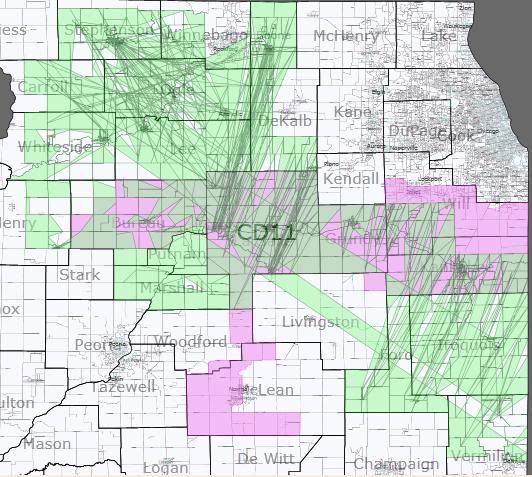
Contains parts of no fewer than 6 current districts. The TTP listed is for Kinzinger, the incumbent by district number and by largest TTP. Manzullo’s TTP is 28%. I’m pretty sure that this is a Republican vote sink. I do feel like I’m wasting LaSalle County, though, which I understand to be a reliable source of Democrats votes. Maybe there’s a better way to draw this vis-a-vis the 8th?
District 13 — Peter Roskam (R)
VRA: W 68%, H 15%, B 10%
TTP: 50%
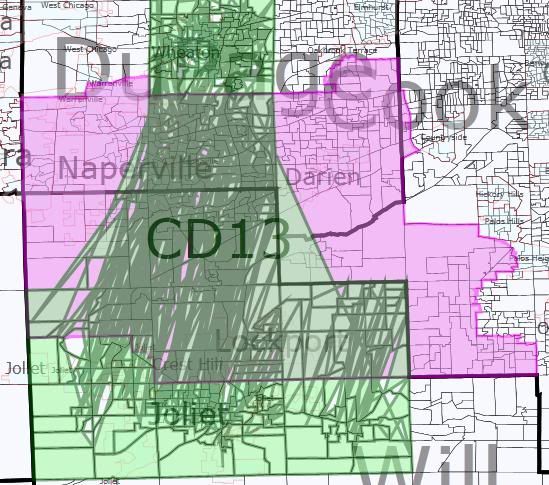
Biggert’s old district now stretches from Wheaton to Joliet. She no longer lives here (Roskam does), but the TTP listed is hers. If Roskam run here, his TTP would only be 17%; Kinzinger would have a TTP of 34%.
District 14 — Open Seat (R?)
VRA: W 62%, H 25%
TTP: 61%
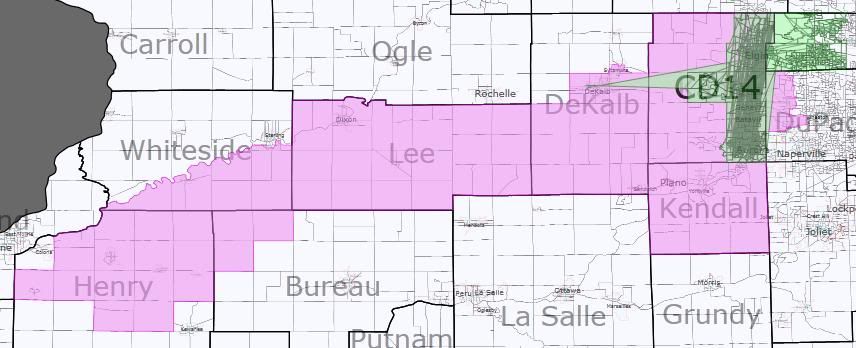
Compacts immensely — no longer stretching out towards the Quad Cities, it is now limited to eastern Kane and far northwestern Cook. This is technically an open seat, since Hultgren lives in the neighboring 6th, although the TTP is his. I believe that both Foster and Bean live in this district. Walsh would have a TTP of 23%. It’s not as disincumbented as I was hoping for — any suggestions?
District 15 — Tim Johnson (R)
VRA: W 83%, B 10%
TTP: 54%
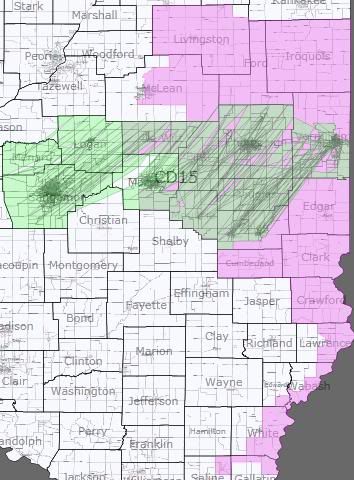
Switches orientations from north-south to east-west, dropping rural areas to pick up Decatur and Springfield. The Springfield area seems to be unusually Republican-friendly for a state capital, so I don’t think this hurts him as much as might be hoped. Nonetheless, this is one of the three districts outstate that I consider a potential D pick-up. Schock’s TTP is 22%, Schilling’s is 17%.
District 16 — Open Seat (R)
VRA: W 93%
TTP: 60%
Entirely relocated from the northwest to the southeast, where it takes over for the reapportioned-away 19th. (This also results in no old/new picture, since the number changes — you’ll have to scroll up to the overview.) Although technically an open seat, I assume that Shimkus would run here; the TTP is his. Johnson’s TTP is 21%; Costello’s is 14%. The second of the downstate Republican vote sinks.
District 17 — Aaron Schock (R) vs Bobby Schilling (R)
VRA: W 78%, B 11%
TTP: 45%
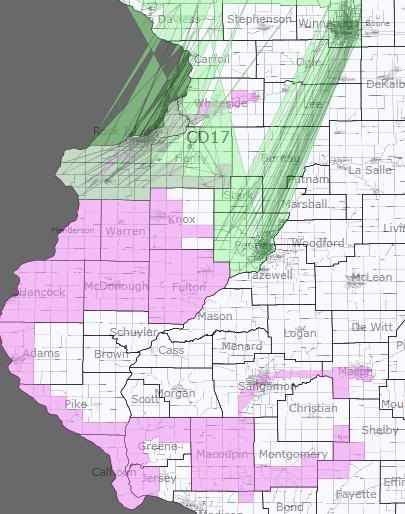
Of the Republican-held seats, this is the one I most strongly suspect would flip Democratic under my plan. A succesor in spirit, if not in form, to the current 17th. It strings together Rockford, the Quad Cities, and Peoria. The TTP listed is actually Manzullo’s, who doesn’t live in the district. Schock’s TTP is 26%; Schilling’s is 25%.
District 18 — Open Seat (R)
VRA: W 91%
TTP: 38%
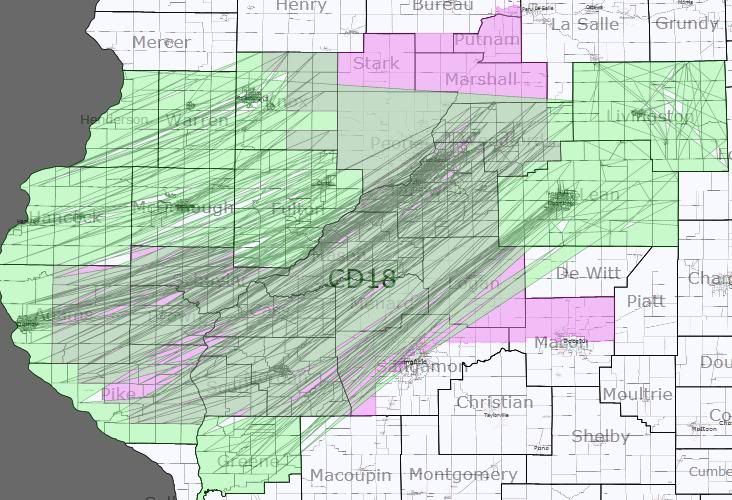
Drops Peoria County and the northern suburbs of Springfield to pick up Bloomington-Normal. This is my third and last Republican vote sink. The listed TTP is Schock, the closest this district (which covers parts of five current ones) comes to an incumbent. Schilling’s TTP is 32%; Johnson’s is 15%; Kinzinger’s is 14%.
Summary
With the caveat again that Illinois is a hard state for me to judge, I think that this map averages around a 12-6 Democratic advantage. Best case scenario: 15-3. Worse case scenario: 8-10 (ie, the status quo, minus one Republican from reapportionment.)
Again, the goals for this map were to demonstrate two things: a possible way to disincumbent the Republicans by making their districts as different as possible from the current set-up and a possible way to swap out Lipinski for a new Hispanic representative. I remain curious about what people who actually understand Illinois think about my plan.
Re Quigley, if you can make a second reasonably compact Hispanic majority district, don’t you have to under the VRA?
very interesting map-some quick notes
1. The configuration is 6 downstate-5 suburban-7 urban. The seat being lost is a downstate one. Similar to 2000 cycle. I know you don’t dwell on the politics in this map-politics yes but geography no. You could divide #11 in half and attach parts to nearby GOP suburban districts to make it more like 7 rural and 4 suburban. Of course Boone county is mostly suburban so the districts might end up rural/suburban. Either way great map.
2. The democrats problem with a second hispanic seat in Chicago is neatly illustrated with this map. Unless you slice up either Lipinski or Quigley’s seat its hard to get two hispanic seats. The seven current Chicago based seats are about 500K short in population plus a new seat is 725K. So how far can you stretch the bread dough of Chicago? Politics aside Lipinski is Speaker Madigan’s guy.
A few things:
The Republicans do not hold the 9th, that is Jan Schakowsky’s very liberal district. The two districts that the Republicans have that could reasonably be called Cook-based are the 8th and the 10th, and both contain significant portions of other counties (8th: McHenry/Lake, 10th: Lake). The 6th also eats into Cook County a bit but no one would call it Cook-based.
Your 3rd and 4th are flipped. Your 3rd would be Puerto Rican while your 4th would be Mexican. I think Gutierrez lives in Bucktown or Logan Square, which would put him in your 3rd. Either way I’m sure that, being Puerto Rican, he would run in the North Side district.
I think you drew Bobby Rush out of the 1st. I believe he lives near Cellular Field, so he probably lives in the little finger in the northeast part of the current 1st. I think you kept Jackson in place though.
Your new 8th shores up Joe Walsh, a lot.
My favorite part of this map: Your 13th could replace NY-24 as the “fuck you” district.
are pretty much useless. That’s a comment for Dave as much as you, but it’s pretty hard to tell what we’re looking at.
From the feedback so far, I think I did this map a disservice by adopting the Chicago-area goals that I did. (Second Hispanic district, axing Lipinski.) Here’s a second take that might address the concerns that various commenters have mentioned.
NE Illinois
[Any district not picture is unchanged from the original diary.]
Chicagoland Zoom
The primary thing to note here is that Lipinski’s district is retained and the 4th remains intact with both the north and south side Hispanic communities.
The 1st, 2nd, and 3rd expand south into the Will and Kankakee. This allows the 11th to swallow up a good part of my originally proposed 8th, which should therefore become less hospitable to Walsh.
(With this map, it would probably be more accurate to say that the 11th is the disappeared district by reapportionment, using the 11th number in the south and the 16th number in the north.)
VRA toplines for the majority minority districts:
1st: 58% black
2nd: 54% black
4th: 74% Hispanic
7th: 53% black
safe gop:
biggert, walsh (more like lean r), schock, shimkus, and that’s all. i like it 🙂
I do not believe that Democrats have lost the two party vote for Congress in Illinois since before 2000. Perhaps even since 1994.
If the Dems can spread their vote just a little bit more efficiently (and they can), several Republicans are on borrowed time.