Florida County Baselines: McCollum vs. Sink

Charlie Crist leaves the Governorship open so Alex Sink (D) and Bill McCollum (R) are running for it. Sink  is the current CFO for Florida and she won with 53% of the vote in 2006. McCollum is the Attorney General of Florida (who supports repealing the healthcare bill which prevents companies from denying people with preexisting conditions) and he was elected with 52% of the vote in 2006. The campaign has not kicked into high gear but a recent poll showed McCollum leading by 9. This looks like a big lead for McCollum but a month before, the same firm showed McCollum leading by 15. Sink will have to win without high turnout like Obama had in 2008 but she is more popular in rural areas so margins there may make up for lost young and minority votes. It is even possible that McCollum will not the primary but the baselines are done assuming he does.

Sink’s background: she worked with Bank of America until Governor Lawton Chiles (D) appointed her for the state education comission. She then ran for CFO in 2006 and defeated Tom Lee (R)

McCollum’s background: he was a congressman from Orlando from 1980 to 2001, representing Disney World at one point. He ran for Senate in 2000 losing 51%-46% to Bill Nelson who prevented McCollum from having large margins in rural areas. In 2006, McCollum ran for Attorney General and won, winning large margins in the I-4 Corridor.

About Florida regions if you are not familiar with them: the Gold Coast is the Miami to Palm Beach coastline, the I-4 Corridor includes Tampa, Orlando, Daytona Beach and the other areas near I-4. The rest of Floria is…the rest of Florida.

How I did the baselines: I added the percentages of each county from the 2006 CFO election, 2006 Attorney General election and 2008 Presidential election and divided the result by three. I then subtracted 1 point from Sink. The percentages below show how the Gubernatorial election will look if the race ties. Also, I am very sorry the baselines are not in one straight line. Here are some helpful links:

For 2006 CFO election: http://election.dos.state.fl.u…

For 2006 Attorney General election: http://election.dos.state.fl.u…

For 2008 Presidential election: http://www.uselectionatlas.org…

Now finally the baselines:

County name Sink McCollum Other

Alachua          59%  40%  1%

Baker             27%  72%  1%

Bay                32%  67%  1%

Bradford        35%  64%  1%

Brevard          45%  54%  1%

Broward         66%  33%  1%

Calhoun          42%  57%  1%

Charlotte        44%  55%  1%

Citrus             44%  55%  1%

Clay               28%  71%  1%

Collier            35%  64%  1%

Columbia       39%  60%  1%

DeSoto          43%  56%   1%

Dixie              42%  57%   1%

Duval             44%  55%  1%

Escambia       38%  61%  1%

Flager            49%  50%  1%

Franklin         47%  52%  1%

Gadsden        72%  27%  1%

Gilchrest        39%  60%  1%

Glades          47%  52%  1%

Gulf              43%  56%  1%

Hamilton       51%  48%  1%

Hardee         36%  63%  1%

Hendry         45%  54%  1%

Hernando     47%  52%  1%

Highlands      41%  58%  1%

Hillsborough  48% 51% 1%

Holmes           31% 68% 1%

Indian River    40% 59% 1%

Jackson          43% 56% 1%

Jefferson         60% 39% 1%

Lafayette        38% 61% 1%

Lake              41% 58% 1%

Lee                41% 58% 1%

Leon              63% 36% 1%

Levy              44% 55% 1%

Liberty           45% 54% 1%

Madison        56% 43% 1%

Manatee        45% 54% 1%

Marion          44% 55% 1%

Martin           42% 57% 1%

Miami-Dade  56% 43% 1%

Monroe         52% 47% 1%

Nassau          31% 68%  1%

Okaloosa      26%  73% 1%

Okeechobee  46% 53% 1%

Orange          53%  46%  1%

Osceola        52%  47%  1%

Palm Beach   62%  37%  1%

Pasco            46%  53%  1%

Pinellas          51%  48%  1%

Polk              44%  55%  1%

Putnam          44%  55%  1%

Santa Rosa    27%  72%  1%

Sarasota        48%  51%  1%

Seminole        43%  56%  1%

St. Johns        34%  65%  1%

St. Lucie        53%  46%   1%

Sumter          37%   62%   1%

Suwanee       38%   61%   1%

Taylor           44%   55%   1%

Union            35%   64%   1%

Volusia          51%   48%   1%

Wakulla         50%  49%    1%

Walton          30%  69%    1%

Washington   34%  65%    1%

Now for those of us (like me) who like visual aides, here is a map of the county percentages.

Florida Baseline Map

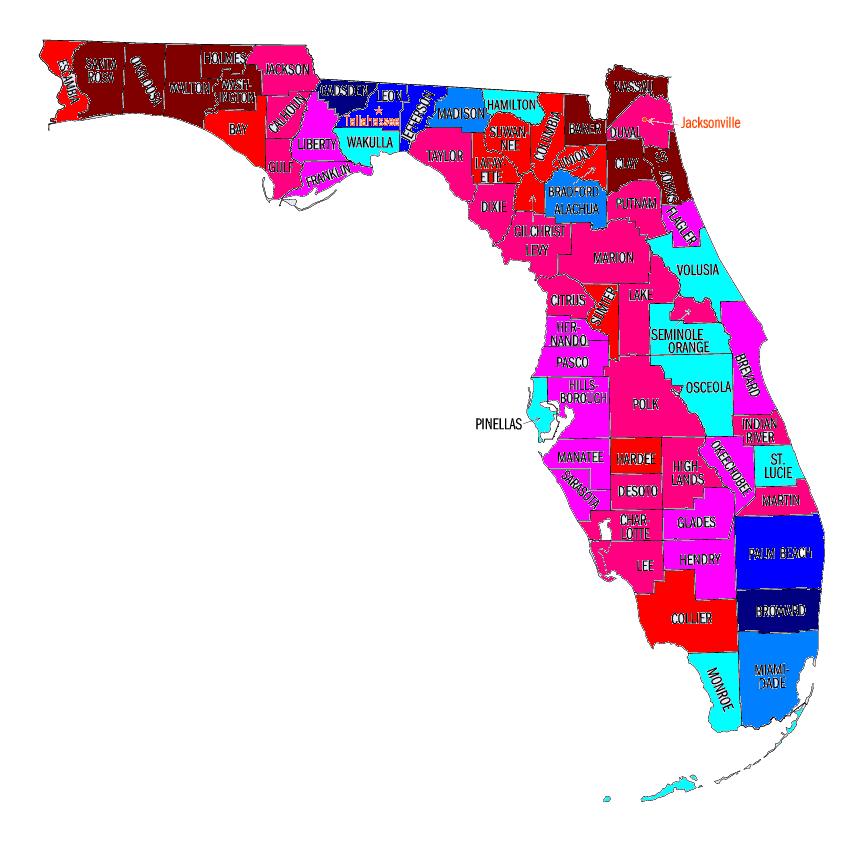
Dark Red: McCollum 65%+

Red: McCollum 60%-64%

Lighter Red: McCollum 55%-59%

Even Lighter Red: McCollum 50%-54%

Turquoise: Sink 50%-54%

Blue: Sink 55%-59%

Dark Blue: Sink 60%-64%

Even Darker Blue: Sink 65%+

A little more analysis:

The map shows Sink doing well along the Gold Coast, the Tallahassee area while winning a few counties in the I-4 corridor. McCollum does well in the rest of the state, winning the Jacksonville area, the whiter retiree communities in the north and south as well as the Pensacola area. To nitpick, Sink did very well in the rural counties around Tallahassee in 2006 but since they are trending rightward, the maps show her winning much less than she did in 2006. Also, McCollum is from Orange County (Orlando) so this should help reduce Sink’s margin there (McCollum won 55% in Orange County in 2006) but Orange County’s leftward shift should give Sink a small margin, as shown in the map.

Overall, the counties colored blue appear to not match Obama’s coalition which produced big margins in Orange County but not around Tallahassee. The results should be similar to a regular statewide Florida election.

P.S Just in case you are wondering what I will post on swing state project next, it will be my first redistricting diary in a few months, this time on my homestate of California!! It has taken me forever to write and losing half of the document in cyberspace does not help either. I should have it up hopefully in 1-2 weeks (I was thinking the same thing 4 weeks ago though.)  

By what margin will Bob Shamansky win?

View Results

Loading ... Loading ...

Maryland County Baselines: O’Malley vs. Ehlrich

Robert Ehlrich (R), the former Governor of Maryland is running against Martin O’ Malley (D) the incumbent Governor of Maryland. This is like a repeat of 2010 because the two same candidates are running for the same seat, except O’Malley is the Governor this time. Yes, Maryland is a Democratic state where Obama won 62% but a recent Rasmussen poll showed O’ Malley ahead by only three points. http://www.rasmussenreports.co…

Rasmussen usually leans to the right in their polling but still, Maryland should have a competitive race. O’Malley should win though. Obama had a boost from high African American turnout but most political people believe it will be lower. For your knowledge and enjoyment, I have created the baseline for Maryland counties which are the expected percentages for each candidate by county if the race is tied. I factored in the 2006 Gubernatorial election because Ehlrich and O’Malley were the candidates in it. I also factored in the 2008 Presidential election because the results are more recent and should reflect Republican and Democratic trends. The two elections combined should offer a clear picture of Maryland’s county baselines.

A bit about Ehlrich and O’ Malley’s past elections: Ehlrich won in 2002 by running far ahead of Republican percentages in the Baltimore County suburbs of Anne Arundel and Baltimore County (which does not include Balitmore City.) Ehlrich used to represent a congressional district in Republican Baltimore suburbs. In 2006, he was unable to pull big margins from them because O’Malley is the former mayor of Baltimore City and he was popular with the working class Baltimore suburban voters Ehlrich won in 2002. For example, he won Baltimore County with 61% in 2002 but lost by 300 votes in 2006. For Ehlrich to win, he needs to do very well with the working class voters. He did not so he lost with 53%-46%. Enough talk about elections, here are the baselines for 2010 if Ehlrich and O’Malley tied:

Wait, here are some helpful links:

For 2006 election: http://www.cnn.com/ELECTION/20…

For 2008 election:

http://www.cnn.com/ELECTION/20…

(I know the percentages do not line up correctly but I cannot fix it.) Now finally the baselines:

County Name O’Malley Ehlrich Other

Alleghany  32%  67%   1%

Anne Arundel  38%  61%   1%

Baltimore County  44%  55%   1%

Baltimore City  73%  26%   1%

Calvert          36%  63%   1%

Caroline  27%  72%   1%

Carrol          23%  76%   1%

Cecil          34%  65%   1%

Charles  49%  50%   1%

Dorcester  30%  69%   1%

Frederick  36%  63%   1%

Garrett          22%  77%   1%

Harford          30%  69%   1%

Howard          48%  51%   1%

Kent          39%  60%   1%

Montgomery  60%  39%   1%

Prince George’s  76%  23%   1%

Queen Anne’s  26%  73%   1%

Somerset  36%  63%   1%

St. Mary’s  33%  66%   1%

Talbot          32%  67%   1%

Washington  32% 67% 1%

Wicomico  34% 65% 1%

Worcester  30% 69% 1%

This is a map for those who like visual aides like myself. The map itself comes from census quick facts but I colored it in.

Maryland Baseline Map

Dark Red=Ehlrich 70%+

Red=Ehlrich 60%-69%

Light Red=Ehlrich 50%-69%

Blue=O’Malley 60%-69%

Dark Blue= O’Malley 70%+

As seen in the baselines, O’Malley only wins the big three (Baltimore City, Montgomery and Prince George’s Counties.) I think he should barely win Charles County which is trending Democratic quickly. Overall, the baselines should fluctuate a bit but I wanted to stay with election results, not my personal opinion on each county. Any thoughts?

Update: Thank you to everyone who voted in the poll. I will be doing Nevada Senate next. You should see the post either tomorrow or in the next few days. After that, I will do Florida Governor.  

By what margin will Bob Shamansky win?

View Results

Loading ... Loading ...

How Christie Won: Urban and Northern New Jersey

This was cross posted at http://frogandturtle.blogspot….

Here is my next and last post in analyzing county by county why Christie beat Corzine in New Jersey. Here is my first post: http://swingstateproject.com/s…

Here is the link to the 2008 election results (red is Democratic and blue is Republican)http://uselectionatlas.org/RESULTS/

Here is the link to the 2009 election results: http://http://uselectionatlas….

Here is the link for New Jersey demographics by county: http://http://quickfacts.censu…

Urban New Jersey

This area contains Union, Essex and Hudson Counties. Christie underperformed the most in this part of the state with Corzine winning it almost 2-1. This was no surprise because Urban New Jersey is by far the most Democratic part of the state. It is minority majority and mostly resembles a city instead of suburbs. Christie also was unable to make large inroads here. In Hudson County where Obama won 73%-26%, Corzine won 69%-27% which only shows a decrease in the Democratic margin by 5 points, the smallest decrease of any county in New Jersey from 2008 to 2009. Hudson County is 35% White, one of the smallest percentages in New Jersey. Christie had a difficult time making inroads among minority voters. The main reason for Christie’s small increase is that Corzine lives in Hoboken, a really nice town in Hudson County where many of transplants from Manhattan live. Corzine’s proximity was a large factor in Hudson County. Since Christie had a difficult time winning minority voters, it appears that Republicans can still win in New Jersey without having to make inroads among minorities if they want to win. Essex County which contains heavily Democratic Newark voted 67%-28% for Corzine while Obama won there 76%-23%. This shows a 14 point decrease in the Democratic margin, only 5 points below the statewide decrease of 19 points. Even though Corzine appeared to hold minorities, there are many independent high income white voters in the western part of Essex County that trended heavily toward Christie, causing the Democratic margin in Essex County to shrink. Union County is where Christie performed the best, decreasing Obama’s 28 point margin to an eight point margin for Corzine. While Union County contains Elizabeth and Plainfield, two cities with large minority populations, Union County is basically Somerset County in the west with heavily white and high income Westfield and Summit. In my post about what to watch for in the New Jersey gubernatorial race, I said Corzine had to win Union County but ten points or more and unfortunately, he did not. Overall, Corzine did very well in Urban New Jersey by preventing Christie from making large inroads among minorities.

Northern New Jersey

Except for Passaic and Bergen Counties, Christie did very well here. He pulled a combined margin of about 30,000 votes out of Sussex and Warren Counties, even though Daggett did very well in them winning 9% and 10% of the vote there. Christie won his home county, Morris by 28 points and its residents are mostly high income white voters. The trend towards Christie over 2008 was 19 points, the same as the overall trend towards him in New Jersey. The reason for the trend not being too sharp in Morris County is party due to Daggett’s strong 8% of the vote here and that Christie appeared to spend more time campaigning on the Shore than here. Passaic County is a different story where Corzine won 51%-44% and Obama won there by 22 points. Passaic County is a mixture of Hispanic immigrants in the city of Paterson and high income white voters in the suburbs along with some working class white voters. The Hispanics probably kept Passaic County from trending too far to the right but it appears that Christie did very well with white voters and Corzine failed to excite the base enough. Corzine won Bergen County by 3 points, only a 6 point decrease from Obama’s 9 point win. Corzine was definitely helped by his running mate Loretta Weinberg who has held political office in Bergen County for more than 20 years. Bergen County is full of high income white voters and if Weinberg were not on the ballot, Christie would probably win Bergen County by about 7 points. Weinberg was not perfect because she was unpopular with party bosses which probably contributed to low turnout in Democratic areas. Also, Corzine’s close proximity in Hudson County may have swayed a few voters.

So overall, what happened to make Corzine lose? On the issues, people swayed towards Christie not because he was a fantastic candidate. In New Jersey, almost all campaigns are negative so the candidates spent most of their time criticizing each other. People believed Corzine was an ineffective Governor who caused the New Jersey economy to sour while he sat in his office counting all his money. Also, Corzine made the mistake of not appeasing the New Jersey Democratic Party. If he had chosen a popular party official as his running mate instead of Weinberg who was unpopular with the party, Corzine may have been able to boost turnout enough to offset Christie’s margins. A good person for running mate would be Richard Codey who was the New Jersey Senate President. He was active Governor in 2005 and he is extremely popular with New Jersey’s Democratic Party. He was even considered last August as a candidate to replace Corzine on the ballot. The turnout levels in Democratic counties was about 50%-60% of the 2008 Presidential election turnout while turnout in Republican counties was closer to 66%. Christie on his part excited the base because he portrayed himself as one of the voters on the Shore or in the high income suburbs. He also took independents by highlighting New Jersey’s poor economy. The main reason though is that Christie swept the high income voters who trended towards the Democrats in the 1990’s because the Republicans were too socially Conservative. Now that the Republicans are downplaying their social Conservatism and highlighting the poor economy, they are able to win in the Northeast suburbs again. Democrats do not need to completely focus on the suburban voter, they just need to win enough of them to lower Republican margins. If Democrats want to start winning in New Jersey again, they have to excite the base while also reaching out to the white high income socially moderate but economically Conservative suburban voter.

By what margin will Bob Shamansky win?

View Results

Loading ... Loading ...

How Christie Won In New Jersey: Southern and Central New Jersey

The New Jersey Gubernatorial race’s polls appeared to resemble the polls in one of the Obama/Clinton primaries in 2008. In those primaries, Clinton led until about two weeks before the primary where Obama started kicking his volunteers into full gear. Then in the last few days (or the last second as in New Hampshire,) Clinton came from behind and won. The comparison does not include Clinton’s tactics or political beliefs; it just includes what the polls showed in the primaries. In early 2009, Chris Christie (R) was ahead of incumbent Governor Jon Corzine (D) and in the summer, Christe lead by ten points. I was not too worried until then because since 1997, Republicans have not won a statewide race in New Jersey. There is this saying that Republicans are Charlie Brown trying to kick the football from Lucy. Christie painted himself as a new voice and blamed Corzine for the economic recession. Corzine highlighted his experience on Wall Street and pointed out how Christie had no plan to fix the economy (Christie, releasing the same economic plan twice does not mean you have two economic plans.) Then in September, the race became very narrow. Independent Chris Daggett began to take independents on the Jersey Shore and Republican suburbs around Somerset and Morris Counties. Corzine, the former CEO of Goldman Sachs began running ads with his gigantic war chest and overall spent around $23 million, about 12 million more than Christie. These two factors heavily contributed to Christie’s slip in the polls but Daggett was the more prominent factor. He had numbers in the teens throughout October while Christie and Corzine hovered around 40%. This pattern remained until the last few days until Election Day on November 3rd. Many Daggett supporters realized that Daggett could not win so they began drifting towards Christie. This explains the final result where Christie beat Corzine and his running mate Loretta Weinberg from Bergen County 49%-45% with Daggett winning most of the remaining 6%.

It looks like Charlie Brown finally kicked the football. Corzine also learned that running ads criticizing your opponent’s weight does NOT gain voters. On average, Corzine won 12 points less than Obama and the margin between 2008 and 2009 shifted towards the Republicans by 19 points. Corzine did not lose much ground among minority voters but Obama performed much better among independent white voters. Yes, the main reason Corzine lost was that Daggett’s poll numbers fell down the drain. In this post though, I will explain how Christie won by analyzing each county in Southern and Central New Jersey. In an earlier post, I wrote about what to watch in New Jersey during election night. Besides analyzing the gubernatorial race results, I will also compare to my last post. As in the last post, the geographical designations are in the same places. Okay, here are the links: http://uselectionatlas.org/RES…

for election results in 2008. Once you click the link, go to the icon choose another office, select gubernatorial races, select a year and you should find yourself a map. Yes, the maps here have red for Democrats and blue for Republicans.

http://quickfacts.census.gov/q…

this is for New Jersey’s demographic data. Click on a county and you will find the data for each county.

Southern New Jersey

In my last post, I said that even Corzine wins, he should still lose Southern New Jersey. Corzine lost and he definitely lost Southern New Jersey. Camden County is the most urban county in Southern New Jersey and Obama won 67% of the vote there in 2008. I said that Corzine needed to win by at least 15 points to win. Corzine barely missed, winning by 14 points. This explains that Christie was able to win white middle class independents but Christie lost Camden County because of heavily Democratic Camden City and its close suburbs. In my last post, I said that if Corzine won Gloucester County, he was successful with winning white voters in Camden County. Christie won Gloucester County by three points so Christie’s success among the Camden County suburban voter was widespread. Gloucester County has the same demographics as Camden County without the inner city. I found heavily white and rural Salem County’s result unexpected. Christie won by six points and since the county narrowly voted for Obama, I would have expected a larger Christie win. The answer to this question could be that Daggett peeled away enough Christie voters to narrow the margin. Daggett won 10% of the vote in Salem.

Another interesting result is Cape May County where Obama won 45% of the vote but Corzine won 38%, higher than counties with similar counties on the Jersey Shore. This could be because Kim Guadango, Christie’s running mate helped him in Monmouth and Ocean Counties further north but not at Cape May. Corzine won Cumberland County 50%-42% winning ten points less than Obama. I expected a smaller drop here due to large numbers of minority voters. As always, Atlantic County was the complete bellwether in the race as it was in 2000, 2004, 2005 and 2008. Christie won 49% of the vote and only 0.05% less than his statewide average, 48.75%. Atlantic County’s population is 61% White, one point less than New Jersey’s 62% White population. Atlantic County culturally may be closer to Las Vegas on the beach than the rest of New Jersey but Atlantic County has a close proportion to the rest of New Jersey of urban, suburban and rural areas. Ocean County just to Atlantic County’s north voted for Christie by 38 points and the increase over McCain’s margin in 2008 was only a bit above the average increase. The important point is the turnout which is about 2/3 the level of 2008, showing that Christie was able to turn out the base. Another important county was Burlington County which usually votes 1-2 points more Democratic than New Jersey and has similar demographics to Camden County. Christie won Burlington County by two points showing his narrow margin among the demographic of southwestern New Jersey white voters. Overall, Southern New Jersey voted similar to what I expected.

Central New Jersey:

Christie received large margins here, losing only one county. Christie lost Mercer County which contains heavily Democratic Trenton by only 16 points, 19 points less than Obama. Most of the voting was polarized with Christie gaining more than average over McCain while Christie gained less in heavily Democratic areas. Mercer County was a different story because even though it was a base county, the base did not turn out and Christie made inroads among the white voters here. In Monmouth County on the Shore, Christie’s running Kim Guadango who is from Monmouth County definitely helped him there. Obama lost Monmouth County by three points even though it is an upper class county that is 77% White. Christie won by 31 points, improving over McCain’s margin by 28 points. The large increase is probably due to not only Guadango but also that Daggett was unable to garner enough votes. He won only 6% of the vote and I expected the Shore would be a strong area for Daggett. If Daggett stayed strong and won somewhere around 15% of the vote, he probably would have reduced Christie 64,000 vote margin in Monmouth County by about 15,000. Another reason for Monmouth County’s strong Christie result is that the New York suburban white voter is trending towards the Republicans. As long as the Republicans stay away from cultural issues, they can start winning these voters again. If Democrats want to keep these voters, they need to highlight how they will keep your job or create one for you.

Moving onto Hunterdon County, Christie won there by 40 points, 27 points higher than McCain’s 13 point margin. Hunterdon County has wealthy independents and the large shift towards Christie is probably because Obama over performed with wealthy independents and they are reverting back to their normal voting patterns. Also, many of the wealthy voters may have trusted Wall Street so were angry that a former Wall Street corporate executive could not fix their economy. Somerset County is less Republican but contains many of the same voters as Hunterdon County. When I saw the Middlesex County result, I was pretty shocked. Obama won there by 22 points but Christie won by three. Middlesex County was not extremely white; its population was 53% White. Most of the minorities were Hispanic or Asians but Christie did not appear to make inroads among those groups. My explanation would be that Corzine failed to turn out the base and Christie did extremely well with white independents. Northwestern Middlesex County is close to his home, Mendham so Christie’s close proximity probably helped him.

Overall in Southern and Central New Jersey, Christie and Guandango’s homes helped them win voters while sweeping independents and preventing Corzine from turning out his base.

My next post, this time analyzing Urban and Northern New Jersey should be up in about a week.

Oh one more thing: check out http://frogandturtle.blogspot…. for more political analysis.  

By what margin will Bob Shamansky win?

View Results

Loading ... Loading ...

Gubernatorial Cattle Call (July ’09)

We’ve never done one of these before – a gubernatorial cattle call. There just weren’t enough races last cycle. But this time, we’ve got a ton, and a very unsettled landscape given the huge number of open seats.

In case you haven’t done one of these before, rank the gov seats that are up in 2009 & 2010 in order of likelihood of flipping. (So this includes New Jersey and Virginia.) The traditional SSP way is to include seats held by both parties in a single list (separate lists make comparisons harder). Go as far down the list as you like. If you need some food for thought, check out Swing State’s gubernatorial race ratings. Have fun!

Social Networking with the 2009 Democratic Gubernatorial Candidates

{First, a cheap plug for my blog Senate Guru.}

While 2010 will be chock-full of exciting races at all levels of government.  In 2009, though, there will be two marquee races across the country: the gubernatorial races in Virginia and New Jersey.  Republicans are favored in both races, but both races should come down to the wire, and Democrats can hold both seats – with your help.

In Virginia, Democratic State Senator Creigh Deeds won an impressive, come-from-behind victory for the nomination this past Tuesday, demonstrating a strong ground game.  The Republican nominee will be far-right-winger Bob McDonnell.  The best description for McDonnell’s brand of Republicanism is that he is a Pat Robertson disciple.  You can learn more about McDonnell at TheRealBobMcDonnell.com.  Deeds and McDonnell have tangled before, in the 2005 Virginia Attorney General race, where McDonnell barely edged Deeds by 323 votes (yes, just 323 votes – that’s not a typo with zeroes missing) out of over 1.94 million votes counted.  This race will be exceptionally close, so every single dollar contributed and every single hour spent volunteering will make a real difference.  A bit of good news is that the first poll taken after Tuesday’s primary, by Rasmussen Reports, shows Deeds with a 47-41 lead over McDonnell, but this could just be due to a primary bump.  Rasmussen’s last poll showed McDonnell leading Deeds 45-30.  Your support will help Deeds sustain his new lead.

In New Jersey, Democratic incumbent Governor Jon Corzine will square off against Republican former U.S. Attorney Chris Christie.  Christie is very much at home in the Republican Culture of Corruption.  Republican Christie has faced scandals involving no-bid contracts, abuse of the state pension system, pay-to-play, and even allegedly cutting a deal to get his younger brother’s sentence reduced after being implicated for fraudulent trading practices on Wall Street.  Despite Christie’s mountain of scandal, New Jersey’s lagging economy has hurt Governor Corzine’s poll numbers.  Recent polling gives Christie a 7 to 13 point lead over Corzine.  Research 2000, May 25-27: Christie 46, Corzine 39; Rasmussen Reports, June 4: Christie 51, Corzine 38; and, Quinnipiac, June 10: Christie 50, Corzine 40.  In other words, Christie has an edge, but the fundamentals of the race moving forward favor Governor Corzine.  As the economy gradually picks up over the coming months and voters learn more about Christie’s corrupt background, New Jersey’s blue state status will shine through and Governor Corzine should tighten the race back up.  Your support will help Governor Corzine tighten the race up even faster.

Below are the links to how you can connect with the gubernatorial campaigns (and – please – contribute anything you can to these campaigns, and spread the word!).  Republicans are expecting (and expected) to win both of these races.  However, after being upset in the NY-20 special U.S. House election and losing a U.S. Senator to a Party switch, the GOP is reeling.  Losing either (or both!) VA-Gov or/and NJ-Gov would be a major body blow and simply crush Republicans heading into the 2010 calendar year.  If Democrats across the country are able to support these Democratic campaigns, we can flush the conventional wisdom down the toilet and deliver two more embarrassments to the Rush-Newt-Cheney Republican Party and two more losses to the Michael Steele RNC.

Creigh Deeds for
Governor of Virginia
Deeds
Website
Deeds
Facebook
Deeds
Twitter
Deeds
YouTube
Deeds
Blog
Deeds
CONTRIBUTE
Jon Corzine for
Governor of New Jersey
Corzine
Website
Corzine
Facebook
Corzine
Twitter
Corzine
YouTube
Corzine
Blog
Corzine
CONTRIBUTE