This is the sixth in a series of diaries depicting the Democratic victory in this year’s midterm elections.
Already covered have been New England, NY, NJ, MD, and DE, PA, OH, and Indiana.
Today’s diary will focus on Michigan. As always first up are the seat control maps, and in this case there’s only one map because no seats changed hands in 2006.
2004 & 2006
Of the 3,646,436 votes cast in the 2006 US House races in Michigan, 1,922,808 votes (52.7%) were cast for Democratic candidates, while 1,626,399 votes (48.4%) were cast for Republicans. Including races that the Repubicans didn’t oppose in 2006, this represents a 4.1% shift from 2004, excluding the two Detroit races Republicans choose not to oppose in 2006 the modified Democratic vote share at 48.4% represents a 3.1% shift over totals in the same 13 races in 2004. As stated above no seats changed hands.
Democrats took 6 (40%) of Michigan’s 15 Congressional districts while winning 48.4% of the state Congressional vote, rising to 52.7% if totals from the two Detroit districts left unopposed by Republicans are included. If seats were apportioned according to vote totals, i.e. proportional representation, Compare this to Indiana where Democrats took 55.5% of the state’s Congressional seats while winning only 48.5% of the state Congressional vote.
The difference?
Democrats controlled redistricting in Indiana, while Republicans controlled the redistricting process in Michigan in 2000. While Democrats control both the governor’s offices and the Michigan House, Republicans retained control of the Michigan Senate. With the redistricting process controlled by the legislature, this points to the need to put the press on Republican Michigan Senators for 2008. However, attmempts at redistricting at this point probably would do more harm than good. Using the fairer Democratic performace standard I’ve created below, we find that statewide Democratic performance is at 51.8% which if reflected in the distribution of Congressional seats would create two new Congressional seats for the Democratic party.
The 50 State Strategy can’t be a one hit wonder, we have to work to get Democratic candidates elected at all levels. If we do we’ll have strong candidates to run for office in other races. We need to build a farm league, officeholders who’ve already represented part of the district at a another level of government who can run for Congress. Half the fight for a challenger is getting the public to recognize your name. If you’ve got someone who’s familiar from having already held office you’ve got a running start. This is how the Republicans win, they build up networks that stay in place long after any one race has been finished.
Senators and Congressional representatives who have large warchests should be asked to pay an apportionment to state parties. And we need strong competition within the party organization to ensure that state parties aren’t controlled by a few wealthy donors to the detriment of the working public.
Returning to Michigan, there’s hope that we can take two Congressional districts without redistricting. While there were no Congressional pickups in Michigan, Democratic candidates came within striking distance in the MI-07 and MI-09.
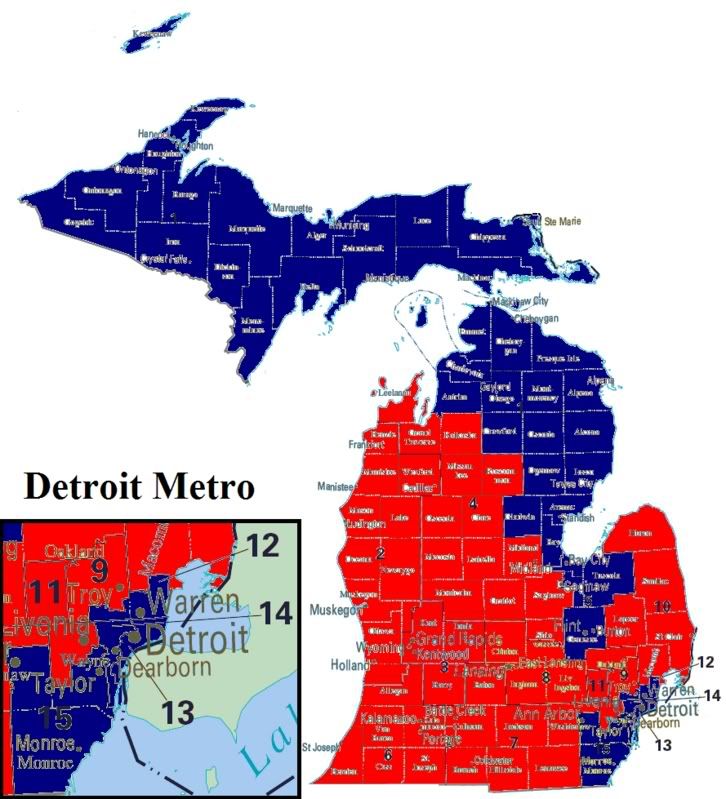
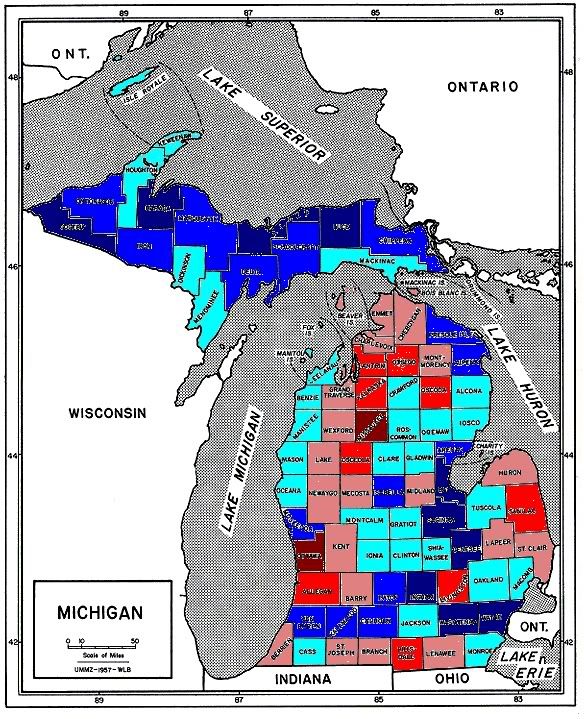
2006 Vote Margins
The deepest blue indicates a Democratic victory of over 60%, medium blue 55-60%, light blue 50-55%, pink 45-50%, medium red 40-45%, deep red 40% or less.
In the MI-07, Club for Growth Republican candidate Tim Walberg defeated the incumbent Republican candidate Joe Schwarz in the August primary. Walberg’s campaign faced contreversy in late October when a local paper revealed that a Walberg aide had pled guilty to child abuse charges in September. Walberg won with a narrow 10,0017 (4.1%) margin over Democratic candidate Sharon Marie Renier. While measures of base partisanship show that the western edge of the district leans Republican, vote totals from the Governor’s race show the impact that a high profile race with a winning message can have in the area, turning red to blue.
The second pickup opportunity for 2008 lies in the in the I-09 where incumbent Republican Joe Knollenberg faced a strong challenge from Democratic candidate Nancy Skinner. Despite winning his district by a 18.9% margin in 2004, a poll taken in August showed Knollenberg in deep trouble. Well under 50%, Knollenberg was running at 44% to Skinner’s 40%. In a district dominated by the auto industry, Knollenberg’s postions for NAFTA and steel tarriffs that hurt domestic auto production ran showed a disconnect with the people back home. Knollenberg’s 14628 (5.3%) vote margin yielded a narrow 51.5% victory him, and a great big target on his seat for 2008.
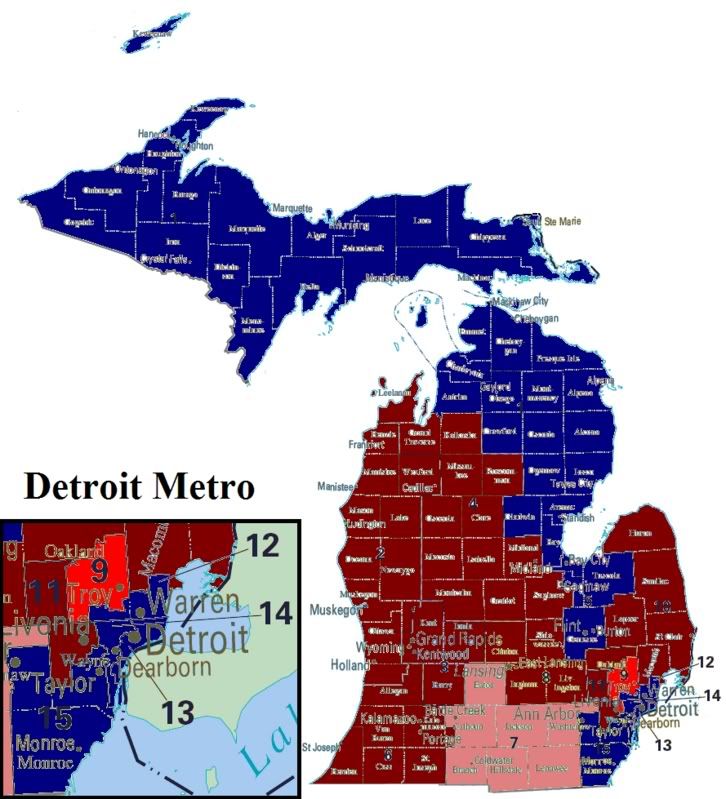
2006 Vote Gains
The deepest blue indicates a Democratic vote gain of over 10%, medium blue 5-10%, light blue 0-5%, pink 0 to-5%, medium red -5 to -10%, deep red -10% or less.
If there’s a lesson to be learned from Michigan it’s that a Democratic message that focuses on confronting the very real problems presented by corporate globalization and the dismembering of state regulatory regimes that protected workers, consumers, and the environment is a winner. Our two greatest surges came in the already mentioned MI-07 where the Democratic candidate surged by 10.1% over the 2004 Democratic performance at 36.3%. In the MI-09, Skinner rose 6.7% over the 39.5% Democratic candidate showing in 2004. We need a populist economic message if we want to make gains in 2008.
There’s a war brewing in the party right now because of this.
Sirota’s right when he goes after the lack of geographic diversity among the pundit class and the subsequent impact that this has on the polical dialogue in this country. We need people like Sherrod Brown to make trade an issue. Even more damning is the piece written by Gjohnsit noting that 27 of the 29 Democratic pickups this year came from the defeat of “free trade” Republicans. And back in Michigan, our biggest gains came against Republicans toeing to neo-liberal economic policy framework that working people don’t want. If the Democratic leadership and the pundit clases can’t get the message they need to have their asses shipped off to the unemployment line. Turnabout’s fair play, let’s see how they like it when they spend a year without a paying job.
But the war in the party brews, I may have to stop to take a break from the Graphic Anatomy of victory series to give this the treatment this deserves later this week.
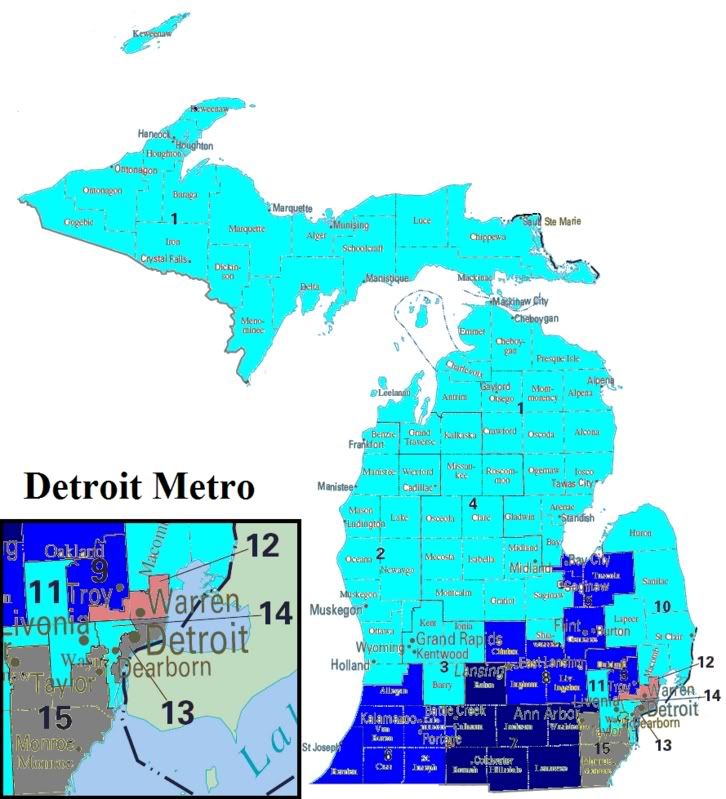
The point is that Democrats can win in rural areas. Looking at a map of base Democratic performance in Michigan we see that except for the Upper Peninsula, Democratic strength is largely held in the Detroit metro area.
2006 Base Partisanship
The deepest blue indicates a Democratic base partisanship of over 60%, medium blue 55-60%, light blue 50-55%, pink 45-50%, medium red 40-45%, deep red 40% or less.
The measure of base partisanship is predicated on a belief in the role of information in politics. Basically, where voters are unfamilar with candidates and issues they rely upon party to make their decision. Most of us have had the moment in the polling booth when we get down to low profile races like Clerk of Courts, and having not a clue to either the candidate’s running or the issues at hand we vote the only way we know how, by party designation. I’m planning to develop a more thorough measure that looks for low profile state races where total spending per capita was low to calculate means that give us an idea of how people vote with no other information but party.
To create the measure I’ve displayed on the map above, I took the mean of Democratic vote share (note that all races elect 2 candidates) in the Wayne State University Board of Governors, Michigan State University Board of Trustees, and University of Michigan Board of Regents races.
Top 5 Dem Michigan Counties
CTY Area Base Democratic Vote
WAYNE Detroit 69.8%
GENESEE Detroit 62.9%
GOGEBIC Upper Pen. 60.5%
WASHTENAW Detroit 60.2%
MARQUETTE Upper Pen. 59.4%
As you can see Democratic strength is concentrated in the Detroit metro area, and the parts of the Upper Peninsula near Wisconsion. The Upper Peninsula is was dominated by the mining industry at the beginning of the 20th century, and continues to have a large forestry industry. Also this is the the only area in the US where a Finnish ancestry dominates. In many ways the Upper Peninsula belongs more culturally and demographically to Wisconsin and Minnesota than it does to Michigan.
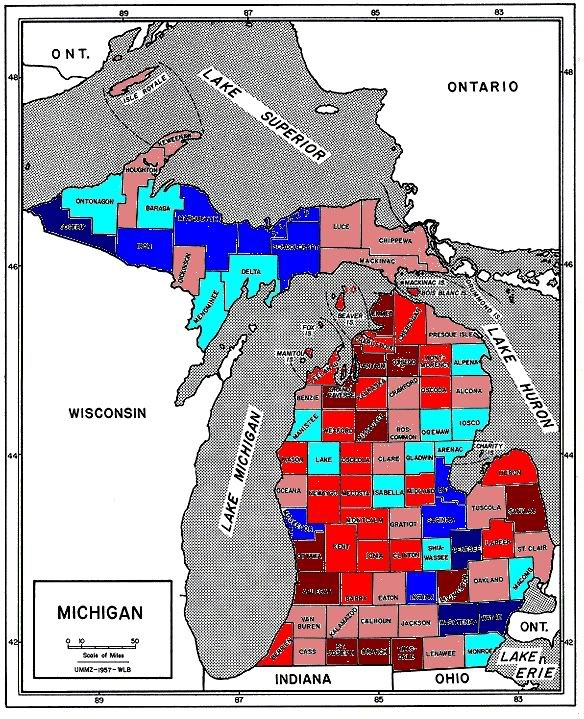
While the red swath in western Michigan may look unconquerable, results from the 2006 Governor’s race where Democrat Jennifer Granholm prevailed prevailed over Republican Dick DeVos. Granholm took 56.3% of the vote with DeVos taking only 42.3% of the vote despite having spent almost $40 million of largely his own money attempting to unseat Granholm. De Vos is heir to the Amway fortune, and was attacked by the AFL-CIO for outsourcing Michigan jobs, and has a long record of support for neo-liberal economic policies on trade and education. Looking at the returns from the 2006 Governor’s race Granholm was able to garner strong support in strongly Republican areas.
2006 Governor’s Race
The deepest blue indicates a Democratic victory of over 60%, medium blue 55-60%, light blue 50-55%, pink 45-50%, medium red 40-45%, deep red 40% or less.
Granholm’s most dramatic gains were in the Upper Peninsula where she outperformed the base Democratic vote by 16.1% in Luce county, and in the Kalamazoo area where she performed 9.6% over the base Democratic vote. Statewide Granholm only performed 4.6% over the base Democratic vote, however her overperformace was concentrated in Republican areas denying De Vos his Republican base.
Tier 0
Race D% R% Margin 2006 D Cand.
No races meet the criteria for this tier.
Tier 1
Race D% R% Margin 2006 D Cand.
MI-07 46.4 50.5 4.1 Sharon Marie Renier
Tier 2
Race D% R% Margin 2006 D Cand.
MI-09 46.2 51.5 5.3 Nancy Skinner
And finally the running totals for the series.
Tier 0 (4)
CT-02, NY-19, NH-1, IN-09
Tier 1 (9)
CT-04, NJ-07, NY-25, NY-26, NY-29, OH-2, OH-15, PA-06, MI-07
Tier 2 (4)
OH-01, PA-15, IN-03, MI-09
States Covered
CT, IN, MA, MD,ME, MI, NH, NJ, NY, OH,PA, RI, VT
I’m still catching up, this is the second to last article I posted on MYDD and Kos. I’m working on Illinois right now for my first new diary.
Enjoy!
but that’s the way I comment.
Now, let me get it out. I despise Reiner. Democrats have showed the utmost stupidity nominating her twice. This is a swing district, and we nominated her in 2004 to an open seat. The republican candidate had to go through a grueling primary, and Clinton won this district. Sounds like a great opportunity right? Well, it is, until your candidate makes the focus of her campaign NOT, you read right, NOT raising money like a normal campaign. So, in an open seat in a swing district where the Republican had to spend a million dollars to narrowly win a primary, we got 39%, worse than Kerry. Then what do we do, we renominate this ultra-liberal IDIOT again.
I’m sorry, but the Democratic Minority Leader of the State Senate’s district is entirely within this CD, and he’s mentioned very highly as a candidate who would crush Wahlberg. I want him in the race, and even if he didn’t run, I doubt any district Democrat with a concious wouldn’t let reiner have the nomination to herself, no Democratic politician would want to see the party suffer from another Reiner candidacy. This has the means to become the Graf case of 2008, and if Wahlberg survives renomination, he’s certainly toast, especially if he serves as outspokenly ultra-conservative and controversial if he campaigns. With the minority leader this district is tier 2 because it’d already be over.
MI-09, Knollenberg’s district is an excellent target. All we need is a local, wellknown Democratic politician to be well funded and run, and we could win this democratic trending swing district from the ultra-cosnervative knollenberg.
Nancy raised $407K to Ranier’s $30K something and she is now the best known candidate in MI-09, not someone without the incredible base she built in a difficult district for us. She has a huge volunteer base to start with next time around, should she decide to give it another shot. We now know where she was strong and where she was weak, and extra attention can be paid to those areas where she needed more turnout and/or more votes.
She closed the gap from ’04 and lost by only 5.3%. She did that because she was a great candidate and really connected with the people — why look for someone new? If she decides to run again, all she needs is more money and she can beat Joe (assuming HE runs again). Her campaign will need more help from the DNC and DCCC next time around. This is doable — it was doable this time, but she got no help from the national party organization. Hopefully her success in closing the gap opened some eyes and next time they wouldn’t ignore her.