I have been analyzing the available early/absentee vote totals from the first three days of voting in Texas. Texas makes the cumulative early vote and absentee vote totals for the 15 most populous counties available, and also has day-by-day breakdowns available from previous years, providing great data for analysis.
http://www.sos.state.tx.us/ele…
Early vote numbers are up in every county. So being that the numbers aren’t release by party, how can we tell who is turning out? My choice was to arrange the 15 counties according to the performance of Barack Obama in the county, to get a rough idea of how Democratic the county is (arranging by Kay Bailey Hutchinson’s performance in 2006 gave a nearly identical inverse arrangement). Then, I compared the 2010 vote so far to the vote in the county at this point in 2006, to see if there was a correlation between increased turnout this cycle and how Democratic the county was. I then adjusted it for change in voter registration between 2006 and 2010.

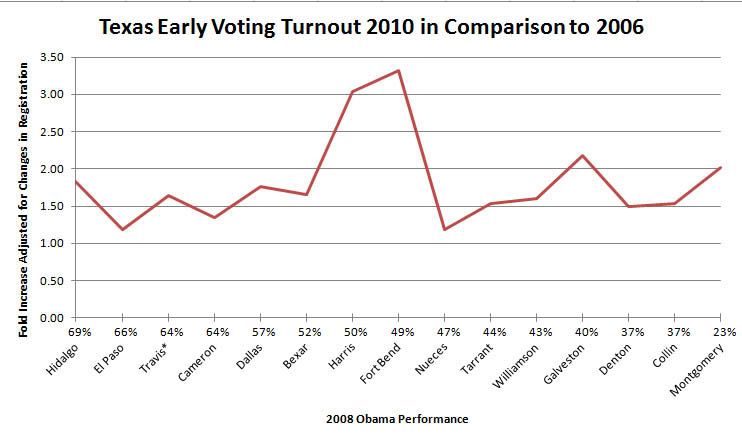
This chart shows that the average county has so far cast 1.8 votes for every vote cast in 2006. The counties on the left voted more strongly for Obama, and the counties on the right voted more strongly for McCain. There is a spike in the middle for two counties: Harris and Fort Bend, near Houston, which were both roughly split in the vote in 2008. If you ignore them for now, and look at the turnout in Obama counties (52% or more Obama vote), in these counties 1.57 votes have been cast for every vote in 2006. In the McCain counties (47% or less Obama vote), 1.65 votes have been cast for every vote in 2006.
These numbers indicate that the advantage in Republican counties in Texas compared to Democratic counties is very slight, an advantage of 0.08 votes in 2010 for every vote in 2006. No indication of Democrats getting crushed here. What’s going on in Harris and Fort Bend? My assumption is that these counties, being from the Houston area, are influenced by the presence of former Houston Mayor Bill White in the Governor’s race. Whether people are coming out to vote for or against him, I can’t say. I have seen it mentioned that turnout has been heavier in parts of Harris County that are more Republican-leaning, though I can’t confirm that, and it doesn’t seem to be part of a statewide trend. Voters in urban, conservative Tarrant County are turning out at lower rate than urban, liberal Travis County.
The turnout numbers as a percentage of registered voters seem to indicate that the partisan make-up of the county has little effect on turnout, so far. In short: no enthusiasm gap. There is one gap, though. Among the top 15 most populous counties in Texas, the ones that voted for Obama (counting Harris) have cast 284,635 votes so far. The ones that voted for McCain (counting Fort Bend) have cast 149,764 votes.
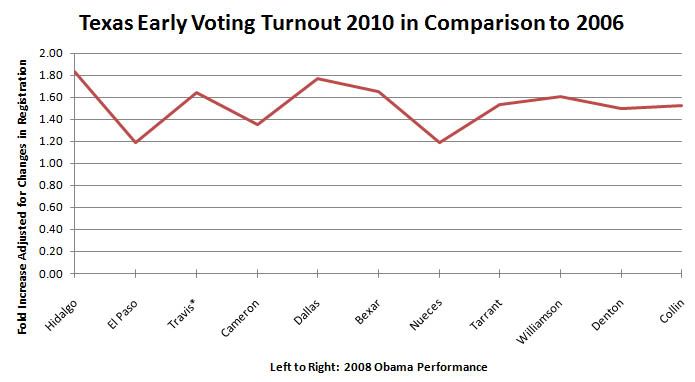
UPDATE: Here is the graph with the 4 Houston metro area counties removed. It’s clear that Bill White is having an effect on turnout in these counties, so I think comparing other areas of the state make a more clear apples-to-apples comparison.

In the non-Houston counties, we have 1.57 votes in 2010 for every vote in 2006 in the Obama counties, and 1.47 votes in the McCain counties. An enthusiasm gap which slightly favors Democratic counties!
The Republican counties that are voting more heavily this time around, Galveston and Montgomery, are also in the Houston area, and the “Houston effect” that you’re seeing in Harris and Fort Bend is probably also affecting these counties and skewing the totals in the favor of the Republican.
If you try to get away from the Houston effect and just compare the inland urban areas of Travis and Dallas to Tarrant and Denton, the difference is more noticeably negligible, and actually in leaning in favor of Democrats.
Very informative
Overall, my impression is that, so far, we are either doing slightly better than what we could be doing. Certainly, this varies by state, and in each county in each state, but from non-partisan voices (i.e. not the Iowa State Democratic or Republican Parties), the numbers seem slightly positive for Democrats. What’s happening in Texas seems to confirm this, although I am not particularly sure why.
It’s also interesting because, either in the next election or in 2016, I think Texas will be a swing state. It hasn’t seen a real race in several decades. It’s growing, especially because of immigration, and that just adds to the millions of people who are potential voters in the state but who aren’t being targeted. I remember reading that because of the intense focus from each side, something like 90-92 percent of potential voters in Ohio are registered. That will change each presidential election, since people move in, die, or turn 18, but it’s only going to go up until there’s simply nobody left who wants to register to vote. I can only imagine something similar is happening in other Midwestern states. It’s probably less true, but only somewhat less true, in the blue-trending areas of the South and Southwest. But once there’s almost nobody left to register, the efforts will go elsewhere, and Texas is a pretty untapped resource for votes. If they win this state, the Democrats will probably have a lock on the Electoral College, assuming we still have it, for many years, so I hope there’s someone at the DNC mining this data about where to target voters first.
Great analysis here, really good to see these numbers visualized.
I’ve said this before and I’ll say it again, Bill White is our best candidate in the entire country.
He has immense respect in the Houston metro area. He received 63% of the vote for mayor in his first election and 91% and 87% in his subsequent campaigns.
Mind you, Houston is not a firmly Democratic city. Barack Obama barely carried Harris County in 2008.
Additionally, he has endorsements from many of Kay Bailey Hutchison’s supporters from the “country club” wing of the Republican party.
I previously wrote about Bill’s chances here:
http://www.swingstateproject.c…
You never know, a Bill White win could lead to a future presidential campaign, something I truly hope bears fruition.
Not that most pollsters would necessarily agree. I just happen to think the GOP-over-Dem advantage won’t grow much at all from ’08. I’m thinking…
GOP – 38%
Democrat – 36%
Independent – 26%
Perry – 88/8/52 = 50%
White – 12/92/48 = 50%
Arguably, this is a very Dem-friendly model, given Texas Independents tend to skew conservative, plus Republicans often tend to siphon-off a hefty, double-digit # of Dems. Alas, I think Perry’s a far weaker brand than “generic Republican.” We’ll see, though. If I were a betting man, I’d still say Perry eeks it out.
from Paul Burka, outlining early voting within Harris County and how the numbers in the GOP areas are high?
http://tiny.cc/g3keq
Would love to see updates as the early vote period continues…
in the first week of early voting in Texas. Dems vote the second week and on election. If we are slightly behind even or ahead in turnout now, it means that the turnout models used by pollsters were probably wrong and that this race has been much closer all along. just goes to show how great of a field game Bill White is running right now.