Speak of the devil! After all my grumbling about the inadequacy of the county-level population estimates, it turned out that our friend Dave was about to produce new tract-level estimates from the American Community Survey. So here is a new district map of Arizona, with exactly the same concept (new exurban AZ9 drawn mostly from the overpopulated AZ2, AZ6, and AZ7) but actual district boundaries as opposed to rough guesses.
With the ACS estimates, the aggregate population was very close to the Census 2010 figure so the “phantom” problem disappeared. It also turned out that Nico was exactly right about how much the old districts had grown: AZ6 was first, followed by AZ2, AZ7, and AZ8. AZ3 and AZ4 weren’t far behind, and AZ5 was actually about 9k understrength.
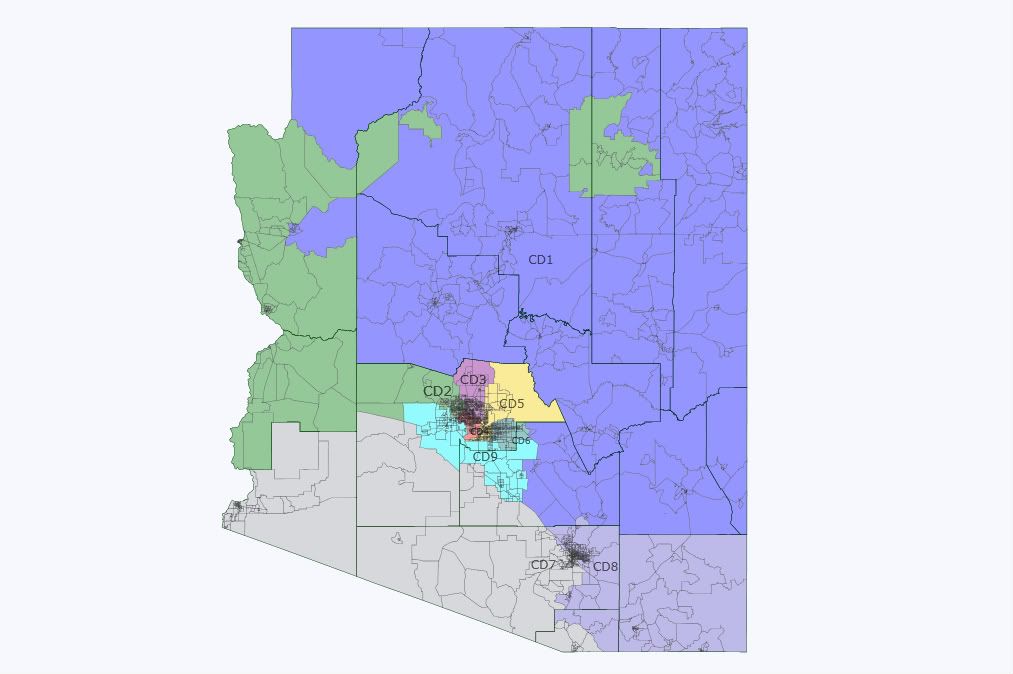
Here is the new state-level map:
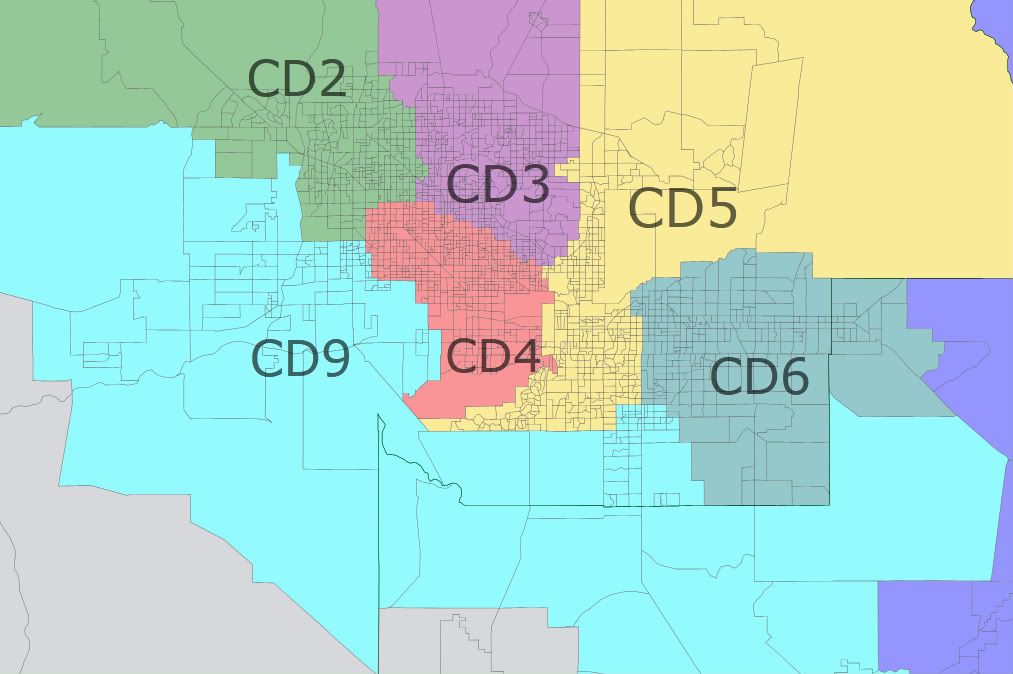
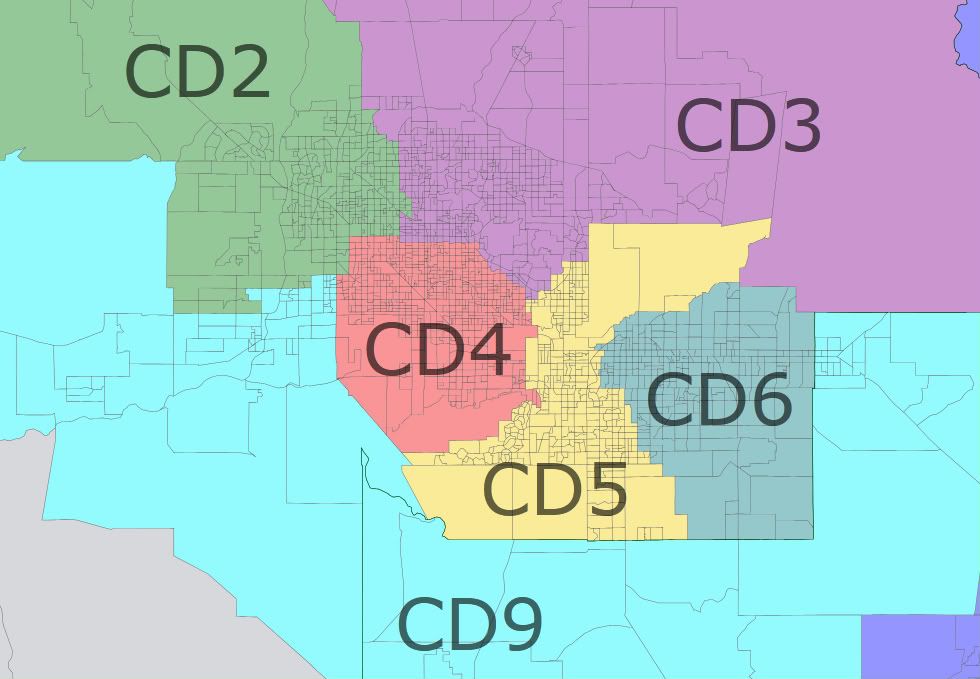
The Phoenix map:
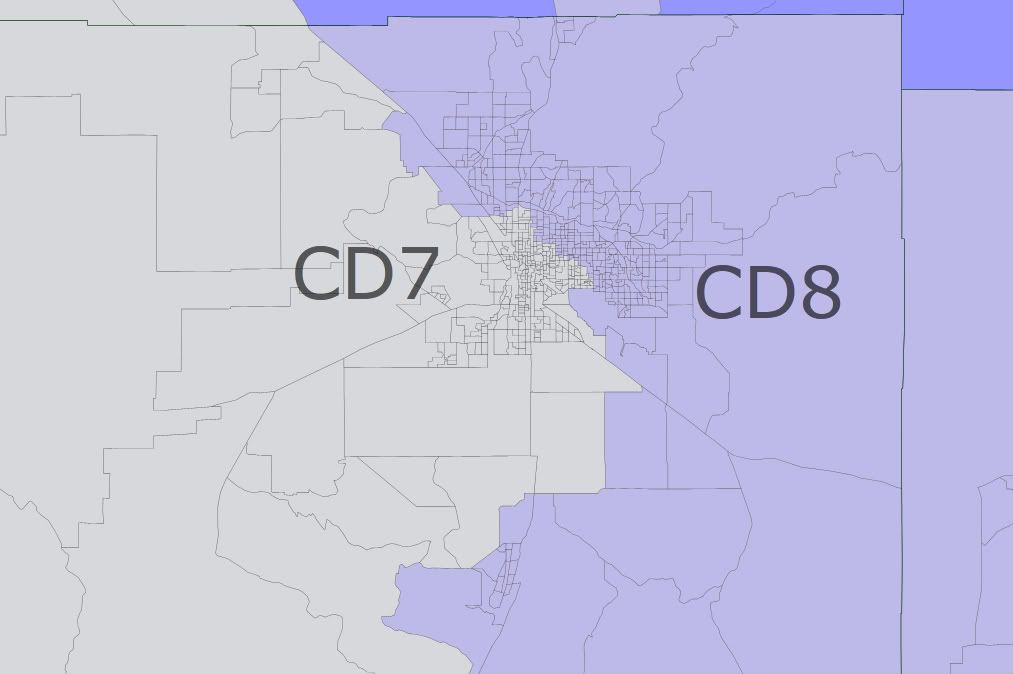
I drew a serious border between AZ7 and AZ8 instead of just guessing, so here is the Tucson map:
District notes:
AZ1: The boundaries were almost identical to the first map I drew, as it needed to take the strip and Kingman from AZ2 to hit its target. Ethnic mix: old 58 white/18 Hispanic/20 Native American, new 61W/15H/21N. Probably a bit more red now.
AZ2: Lost a bit more territory than I expected to the new AZ9. Ethnic mic: old 70W/20H, new 73W/18H.
AZ3: Had to lose about 45k, and lost them all on its southern end to AZ4. No need to take any of AZ5, which was below its target. Ethnic mic: old 71W/20H, new 73W/18H.
AZ4: Also had to lose about 45k and AZ9 took a big bite out of its southwest corner, forcing it to move a bit north. Not as pretty as it was before, but still nice and blocky. Ethnic mic: old 22W/66H, new 24W/64H. I don’t think Ed’s worried.
AZ5: Only 9k under its target, it could basically stand pat. Swapped a few districts with AZ6 to make the lines cleaner. Ethnic mic: still 71W/17H.
AZ6: I decided to keep Apache Junction here since it’s really an extension of east Mesa and didn’t grow much in the 00s. As in the previous map, it loses the rest of its Pinal piece to AZ9 and its Chandler piece (this time mostly to AZ9 instead of all to AZ5), and retains Gilbert, Queen Creek, and almost all of Mesa. Ethnic mic: old 71W/21H, new 72W/20H.
AZ7: It had to keep a bigger than expected piece of Pinal, which resulted in AZ9 being pushed north. It had to take about 57k people from AZ8, and the current boundaries are a fairly straightforward northwest-southeast line as opposed to a strained attempt to jam as many Hispanics as possible into AZ7. I decided to stick with this and had AZ7 nibble at the edges of AZ8, although I restricted it to tracts that were at least 20% Hispanic. Ethnic mic: old 34W/55H, new 36W/54H.
AZ8: Looks much more like the current AZ8 than my previous map did, and keeps its Pinal tract now. The pieces it lost to AZ7 had the effect of reducing the Hispanic percentage in both districts. Ethnic mic: old 70W/21H, new 71W/20H.
AZ9: The previous AZ9 I drew turned out to not have enough peeps, so now it has to go deep into Chandler on the east side and well north of I-10 on the west side. Interestingly this district is majority-minority at 46% white, 41% Hispanic, and 6% black which is high for Arizona. It probably leans Dem at least in a presidential year.
(here is the original post in its entirety)
Short version: Exurban areas of Pinal and Maricopa counties that grew like a weed in the 00s are carved out of districts 2 (Franks), 6 (Flake), and 7 (Grijalva) to form a new district 9. The other 5 districts only get minor tweaks to meet population requirements for the most part.
This map is my interpretation of shamlet’s description of his own map with an exurban AZ9. My original concept was for AZ9 to stay entirely within the west valley of Maricopa county including the established cities of Glendale and Peoria along with some of the bubble areas to the south, pushing AZ2 to the west to pick up Yavapai county and forcing AZ1 (Gosar) to pick up almost all of Pinal county. I decided that I liked shamlet’s concept better, as mine would have been more disruptive to the current map and would have likely resulted in AZ1 being dominated by exurban Pinal at the expense of its far-flung, highly diverse rural communities.
Some words of warning: The boundaries between the districts are approximate, not absolute. The population estimates in the redistricting app only go down to the county level. This is fine for a state like Iowa where no county is big enough to contain as many as one district, but it causes trouble in Arizona which has just 15 counties, with nearly 80% of the population in just two of them! The distribution of population within Maricopa and Pima counties is uncertain, especially in Pima where nearly 90% of the population is either in Tucson or in unincorporated areas. I drew the lines based on my best guess. A further complication is that the 2010 census shows the state with 6.39m people, well below the 2009 estimate of 6.60m. This map is based on the 2009 estimates for cities and counties, which somewhere include 200k people who apparently aren’t really there. I suspect that a disproportionate number of these phantom people are in the bubblicious AZ9, but they could be anywhere. It will be interesting to see the 2010 census figures for cities and counties, but we don’t have those yet, so…
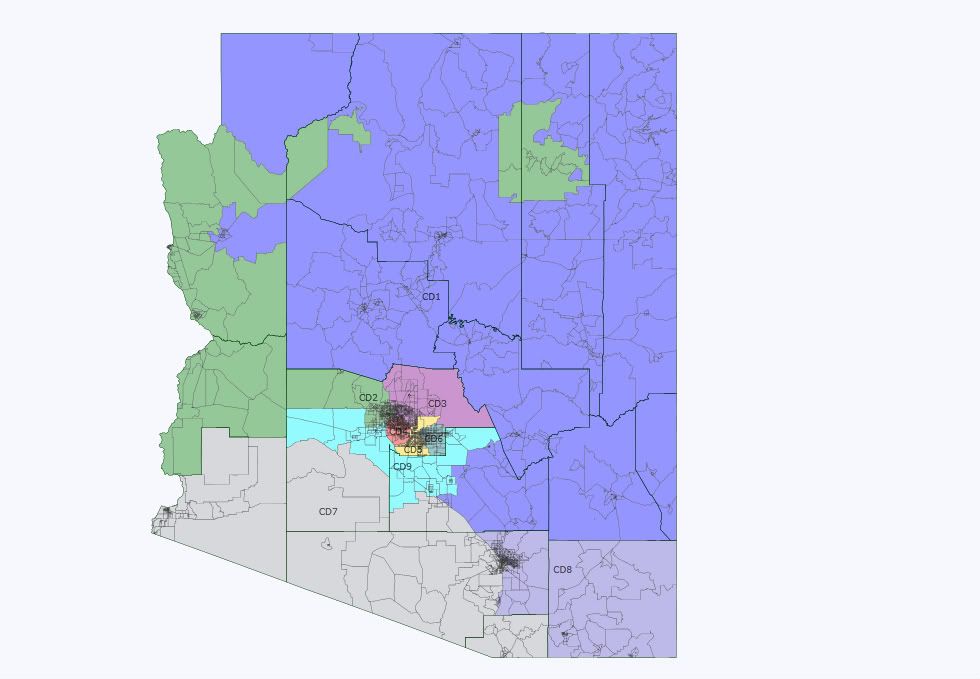
Here is the statewide map, with the usual color scheme.
And here is the close-up of the Phoenix area.
Now for notes on the individual districts. The target population for each is 713k.
AZ1 (blue): Paul Gosar’s district has an estimated population of 619k (less any phantoms) in its core counties of Yavapai, Coconino, Apache, Navajo, Gila, Graham, and Greenlee. That means it probably needs about 100k from somewhere else, either Mohave or the less populated eastern end of Pinal. I’m guessing that they would get about that amount from the Kingman area and the “strip” north of the Canyon in Mohave, and from eastern Pinal which has a lot of old mining towns that fit well with the rest of the district. Changes: loses some of south-central Pinal to AZ7, picks up Kingman and strip areas from AZ2 and one Pinal precinct from AZ8 (Giffords).
AZ2 (green): Trent Franks’ district will have to shed a lot of people, but even after losing the Kingman and strip areas and the (formerly?) fast-growing areas of southwest Maricopa, it retains its west valley base with Peoria, most of Glendale, Surprise, and the Sun Cities. I moved La Paz county here from AZ7, as with 33% of its population over age 65 it fits better in AZ2. The boundary shown here between AZ2 and AZ9 is just a guess and could move north or south depending on the final counts. As always, the Hopi reservation is separated from the surrounding Navajo reservation and attached to AZ2. I intended no change in the river-connector between the Hopi rez and the rest of the district, although it does not show up on the map.
AZ3 (purple): I drew Ben Quayle’s Phoenix-dominated district to lose some of its southernmost precincts to AZ4 (Pastor) and absorb north Scottsdale and Fountain Hills from AZ5 (Schweikert), but it appears that it grew faster than AZ5 did. The increase in the House vote from 2002 to 2010 was 34% in AZ3 and just 25% in AZ5, so it’s possible that AZ5 could retain its northeast end. AZ3 could also lose some of its western end to AZ2 if it turns out that AZ2 is too small after AZ9 fills up.
AZ4 (red): Ed Pastor’s Phoenix district started the decade with by far the least undeveloped land of the 8 districts and probably had the least new construction, but its House vote increased by 39% from 2002 to 2010. Its people still vote at a rate far below the state’s other districts (just 92k total votes; the other 7 were all over 150k and 6 were over 200k), so this increase may represent increasing Hispanic participation more than population growth per se. The Census estimated that Phoenix grew just 21% between 2000 and 2009 and it seems likely to me that most of this growth was in AZ3, so I drew AZ4 to pick up some of AZ3’s southern precincts. This may be the cleanest-looking VRA district in the country, and I drew it to stay that way. If it needs to contract, it would lose some of its southwestern precincts to the new AZ9.
AZ5 (yellow): I generally tried to keep existing districts together, but in this case I went for keeping cities together. David Schweikert’s district loses its Mesa piece to AZ6 while picking up the rest of Chandler. It now consists of Tempe (179k in 2009), Chandler (250k), Ahwatukee (85k in 2000 but probably more in 2009), and enough of Scottsdale (238k) starting from its south end to fill up to its quota of 713k.
AZ6 (teal): Jeff Flake’s district shrinks considerably and pulls entirely out of Pinal. It now consists of Mesa (467k), Gilbert (222k), and Queen Creek (26k) which put together would be big enough to make up a district if not for the phantoms. It could take Chandler-area precincts that I drew it losing to AZ5 as necessary to fill up.
AZ7 (gray): There are a total of 1.39m people (again, less any phantoms) in the four southern counties of Yuma, Pima, Santa Cruz, and Cochise, which is nearly enough to support two districts. Raul Grijalva’s district can pick up the necessary overage from the sparsely populated Gila Bend (I-8) section of Maricopa and the southwest corner of Pinal. If needed it could also retain La Paz, which as mentioned above is a poor fit for the district in my view. I don’t know where the border between AZ7 and AZ8 in Pima should go. I suspect that the AZ8 piece of Pima grew faster, as the House vote increase from 2002 to 2010 was 32% in the AZ7 section compared to 40% in the AZ8 section. I had AZ7 take the mostly-empty remaining sections of Santa Cruz and a few Pima precincts mostly west of I-10 or I-19 from AZ8.
AZ8 (blue-gray): I suspect that poor Gabrielle Giffords’ district won’t have to lose too much ground. Its House vote increased 41% from 2002 to 2010, but this may have been partly due to the 2010 race being a barnburner whereas 2002 was a snoozer. Cochise county grew 10% in the 00s and Pima 21%, and it’s likely that the AZ7 section of Pima grew at a decent clip so it seems probable that AZ8’s growth was less than its vote totals suggest. This district loses its small Pinal and Santa Cruz pieces and otherwise looks about the same as before.
AZ9 (toothpaste blue): The new district comes almost entirely from the fast-growing exurban Phoenix areas of southwestern Maricopa and western Pinal. It combines the Pinal portion of AZ6, some south-central Pinal areas of AZ1, the Phoenix-area piece of AZ7, and much of the southern end of AZ2. Its population centers include Avondale (85k), Buckeye (52k), Goodyear (64k), the city of Maricopa (45k) which oddly enough is in Pinal, most of unincorporated Pinal (161k), Casa Grande (44k), Apache Junction (34k), and probably a fair portion of unincorporated Maricopa (229k). This district may have the highest percentage of homes in foreclosure in the nation, and probably more phantoms than any of the other districts. As necessary it could take some of the eastern part of Pinal from AZ1 or the southern end of AZ2 to get up to full, which would affect the division of Mohave county between AZ1 and AZ2. Politically this district would probably start out tilt-R or lean-R but shift D as its Hispanic population starts to vote more. Flake won exactly 2/3 of the two-party vote in the AZ6 Pinal piece (30k total votes), although this was less than his districtwide margin. On the other hand, the very liberal Grijalva won 54% of the two-party vote in the AZ7 Maricopa piece (24k total). The current AZ2 is blood-red, but the piece it would lose to AZ9 is most likely younger, poorer, and more Hispanic than most of the rest of the district given that housing prices tend to be lowest in the furthest-out areas. Gosar did about as well in the Pinal section of AZ1 as he did districtwide, but the section that would be lost to AZ9 may differ from the section that would remain in AZ1.
Overall, Arizona presents a rare case where a new district can be created without fundamentally changing any of the existing districts. The state’s most explosive growth areas were nearly empty at the start of the decade and close enough together that combining them makes a compact, contiguous, sensible district that would pass muster in a commission-redistricting state. AZ2, AZ6, and AZ7 lose a lot of territory, but almost everyone who lived in one of these districts in 2002 and stayed put will still be in their old district. None of the current House members are likely to be helped or hurt much. Grijalva will be glad to be rid of La Paz but not so much his Phoenix-area precincts, and Gosar would like to pick up some of Mohave, but these are marginal changes.
Thoughts?
This is very similar in many ways to versions I’ve come up with. While I’ve never considered an AZ-9 that didn’t include parts of chandler or gilbert, after looking at your map, I must say it does seem possible. Also kudos on keeping all the tribal lands together (I mean each together with itself). I’ve seen quite a few maps that split them and that just isn’t going to happen due to the commission.
I think the commission will opt to keep Grijalva’s district fairly intact because of the VRA majority minority requirement. I couldn’t make out your line between 8 and 7 through Tucson, but 7 will keep the areas that are more heavily hispanic and won’t likely pick up much from 8’s predominantly white areas. I also would think that the Colorado River Reservation (in La Paz) will be kept in 7. This would represent the strip on the Western edge of the county, but while it may be a significant portion of La Paz’s population, the county has very few people in it. By contrast, the heavily populated Pinal county precincts that you have Giffords losing are considered exurban Tucson. I’m not sure why the commission would cut Saddlebrook from 8 instead of something more in the heart of the city.
Also, I have a feeling that most of the population growth in Maricopa county was in South Phoenix and the Southeast metro (Chandler, Gilbert, Mesa).
I would like to know what the percentage minority you got for your 4, 7 and 9. Could you please post that?
Done now.
I actually think the commission should and very well might avoid splitting anymore counties then required.
So I would love to see Yuma county not split. Does it really accomplish any purpose in this map but making your moves in Maricopa county easier?
Plus the ugly stepchild of AZ-Pinal county deserves to be kept intact.
It seems to be doing those thing would make a move around North Maricopa county easier for CD9 but that’s just me.
AZ is an interesting state because, as you mentioned, there’s only one reasonable place for AZ-9 to go: the Phoenix Exurbs, and more specifically Pinal combined with parts of the West Valley. Then there are only 2 variables here IMHO:
1) whether you want AZ-9 to wrap around the North or the South of Phoenix.
2) Whether the Hopi reservation goes in AZ-9 or stays in AZ-2.
The only alternate configuration I can think of is putting the Hopi reservation in AZ-9, moving the Colorado river areas to AZ-1, moving the Southern part of your AZ-1 to AZ-9, and having AZ-2 shrink a lot to just a West Valley seat (which is kind of what it is now – most of its land area is sparsely populated and has been ignored by its Rep for decades.)
I’m just about to go to work so I don’t have time to dig into every detail of this map, but on the whole it looks pretty strong. The only thing that really sticks out to me is AZ-09. Retiree-heavy Apache Junction to middle-class, majority Hispanic suburb Avondale? Yes, all the areas in there are suburban/exburban, but I don’t know if that’s the ideal way to group everything together.
I always wondered why CD-2 which is mostly west Arizona has that part of east arizona roped in. I used Daves App and it wasn’t a significant amount of people. Does anyone have any insight on that district?
If the commission wants the new AZ-09 to be a swing district that might be a great way to do it. That being said, generally speaking, an East Valley+Pinal District is going to make more sense from a community of interest POV than a West Valley+Pinal District, the biggest reason being that it’s a lot easier to drive between the latter than the former. That would make AZ-09 more conservative, but you’d wind up with another district (AZ-03? AZ-05?) which ends up swing.
Kingman is the only part of Mohave County that would make any sense in AZ-01, so if you’re going to move into Mohave County (and my personal preference is to see AZ-01 move into Cochise County, but it’s hard to say which is more viable).
Giffords probably would have lost in your AZ-08 last year. It’s still more or less a swing district, but bear in mind that you pulled out a lot of the blue precincts, so it’s going to be a point or three more Republican.
I’ve said a few times before that I think it makes more sense for Grijalva to lose his portion of Pinal County or maybe even some of the whiter parts of Yuma County, just because the Hispanics in his portion of Maricopa County vote at better rates than those in his portion of Pinal or Yuma Co. This is probably the district that concerns me more than any others on your map. Before the commission creates a 41% Hispanic district they’re probably going to want to make sure that the current Hispanic district is allowing Hispanic voters to select the candidate of their choice. If you look at precinct-level results in Hispanic areas, McClung was definitely not that candidate (maybe by a 2-1 margin), but it seems at least possible that she could be their representative anyway under this map. I don’t know, it’s dicey, like, what are you supposed to do when Hispanics don’t bother to vote? And also, the VRA doesn’t consider citizenship, which makes districts look a lot more Hispanic dominated than they actually are at the voting both here and in the Tejano districts.
Ultimately, because the commission is supposed to at least consider the Baja Arizona Hispanics’ interests at a more in-depth level than they are required to by federal law, I see AZ-07 getting more Hispanic, not less. But who even knows? It’s worth watching.