This is just a very short diary–
As we all know, district lines aren’t fair due to Gerrymandering. Most suggestions to remove the bias of this are based on a compactness measure- drawing districts that resemble squares or circles as close as possible.
But that is not actually fair, due to the fact that Democrats are packed in cities and Republicans spread out in rural areas. An application of Tobler’s Law therefore results in a natural Republican bias in compact Gerrymanders.
StochasticDemocracy therefore determined the ‘fair’ share of Congressional districts Democrats should receive in any state by calculating the Weighted 2010 Congressional Averages by Voting Eligible Population- therefore getting rid of both the impact of illegal immigrants (who get counted in the Census but don’t actually get to vote) and under-age residents.
We then apply a universal swing- so that the average Congressional Democrat received 50% of the vote. If the districts were fair, we would expect Democrats to win roughly the same percentage of seats in a state that they win in terms of votes.
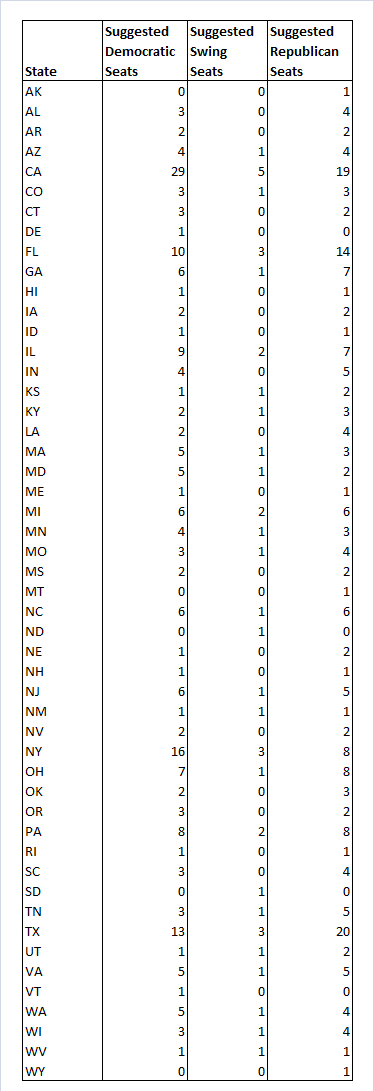
We can use this to approximate the ‘fair’ amount of Democratic, Swing and Republican seats there should be in a state as follows:
The number of safe Democratic seats should be the percentage of votes that Democratic candidates would receive in a neutral national year, minus 5% , multiplied by the number of seats the state has, rounded to the nearest integer.
The number of safe Republican seats should be the percentage of votes that Republican candidates receive in a neutral year, minus 5%, multiplied by the number of seats in the state, rounded to the nearest integer.
The number of swing seats should be the total number of seats minus the sum of Democratic and Republican seats.
With that, we arrive at the following table of ‘ideal’ state maps:
Here is our challenge to Swingnuts: In how many states can you draw fair maps? A failure to do so would show an obvious problem not only with the political nature of gerrymandering, but also with the political system in the US in general.
There probably will be a fair number of states in which fair maps are impossible- having done some redistricting, I’m fairly sure that no one will be able to draw 3 safe GOP seats and 1 swing district in Massachusetts- even 1 safe GOP seat would be huge. It is certainly also impossible to draw three safe Democratic seats in Alabama.
But- prove us wrong- or prove that the political system of the United States is unviable.
EDIT:
This would for example be a very clean 5-2-1 Maryland map.
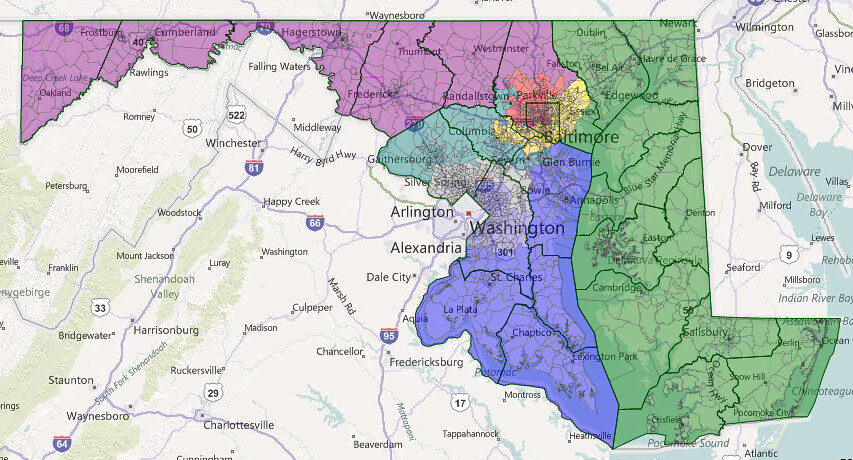
Blue: 53.1-46.9 Obama (D+0- Swing)
Green: 43.2-56.8 McCain (R+10)
Purple: 42.0-58.0 McCain (R+11)
Red: 81.3-18.7 Obama- 51.9% Black VAP-39.1% White VAP
Yellow: 59.9-40.1 Obama (D+7)
Teal: 64.8-35.2 Obama (D+12)
Grey: 75.1-24.9 Obama
Greyish Blue: 91.8-8.2 Obama, 62.8% Black VAP.
Edit
And a quick 1-1-1 NM map:
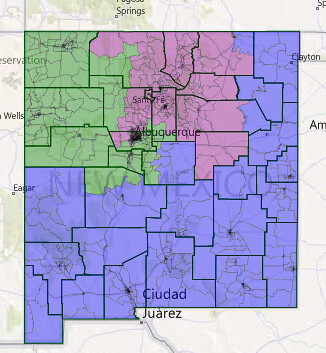
Blue: 53.6-45.0 McCain- R+8
Red: 53.1-45.5 Obama- D+0
Purple: 68.6-30.2 Obama
I’m curious as to why Wisconsin, a state that has been slightly Democratic for awhile now, ended up with 3 Dem, 4 GOP, and 1 swing in this system?
districts has been a common one of mine here for several months. The democratic voting strength in most states is very intense and depth but is limited geographically.
In most states not all. Compare these two states.
1. MA–61% Obama but democratic strength is spread throughout the state. Yes the GOP could gerrymander 3 seats out of this state but its now 10D-0R.
2. WA-57% Obama state but democratic strength is heavily centered in Tacoma & Seattle. Currently 5D-4R.
Those two states in essence is the D challenge. That’s also why we have seen 14-4 maps for IL with Chicago being attached to Kankakee and so forth.
That being said in 2008 the D’s won 53% of the national vote and won 58% of house seats. That has been the pattern for the D’s, except for a few elections, since 1932. So no moaning folks as the D’s have exceeded their % of house seats versus Presidential votes in nearly every election since FDR. So if one wants to be fair the GOP should have won 260 house seats in 1972!!!
Here’s Washington:


The Republican districts are the purple (3rd), red (4th), yellow (5th), and pink (10th) ones, and the swing district is the green (2nd) one. The 10th district is actually more of a lean Republican district, it probably has a PVI of R+2-4. If Dave Reichert, who lives here, wins the Republican primary, he will win it with 60% or greater. But if Doc Hastings who also lives here wins the primary, I could see King County (which actually is a majority of the district’s population) voting strongly against him and giving the seat to a Democrat. I would expect Hastings to move to Yakima and run in the 4th.
D districts:
Blue – 64.8% Obama
Green – 74.3% Obama, 51.3% black VAP
Sky blue – 59.5% Obama
Magenta – 59.8% Obama
Light green – 60.6% Obama
R districts:
Purple – 58.8% McCain
Red – 56.8% McCain
Yellow – 54.6% McCain
Teal – 62.8% McCain
Light purple – 59.0% McCain
Swing district:
Grey – 54.1% Obama
I’m working on Arizona right now. 4R, 3D, 2 Swing would be sooooo much easier. Say hello to Navajo Rez to Tempe!
The GOP votes in the state are distributed too evenly. MassGOP tried to do a Republican Gerrymander of Massachusetts and the best he could come up with was 7-1-1, using the 2008 vote anyway. If you used the Scott Brown election or our most recent GOV race, I’m sure you could come up with more Republican districts, but they wouldn’t really be safe, since neither of those votes reflect typical voting patterns in Federal elections.
If what you’re worried about is a pro-Republican bias, then all that is necessary is for Republican vote shares to be transformed into a similar seat share as the equivalent Democratic vote share would. I think the cube rule could be a good target. It’s just too hard to get proportionality out of first-past-the-post seats.
State:
Detroit area:
D districts:
Red, green, light purple (Ann Arbor/Lansing), dark purple, yellow Detroit-area districts, and the magenta Flint/Saginaw district.
R districts:
Blue UP district, sky blue mitten/Lake Michigan district, brown, pink, and light purple western districts, grey suburban district.
Swing districts:
Green western district (Kalamazoo/Battle Creek/Muskegon) and teal Macomb County district.
These would not be “safe” Democratic districts, so to speak, but the green, yellow, and grey districts in the map below would be narrowly Obama, and should certainly be expected to elect Democrats in a ‘normal’ year.
Was there some reason for a 5% swing marker? I feel like there should be more swing seats. If you take congressional districts on an individual basis, a 7.5% swing is certainly possible. It would also seem to account for the fact that there aren’t a whole lot of “neutral” years.
Also, it’d be a heckuva lot easier to do the maps in places like Massachusetts, if some of the safe seats were swingy ones.