As a native Virginian and Democrat, I was very excited when Dave was able to add voting data for Virginia to his redistricting app because of how it would ease tinkering with Virginia.
Naturally, the map I produced here is entirely unrealistic, if not because of the shape and scope of some of the districts I drew but because of the fact that the GOP controls the Virginia House of Delegates and the governor’s mansion. With the Democrats controlling the State Senate, it seems likely that a incumbent-protection map will be drawn this time around.
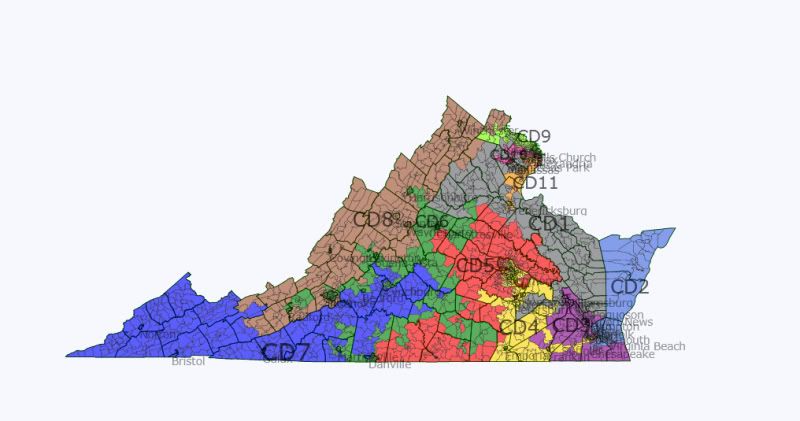
However, I set this map up to create the opportunity for Democrats to control seven of the state’s eleven House seats. The result was more or less a 6-1-4 map (7-4), with a D+3 seat in the Tidewater as the swing-iest district.
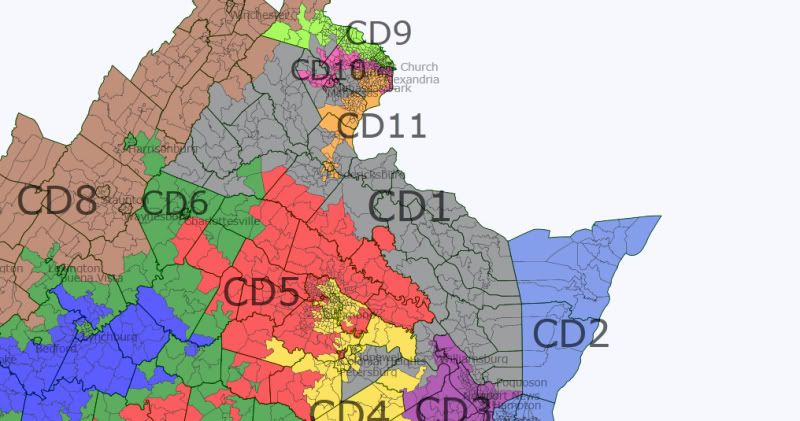
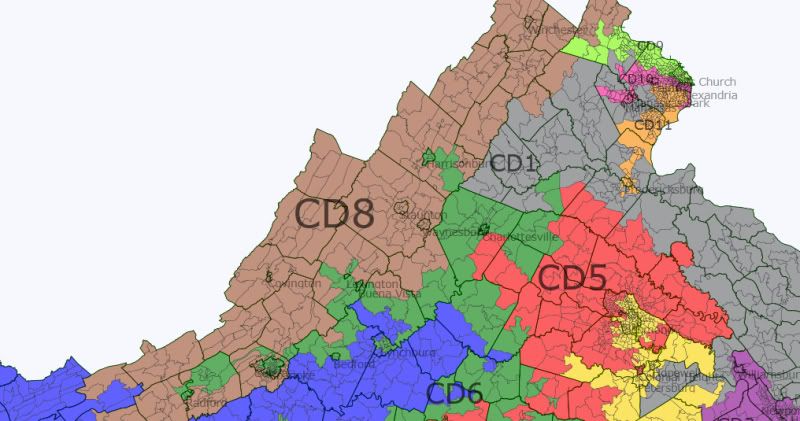
Without further adieu, here is the final product:
VA-01 (Gray)
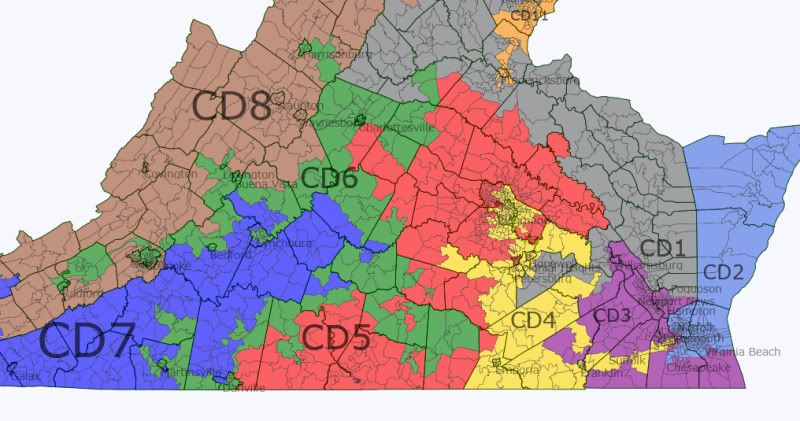
Appropriately, we’ll start with CD-1, which stretches northwest from its most southern point in eastern Hampton in the Tidewater (as well as below Richmond) to the edge of the Blue Ridge Mountains in Greene and Madison Counties, as well as all the way into the outer D.C. suburbs. Clearly, communities of interest did not come into play with this map.
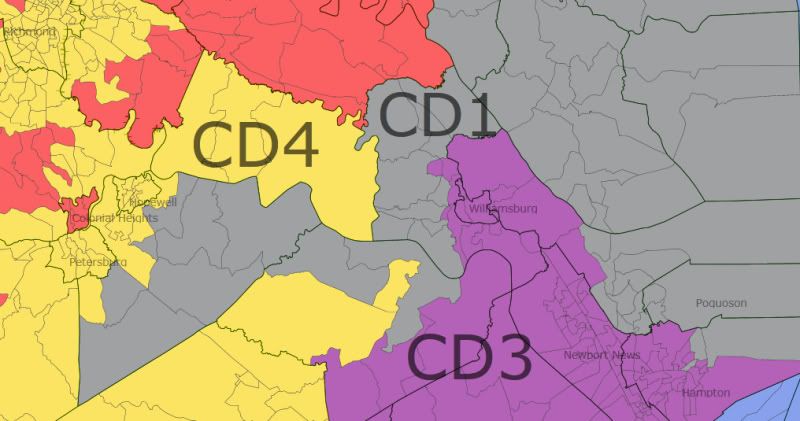
Here’s the part that goes south of Richmond and Petersburg and down into eastern Hampton:
And the northern part of the district:
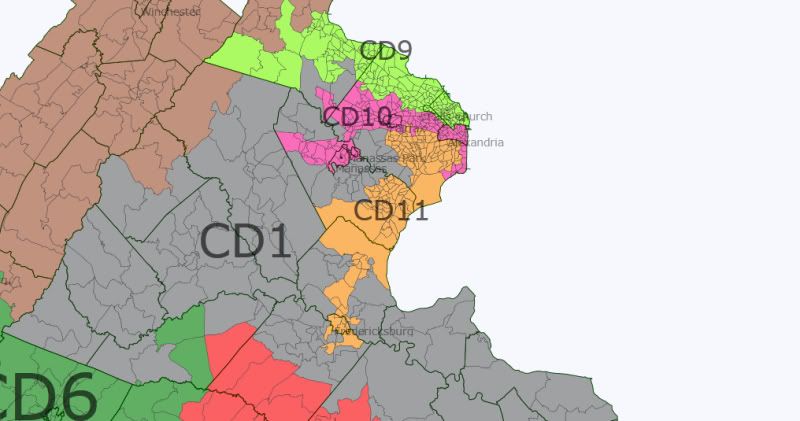
The statistics for this district as follows (NOTE: Dev. stands for deviation from the ideal population total):
VA-02 (Blue)
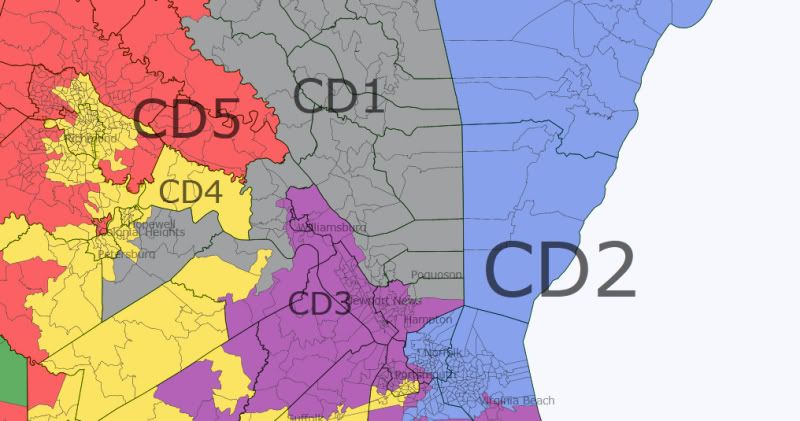
The Virginia 2nd is the most contestable district on this map with only a slight Democratic edge. Encompassing the Eastern Shore, part of Virginia Beach, and part of Norfolk, it could be best held by an ex-military moderate Dem, given the large military community in the area. Just don’t bring back Glenn Nye, please.
Here is the Virginia Beach/Norfolk part of the district, with the city outlines highlighted in pink:
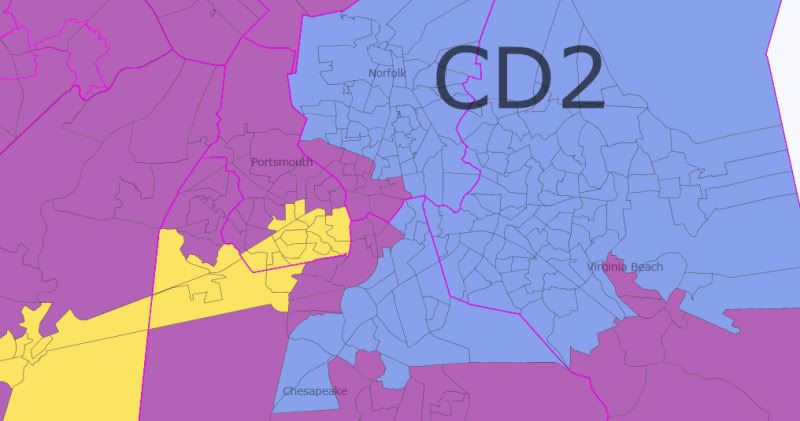
The most Republican parts of Virginia Beach and Chesapeake are taken by VA-03 to give this district its slight Dem lean.
And the statistics for this district:

VA-03 (Purple)
The third Congressional District takes up parts of the current VA-03 represented by Bobby Scott but is not a minority-majority district.
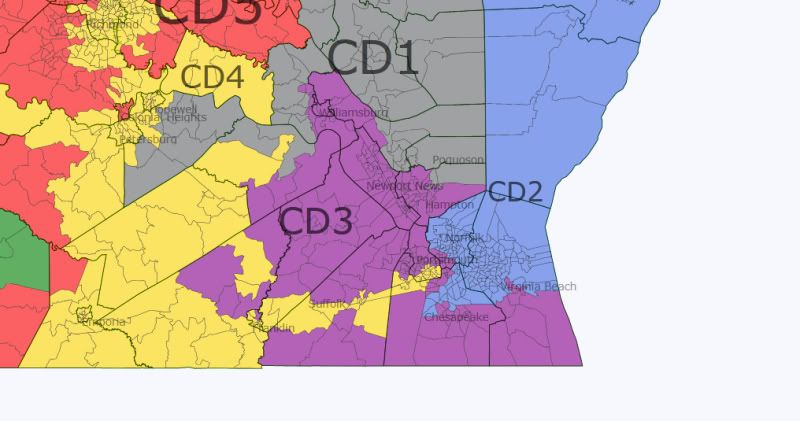
It is not a strong Dem district but it has a very solid Democratic base in its portions of Hampton, Newport News, and its small parts of Norfolk and Portsmouth. If I had left the parts of Chesapeake and Virginia Beach that are in this district in VA-02, I could have made that district about 50-50 and this one more than 60-40 but again, I was trying to make a map with a good shot at seven Democratic representatives.
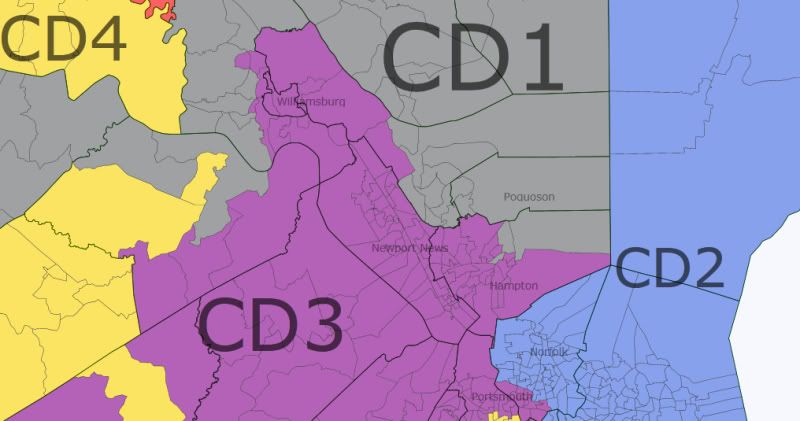
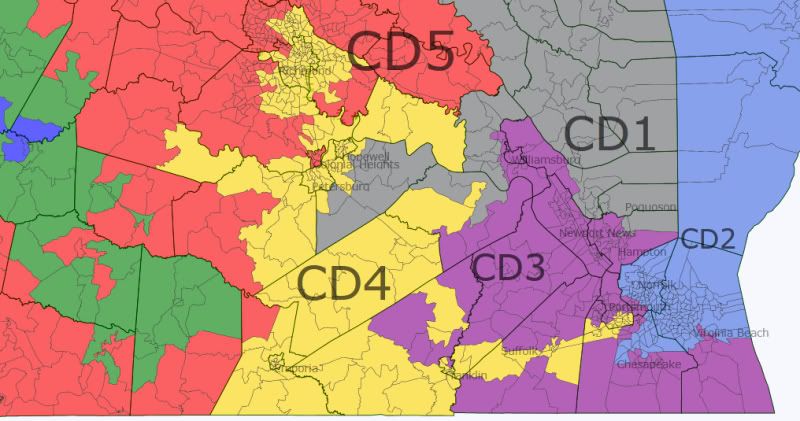
Here is the part of the district that winds around central Suffolk. One side goes into the southwest corner of Suffolk, which is one of the fastest-growing cities in the state, growing more than 25% between 2000 and 2010. The other juts into Southampton County above Franklin, taking one precinct from that small independent city (a 52-48 McCain precinct).
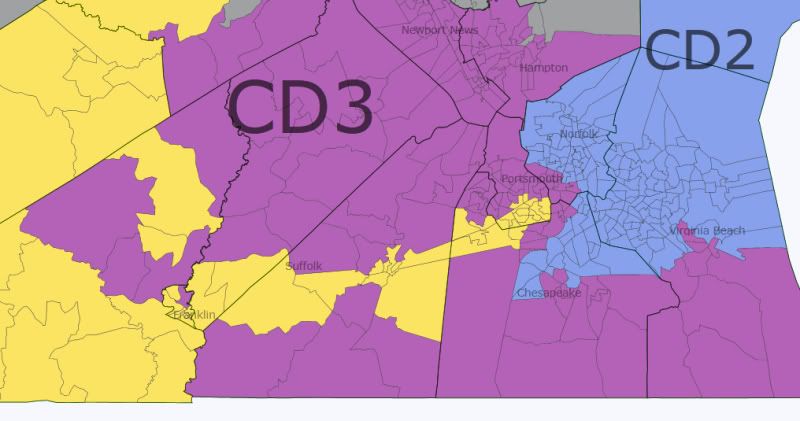
Here’s the Newport News/Hampton section of VA-03, also encompassing the city of Williamsburg with its university population from the College of William & Mary.
Lastly, the statistics for this district:

VA-04 (Yellow)
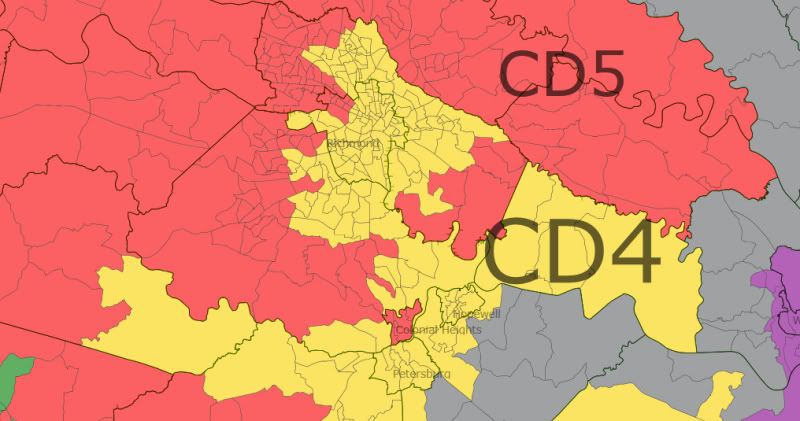
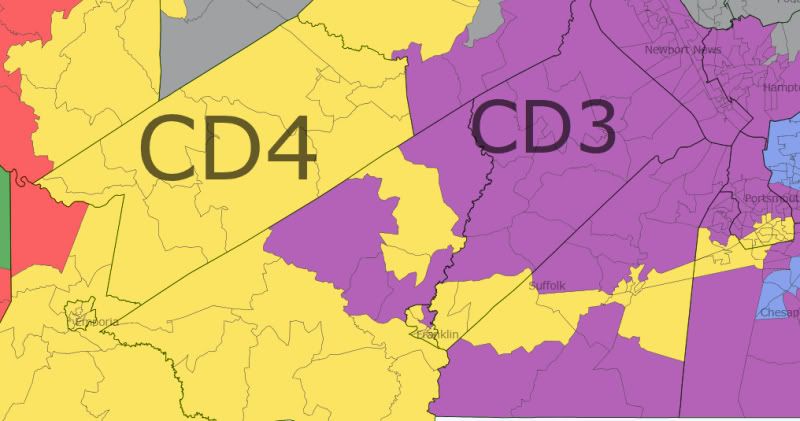
Here we have the VRA required minority-majority district. Fifty percent of the population is black; it is also about 6.5 percent Hispanic. It is chiefly made up of the state capital, Richmond, as well as probably the most African-American city in the state, Petersburg. It stretches down into Emporia and all the way east through Suffolk, Chesapeake, and into Portsmouth to also pick up more minority-heavy precincts. I would have preferred to leave the district at 46 or 47 percent, with blacks + Hispanics equaling over 50 percent but I’m under the impression that the law and the nature of Virginia politics would necessitate the minority-majority district having at least a 50 percent African-American population.
Here is the Richmond, Petersburg, and Hopewell section:
And the Suffolk and Portsmouth part:
The statistics for this district:

VA-05 (Red)
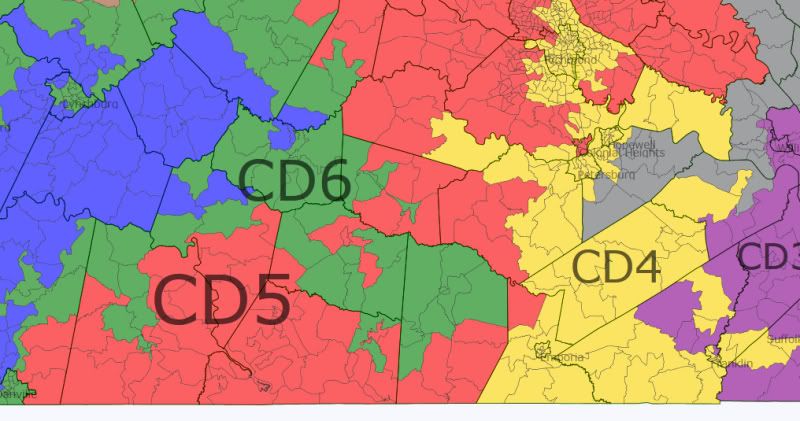
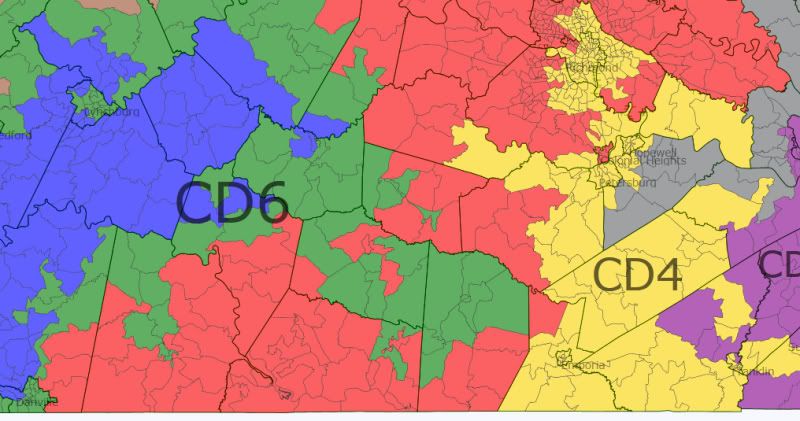
Despite what it may look like, this district is contiguous. Barely.
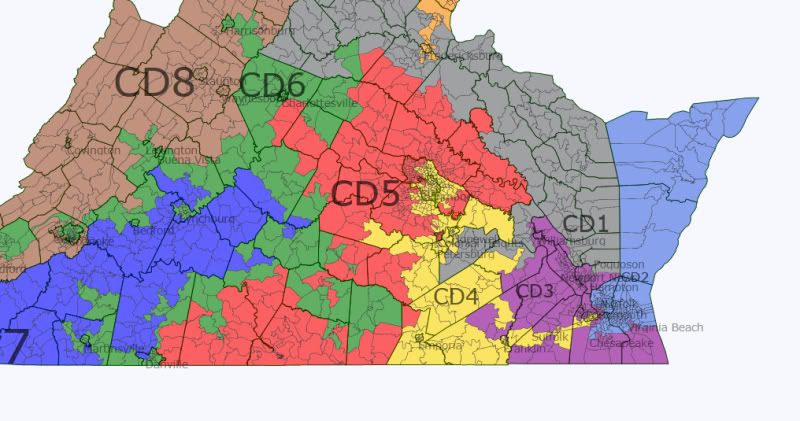
The district is made up of suburban Richmond and snakes all the way down to and along the North Carolina border for quite some distance. Just north of Emporia, at the top of Greensville County, the district barely connects west to part of Brunswick County to remain contiguous.
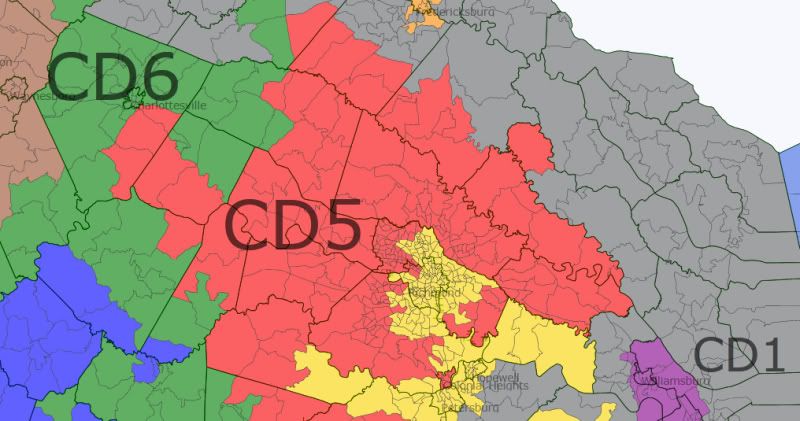
The district also makes its way up north to part of Spotsylvania County, not far away from what Virginians typically refer to as Northern Virginia.
VA-06 (Green)
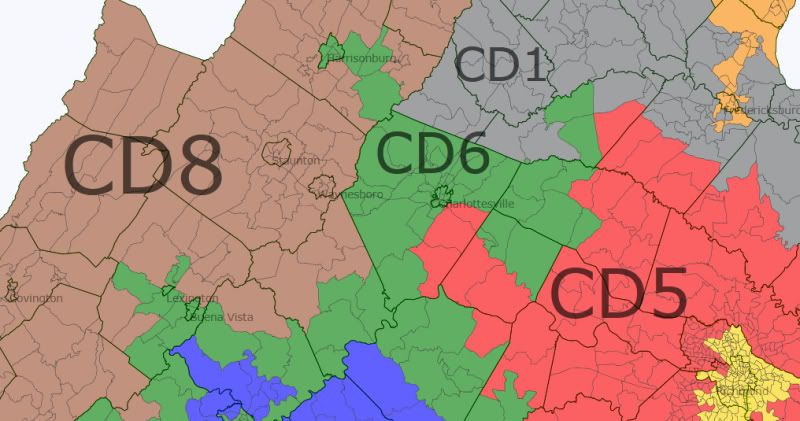
The most convoluted and gerrymandered district on this map is most certainly the sixth district. A friend of mine looked at what I had created and called it the “Virginia Python,” which seems an apt name for it. It essentially connects a series of college towns and strong minority areas to form a fairly Democratic district.
In the northern part of the district we have the liberal bastion of Charlottesville, where my alma mater, the University of Virginia, is located. Surrounding the city is Albemarle County, an increasingly blue part of the state. The most northern part of this district, however, is my home city of Harrisonburg, which is a university town as well (James Madison University and a small Mennonite college). The demographic trends of that city are the kind you want to see in a Democratic district. It has gotten bluer and bluer with each Presidential election as both the student population and the Hispanic population have grown steadily. In fact, the city of Harrisonburg is, per capita, one of the most diverse cities in the state. Each of its five precincts is over 8 percent Hispanic, with two having 16 and 18 percent, and one with 28 percent.
You’ll notice that the district also extends to Lexington in the west, the home of Washington & Lee University (and the Virginia Military Institute, though I expect it is not the major source of the town’s 61 percent Obama vote).
Moving southeast, the district meanders through parts of southern Virginia that have heavy black populations, as well as another university town, Farmville, where Longwood University is located.
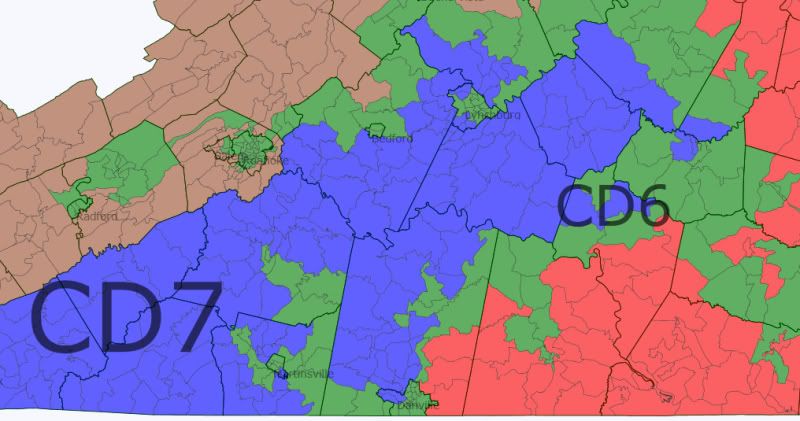
Lastly, as we move southwest, the district passes through the most Democratic parts of Lynchburg but more importantly this part of the district makes its way down to Roanoke, Blacksburg, and Radford. Roanoke is the largest city in the western part of the state, with about 97,000 people as of the 2010 census. Blacksburg, the home of Virginia Tech (the state’s biggest university) and Radford (home of Radford University) are also blue areas this district takes in.
To the very far south, the district adds in the fairly African-American cities of Danville and Martinsville, as well as the areas of Halifax, Pittsyvlania, Henry, and Franklin Counties that are more Democratic.
The statistics for the “Virginia Python”:

VA-07 (Navy Blue)
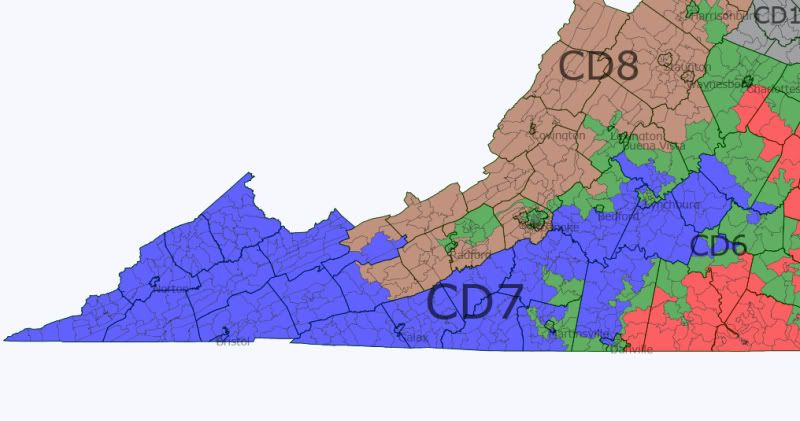
This is the most conservative district on the map, stretching from the far west corner of what is really Southwest Virginia (SWVA) into the more central southern part. SWVA has a strong union tradition in some of its counties due to the coal industry; however, the strength of unions and Democrats in general is clearly on the wane, illustrated by the surprising (to some) loss by Blue Dog Rick Boucher in the current VA-09 that makes up much of this area in 2010.
VA-08 (Brown)
This conservative district makes up much of what is currently the VA-06 represented by Republican Bob Goodlatte. It stretches from Wytheville in SWVA to Winchester around the Maryland border.
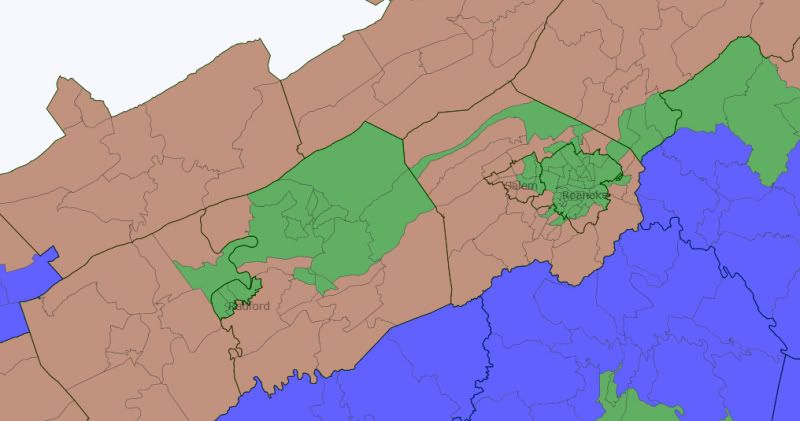
I drew VA-08 to curl around Radford, Blacksburg, and Roanoke while taking much of Salem (a much more conservative independent city than most any part of Roanoke right next door). Here’s a close up of that:
The statistics for this district:

VA-09 (Neon Green)
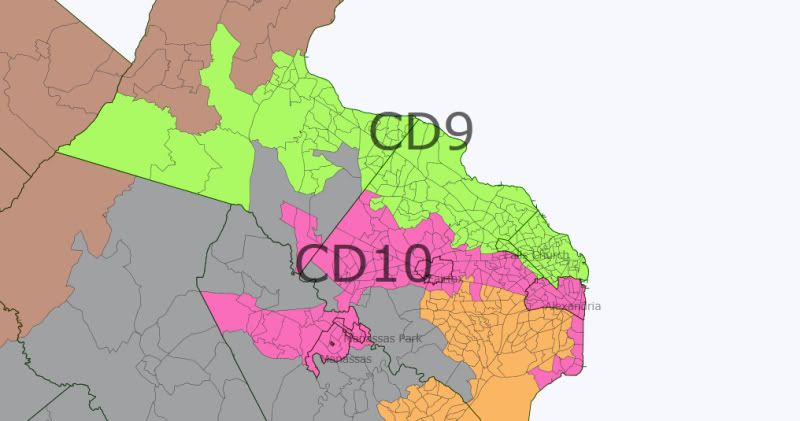
Finally, we have reached Northern Virginia (NoVA), the strategic lynch-pin in all Virginia Democratic strategies from here on out. This is the area of the state that is key to the transformation of Virginia from a sure-thing in the Republican column to its new status as a swing state. In drawing three NoVa districts, I wanted to create a fairly well-balanced trio that would all be strongly Democratic. VA-09 is the “Arlington” district in NoVA, encompassing the very blue county that abuts Washington, D.C. The district also makes it way through Falls Church and out all the way into the more developed and liberal parts of Loudon County, the fastest growing county in the state, which saw a more than 30 percent increase in population from 2000 to 2010.
The statistics for this district:

VA-10 (Pink)
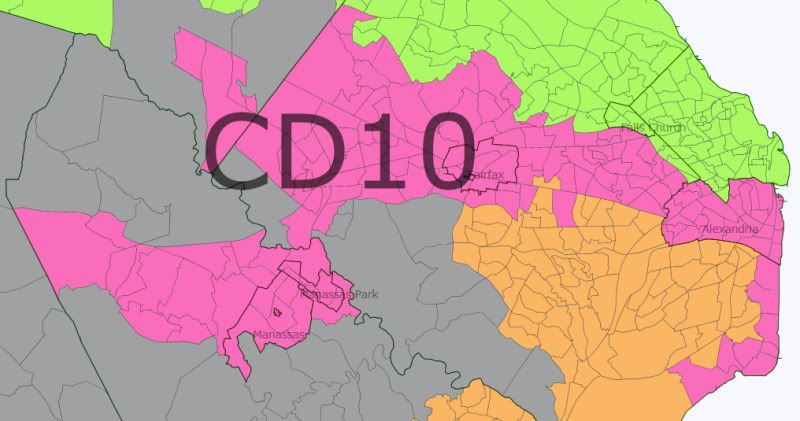
VA-10 contains all of Alexandria, one of the bluest cities or counties in Virginia, but also meanders out through Fairfax City, and all the way west to Manassas, taking in large chunks of Fairfax County, the state’s most populous entity (over 1 million people) in the process. The demographic and political trends of this area are generally favorable for Democrats, and having Alexandria in it almost guarantees that the district would remain blue even in the worst year for Democrats.
The statistics for this district:
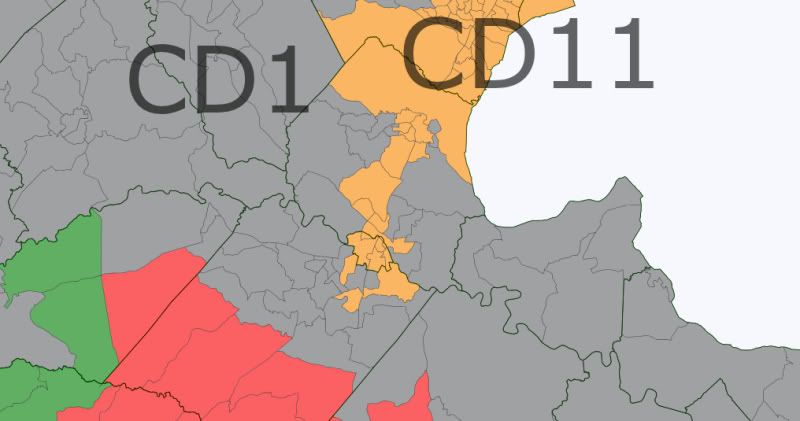
VA-11 (Orange)
Lastly, VA-11 is made up of most of the most Democratic sections of Fairfax County (those directly next to Arlington and Alexandria) but runs through the Democratic-trending Prince William County and all the way to Fredericksburg, a growing city that is also a university town (Mary Washington University) and whose suburbs in Stafford County are increasingly Democratic.
The overall statistics for the districts on this map:

Clearly, the four GOP districts are all vote sinks that would be sure-things in every election. Perhaps from the state party level this is not a great situation for Democrats because the VA GOP could focus all its resources on VA-02, as well as VA-06 and VA-03, without risking its hold on VA-01, VA-05, VA-07, and VA-08. At the same time, this map gives Democrats a good shot of holding seven seats a fair amount of the time, or at least six (a majority). Anyway, thanks for reading, Comments are definitely appreciated.





with leaving #9 down in SW VA. Kudos to that.
This is the type of map that a legislative body could draw. I might add your approach in SE VA shows that dividing the AA community between the North & South Norfolk area creates two D chances for seats.
There has been maps here that people have posted with a second AA majority seat in SE virginia. Its cleary a racial gerrymander and no court would order it drawn in this post Shaw world even as its somewhat geographically compact.
This map is sweet for the D’s but is unlikely to be drawn either legislatively or by a court this cycle.
This map is a monstrosity (I mean that only in the best possible way! :P).
Now I just think about how tame my map looks in comparison!
You might want to check your numbers for VA-05; they’re clearly off.