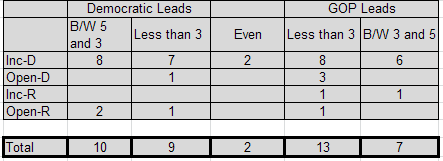
I have been tracking polls closely for 15 years, but I must confess I have never tracked House polling in great detail until this election. So it was a real shock when I compared the tracking I was doing with some of the predictions about overall control of the House. This diary is going to do something I haven’t seen anywhere else: look at non-partisan polling and see what we actually know about the race for the House.
Before I get to the data, though, I want to make a couple of observations:
1. Most House races are never publically polled. Since September 15th, 99 out of 435 races have had public polls. Moreover, in more than half of these races, there has been only one public poll. Of course, many races are never polled because they aren’t competitive, but in fact a large number of races that people like Cook rate have no public polling at all.
2. This means most orecasters are relying on campaign polls to build their forecasts. Cook has argued that these polls are more reliable than public polls, and he may be right. One thing is for certain: basing your forecast on private polling by campaigns absolutely makes your forecast susceptible to spin. Someone like Cook may be able to sort through that, but fundamentally forecasts of House races are based on far less data than Senate races.
3. Much of the reporting on House races has involved reporting on partisan polls. Steve Singiser does that here. Nate Silver reviewed these polls, and found “Polls with an explicit partisan affiliation are on average about 6 points friendlier to their candidate than those conducted by independent groups.”
Put another way: they are junk. But they are being treated as reliable in many places, including on the front page here.
So let’s get to the data. You can access all of the data
here.
When I did the calculations last night I was shocked. There are 41 seats within a week out!! AND THIS NUMBER IS ALMOST CERTAINLY TOO LOW. Because we don’t have data from all of the districts, don’t take this to mean the GOP at this moment isn’t leading in enough seats to take the house. While the public data covers most of the competitive races, it by no means covers all of them. There are ALSO districts that haven’t been polled because the GOP lead is presumed so large it isn’t worth it.
But what the data clearly shows is the House is still very much in play. The GOP leads in many districts are far more tenuous than general reporting suggests. Moreover, the data on the House is far thinner than most believe.
I am not going to sugar coat things, here. Another metric I track shows the GOP in a very strong position (more about that later this week). The average swing in House Polling since October 20th is 16.47%. This implies a generic ballot of GOP +6 (since the Dems won the generic ballot in 2008 by 10.4%). That is a huge swing, though nowhere close to what Gallup is finding.

