SSP Daily Digest: 6/4 (Afternoon Edition)

AR-Sen: I don’t know if this is outright shenanigans or innocent bureaucratic bungling, but a lot of eyebrows are being raised over a strange turn of events in Garland County that’s going to lead to long lines and voters avoiding the polls. The county, with a population of 80,000 and 42 precincts, will have a total of two polling places for the upcoming runoff election. Worth noting: Garland County (home of Hot Springs) is the most populous county in Arkansas that went for Bill Halter in the primary.

IL-Sen: The Mark Kirk story seems like it’s finally catching hold in the Chicago market. At the link, you can check out the whole “misremembered it wrong” story splashed across the front page of the Chicago Sun-Times, and watch a withering WGN news story.

WA-Sen: Dino Rossi has reported $600K in contributions in one week since announcing his bid. Anyone who is surprised by this number should get better acquainted with the term “low hanging fruit;” the interesting numbers will be the ones in future weeks to see how he does now that most of Washington’s major real estate and contracting players have, assumedly, maxed out. Also in the not-surprising file, state Sen. Don Benton dropped out of the race and endorsed Rossi. Benton was the more or less GOP frontrunner prior to Rossi’s entry, but also something of a Republican-establishment stand-in for Rossi with a lot of overlap in supporters, so there wasn’t much incentive for him to continue. Goldy correctly yawns at Benton’s departure, saying that Clint Didier (the Palin-endorsed teabagger in the race) was always the real speed bump for Rossi and one that’ll continue to pose a problem: he can’t run away from Didier and his supporters, whose enthusiasm he’ll need in November, but if he gets too close to them, he’ll lose whatever moderate image he once had, which he’ll also need in November.

CA-Gov (pdf): The last pre-primary Field Poll, or at least part of it, is out. All that they’ve released today is the Republican gubernatorial primary numbers, which are very much in line with everyone else’s numbers lately. They see Meg Whitman leading Steve Poizner 51-25, only half the 49-point lead she had in the last Field Poll in March but still certainly enough to get the job done for her on Tuesday. Keep your eyes peeled for the rest of the data.

NY-Gov: Maggie Haberman has an interesting retrospective of the big bag of Fail that was the Steve Levy campaign. She weaves together a number of threads that didn’t really make it into the national media — unwillingness to fully commit to the race, his reluctance to dip into his war chest, tabloid stories about law school friends — to paint a picture of a campaign that, in hindsight, was doomed from the outset.

AR-03: Sarah Palin (and the Susan B. Anthony List) weighed in in AR-03, adding one more “Mama Grizzly” to her trophy room. She endorsed state Sen. Cecile Bledsoe, who’s in a runoff against Rogers mayor Steve Womack for the GOP nomination in the open seat race in this safely-red district. Bledsoe only compiled about 15% of the vote in the primary, although with a huge number of candidates, that was enough to squeak by into second place.

NY-15: In case there was any doubt that a combination of age, sliminess, and having lost his Ways and Means gavel might prompt a last-minute retirement for Charles Rangel, they were laid to rest. He’ll be officially kicking off his next campaign this weekend.

OH-18: The long-unresolved GOP primary in the 18th appears to be finally over, as former state Agriculture director and 2008 nominee Fred Dailey conceded. He lost to establishment pick state Sen. Bob Gibbs by 156 votes according to certified results, and the automatic recount only changed two votes. While this is one more in a string of recent GOP primaries where the establishment candidate beat the teabagger, this, like many of those races (like, say, IN-08 and IN-09, and IN-03 and IN-05 if you want to call the woeful Souder and Burton “establishment”) where the anti-establishment candidate came within a hair of winning, and where if there had been fewer teabagger candidates spoiling the broth or things that just bounced slightly differently, the media would be talking about an entirely different narrative.

Media: So, speaking of media narratives, I’m wondering if the media are starting to dial down their “Dems are dooooomed!” narrative that’s been conventional wisdom for the last half a year. Not just because they may be noticing that the polling evidence for that is sketchy at best, but also, as this Newsweek piece points out, that they may have gotten suckered by the Democrats themselves, who seem to be engaged in the ages-old practices of expectations management, lowballing their predictions so they look like heroes later.

Ideology: 538 has some fascinating charts up as part of a new post on where states (and where the two parties within each state) fit on the liberal/conservative scale, looking at it on multiple dimensions instead of on a left/right line. West Virginia (socially conservative and economically liberal) stands out as an interesting outlier on the chart, which does a lot to explain its particular brand of politics.
SSP Daily Digest: 5/26 (Morning Edition)

  • AR-Sen: The Big Dog is coming back home to stump for Blanche Lincoln, the first time he’s done so this race. Meanwhile, the SEIU just tossed in another $100K for phonebanking and another $100K for field on behalf of Bill Halter. (There’s also an amusing negative $100K entry for “reverse phonebanking.”)
  • CA-Sen: Chuck DeVore is as insane as this ad. A true must-see. In news of the normal, President Obama kept to his promise to return to CA for two more Barbara Boxer fundraisers. The events raised $1.75 million, $600K of which will go to Boxer and the balance to the DSCC.
  • KY-Sen: Heh, that was quick. Rand Paul is already planning the dreaded “staff shakeup.” The only problem is that he can’t fire himself. Barring that, Mitch McConnell is telling his least-favorite fellow Kentuckian to shut the fuck up and hide under a rock – “for the time being.”
  • PA-Sen: I agree – this is a magnanimous move. Arlen Specter introduced Joe Sestak to his Senate colleagues at their weekly lunch yesterday. Very gracious.
  • AL-06, AL-07: Unsurprisingly, corporate lawyer Terri Sewell is the only Democrat airing TV ads in the primary to succeed Rep. Artur Davis, spending about $200K so far. With $783K, she’s far outraised her chief competitors, Earl Hilliard, Jr. ($328K) and Shelia Smoot ($100K). Sewell can also count among her contributors Sen. Kirsten Gillibrand and Starbucks CEO Howard Schultz.
  • Crazily, though, ten-term GOP Rep. Spencer Bachus is also airing ads in advance of his primary in AL-06, some $70K worth. Bachus has spent an amazing $680K on his campaign so far, even though his challenger, teabagger Stan Cooke, has raised just $29K total. This is the reddest district in the nation according to Cook PVI (R+29), which may explain Bachus’s anxiety, since he is the ranking member of the House Financial Services Committee and voted in favor of the bailout.

  • AR-01: A similar situation in AR-01 as in AR-02 below, where first-rounder David Cook endorsed the somewhat less-conservative Chad Causey over the extremely conservative Tim Wooldridge in (you might be a little surprised to hear me say this if you don’t already know the names) the Democratic runoff.
  • AR-02: Some runoff endorsements on both sides from the also-rans. Patrick Kennedy and John Adams (great names, huh?) both endorsed Robbie Wills in the Democratic race, while David Boling endorsed Joyce Elliott. I suspect national Dems would prefer Wills over the more-liberal Elliott, but this race is probably too touchy to get involved in.
  • DE-AL: Joe Biden returned home to do a fundraiser in Wilmington for John Carney. No word on whether he’ll also do one for Senate candidate Chris Coons, but it’s not like it’s a big schlep.
  • FL-25: The statewide Florida AFL-CIO, following the lead of its South Fla. branch, endorsed little-known longshoreman Luis Meurice in the Democratic primary, rather than Joe Garcia. The union, Florida’s biggest, backed Garcia in 2008.
  • IN-05: This is exactly the kind of weird that Dave Weigel specializes in. Tim Crawford, the teabagging “Democrat” who snuck to victory in the Democratic primary here, abruptly dropped out of the race after an unpleasant meeting with, you know, actual Democrats… and then wrote a long, rambly email saying he was un-dropping-out. Ah well.
  • IN-09: Speaking of Joe Biden, he’ll also be doing a fundraiser in late June for Rep. Baron Hill in Jeffersonville, Indiana.
  • NC-08: I would really freakin’ love to see Tim D’Annunzio pull this one off. The entire NC House GOP delegation just collectively endorsed former TV sportscaster Harold Johnson, terrified as they are of the spastic-fantastic Tim-diana Jones. If you don’t know what I’m talking about, click here stat.
  • RI-01: Scott Brown is coming to Rhode Island for a fundraiser with state Rep. John Loughlin, the GOP’s candidate in this open seat. To date, Loughlin’s raised about $344K, which might not seem too bad, but in fact he’s been running for a long time, since well before Rep. Patrick Kennedy announced his retirement.
  • VA-11: Businessman Keith Fimian has a new poll from McLaughlin & Associates showing him with a 36-23 lead over Fairfax Co. Supervisor Pat Herrity in the GOP primary. A March poll had Fimian up 29-17. Herrity had his own poll out last month, though, showing him with a 42-21 lead – and pointed out that Fimian claimed his internals had him just three points behind Gerry Connolly before election day 2008, but lost by twelve.
  • DSCC: Uh, good, I guess. The DSCC has cancelled plans to have EPA chief Lisa Jackson headline an NYC fundraiser next week – but what a retarded idea in the first place. It seems pretty inappropriate to me to have cabinet members doing hackwork like this (can you imagine Hillary Clinton or Eric Holder shilling for dollars?), but it’s even worse when you’re talking about the head of the EPA in the midst of the oil spill crisis in the Gulf. I also find it unctuous that the original invitation promised that the event would be “intimate, so each of you will have a real opportunity to get to know and to speak to Lisa about issues of concern to you and our nation.” Pretty gross when it’s our team selling access to the ultra-wealthy. Barf.
  • Ideology: Alan Abramowitz has a great piece up at the Democratic Strategist, looking at the correlation between ideology (as measured by DW-NOMINATE) and election performance by Republican senators. Using a modified eight-point DW-N scale, Abramowitz finds: “For every additional one point increase in conservatism, Republican incumbents lost an additional three percentage points in support relative to their party’s presidential candidate.” But shhh… don’t tell the Republicans!
  • Should Progressive Democrats identify as “Socialists”?

    The last item on 4/6 Afternoon Daily Digest about the relative popularity of “socialism” and Teabaggers got me thinking. If the GOP (or at least right-wing activists and opinion makers) is willing and eager to embrace the tea-party movement, why is it that Democrats continue to treat “socialism” as toxic? Certainly, its a losing proposition nationally (no Democratic candidate for president should EVER call themselves ‘socialist’). In some parts of the country though, my hunch is that progressives/liberals/Democrats/the left ought to revisit their assumption that ‘socialism’ is to American politics as oil is to water.

    The question I’m exploring here is:

    Where might ‘socialism’ have either 50+ favorablity, or at least net postitive favorability?

    The Gallop poll referenced here (http://www.gallup.com/poll/125645/socialism-viewed-positively-americans.aspx) was taken in January 2010. It found socialism at 36-58 overall, but at 53-41 among Democrats, and and 61-34 among liberals. Using Gallop’s own data on party affiliation and ideology by state (http://www.gallup.com/poll/125066/State-States.aspx), we can extrapolate views of socialism state by state:

    DC (adjusted by ideology): 41/48

    DC (adjusted by party affiliation): 47/47

    MA (by ideology): 38/53

    MA (by party): 40/54

    VT-ideology: 39/53

    VT-party: 39/54

    NY-ideology: 37/53

    NY-party: 39/55

    OR-ideology: 37/54

    OR-party: 37/56

    CT-ideology: 37/54

    CT-party: 38/55

    RI-ideology: 37/54

    RI-party: 40/53

    HI-ideology: 38/52

    HI-party: 39/54

    MD-ideology: 37/54

    MD-party: 39/54

    I’ll stop here. The states (and district) that I tested here are a few of the most left-leaning out there, yet only in DC under one method did I find socialism not to be a net negative, and only in DC did I not find it to be over 50% unfavorable. So unfortunately, the numbers don’t support my hypothesis. A few concluding thoughts on this:

    – My calculations assume that opinions of socialism are uniform nationwide among parties and ideological groups. This may not necessarily be true, but without state-by-state data on this question, I think this was the best I could do.

    – My guess is that views of socialism correlate more strongly to ideology than to party affiliation. In practice though, the numbers are similar regardless of which method you use.

    – The party and ideology data are from 2009. I think this may be a good thing though, since 2009 was in between a good year for Democrats and a bad one, so 2009 may be the year with data that best reflects the “starting point.”

    – A major problem that socialism has is that, in political terms, it has been defined by its opponents. No one (except perhaps for Bernie Sanders) in mainstream American political discourse ever sticks up for socialism. On the other hand, Republicans bash it constantly. Additionally, many Americans probably associate it with communism and the Eastern Bloc. Perhaps if the left made an investment in trying to “sell” socialism to the public, these numbers would improve.

    – A fundamental assumption that I have made, that a socialist would only be electable if socialism has a net positive favorability rating, is probably wrong on its face. Vermont, for example, elected a Socialist Senator despite socialism having a net rating of minus 14 or 15 there. Many self described Liberals hold statewide office in America, despite liberals being only 20-30% of the electorate in any given state, and nationally.

    – Related to the point above, Socialism actually seems to be viewed favorably by a larger percentage of the electorate than the percentage identifying themselves as Liberal. This holds true both nationally and in every state I tested.

    – In the long run, running away from labels isn’t a viable strategy. The American Left has been running away from the word “Liberal” ever since the 80s. People have thought its cute to call themselves “Progressives” instead, and Glenn Beck’s recent paranoid tirades against Progressivism are a consequence of that. What’s the next word we’re all going to flee to now that conservatives are saying bad things about “Progressivism”?

    – I really don’t like the term “Liberal”. Not because it doesn’t poll well, but because its actually really inaccurate. At least on economic policy, Conservatives are far more “liberal” than “Liberals” are. “Progressive” is probably better, because it implies a belief in using government as an instrument of social progress, but again, I don’t like the way that term is used by people who are afraid being called “Liberal”.

    – I consider myself a Socialist, or more specifically, a Social Democrat. This doesn’t mean I believe in Marx, revolution, the abolishment of capitalism, or anything else crazy like that. It means I believe in government as a means to establish a better, fairer society. I believe Big Government is not inherently good or bad, its what you make of it. I believe the free market is generally good, but never perfect, and that the job of Government is to fill the gaps of capitalism that too many people would otherwise fall through. My views are most in line with the Canadian NDP, or the UK Labour Party (pre-Blair and “New Labour”). I support single-payer health insurance, strong bank regulation, and cap-and-trade, but I believe in compromise. I’m a proud Democrat, I don’t do anything stupid like voting Green, I support Obama, and think “liberal No” votes are counterproductive. Were I in Congress, I would have proudly voted yes on the health care bill. I don’t think I have radical views (by international standards I’m center-left), yet the word that describes them best is politically taboo in America.

    – As a “bonus”, I ran the numbers two more times, first on New York according to the 2008 exit polls, which I thought have somewhat better results (41-53 by ideology, 38-54 by party). Secondly, I tried my hometown of New York City, using numbers from this (http://www.surveyusa.com/client/PollReport.aspx?g=c4719d83-23d9-4e1d-95a6-975f4e2562e4) poll from last year’s mayoral election. Here I found 37/46 by ideology, and 43/50 by party. I think its worth noting that opposition to socialism is at or under 50% here.

    Final Conclusion: Socialism probably doesn’t poll as well as I would have liked to see. Nonetheless, it seems to outperform Liberalism, and the stigma attached to it thus seems highly disproportionate. A candidate would almost certainly prefer to call himself a Liberal than a Socialist, yet this suggest that the “S” word is probably less of a liability than the “L” word. Certainly, a “Socialist” candidate should not have a hard time winning a Democratic Primary in areas where the Democratic nomination is tantamount to election.

    By what margin will Bob Shamansky win?

    View Results

    Loading ... Loading ...

    PVI/Vote Index for 2008

    One year ago I tried out an experiment where I plotted US Representatives’ voting records against the presidential lean of their districts, in an effort to identify what representatives were not the most liberal or conservative, but who most overperformed or underperformed their districts. After some hemming and hawing, it was called the PVI/Vote Index. The point of the exercise was to give some clarity and focus to one of the most frequently heard refrains of the liberal blogosphere: “We’re going to primary that ratfink so-and-so,” usually delivered without much consideration as to what kind of candidate that district might actually support.

    It’s time to revisit the topic, partly because another year has gone by, and aggregators have released another year’s worth of data, letting us look at the 110th Congress as a whole (instead of just 2007). Also, with the creation of the blogger/labor Accountability Now PAC for purposes of nudging (or primarying) recalcitrant Dems, with Progressive Punch adding a similar function to their website, and with even the Cook Political Report (subscription req’d) tipping a toe into this type of analysis, it seems like other people are starting to zero in on who is and isn’t a good fit for his or her district.

    As before, the Index is based on a pretty simple idea: rank every district from 1 to 435 in terms of how Democratic its presidential voting record is, rank every representative from 1 to 435 in terms of how liberal his or her voting record is, and find the difference, with a larger difference in one direction or the other meaning that representative is overperforming or underperforming the district’s lean. (There are a host of methodological issues that go along with this assumption, and I’ll discuss some of them over the fold. In the meantime, let’s get right to the numbers.)

    Let’s start with Democrats who are underperforming their districts (in other words, Democrats whose voting records are less liberal than their district composition would ordinarily support):

    Rep. District PVI PVI rank DW/N Liberal rank Difference
    A. Davis AL-07 D+17 65 – 0.286 183.5 – 118.5
    Meeks NY-06 D+38 6 – 0.397 122 – 116
    Meek FL-17 D+35 11 – 0.390 126 – 115
    Jefferson LA-02 D+28 28 – 0.371 139 – 111
    Doyle PA-14 D+22 42 – 0.363 142 – 100
    Engel NY-17 D+21 45 – 0.378 137 – 92
    Brady PA-01 D+36 9.5 – 0.439 96 – 86.5
    Sires NJ-13 D+23 39 – 0.398 121 – 82
    Berman CA-28 D+25 35.5 – 0.406 117.5 – 82
    Fattah PA-02 D+39 5 – 0.454 84.5 – 79.5
    D. Scott GA-13 D+10 112 – 0.257 191 – 79
    Moran VA-08 D+14 81 – 0.345 152.5 – 71.5
    Crowley NY-07 D+28 29 – 0.431 100 – 71
    Rush IL-01 D+35 12 – 0.455 83 – 71
    Lipinski IL-03 D+10 106.5 – 0.312 174 – 67.5
    Reyes TX-16 D+9 117.5 – 0.286 183.5 – 66
    Towns NY-10 D+41 3 – 0.492 69 – 66
    Harman CA-36 D+11 103.5 – 0.319 169 – 65.5
    Rangel NY-15 D+43 2 – 0.493 67 -65
    Cooper TN-05 D+6 144.5 – 0.211 208.5 – 64

    Three of the top four underperformers here were also in the top four last year: Artur Davis, Kendrick Meek, and Bill Jefferson, which indicates that the pattern is pretty consistent. (The fourth, Greg Meeks, not coincidentally the only African-American member of the New Dems besides Davis and Meek, replaces Charlie Rangel.)

    Notice something else interesting? We don’t have to primary any of those three! Jefferson learned the hard way that the future is Cao, while Davis and Meek are doing us a solid by opening up their seats to run for higher office. (And if they somehow win, they’ll immediately switch from goats to heroes in my book, since if they stay consistent policy-wise, they’ll suddenly be vastly overperforming the lean of their states as a whole.)

    But it does shine a spotlight on the open primaries in AL-07, FL-17, and LA-02. These primaries should be absolute top priority for blogosphere action: these are districts that can support progressives, not just centrists, and we have basically free shots at electing Better Democrats here. (These mostly-African-American districts may be a little outside the familiarity zone of the mostly-white blogosphere, but remember that one of our signature achievements is knocking off Al Wynn in MD-04, which is what can happen when the netroots and the local grassroots actually work in concert.)

    As with last year, the list is heavy on Congressional Black Caucus members, some of whom are also Progressive Caucus members. The latter may not be terribly fruitful targets (although, again, the primaries will be very important once they retire), who are being penalized a bit unfairly for living in some of the nation’s most Democratic districts. They’d need to be in McDermott/Kucinich/Lee territory to be truly apt ‘fits’ for their districts.

    Some better targets might be a little further down the list, including frequent netroots foils like Dan Lipinski and the newly-vulnerable Jane Harman. To my eye, one of the juiciest targets is Jim Cooper, about the only representative in a district with a solidly Dem PVI who’s not just voting poorly around the margins but on some of the important stuff as well (like the stimulus). Pressure on Cooper is particularly important as the focus turns to health care, as his singular influence in the health care arena gives him unique power to obstruct progessive health care policy.

    Now let’s turn to the good news: the Democrats who are most overperforming their districts, and who are most deserving of our praise (or in the case of the bluest Dogs, our tolerance). As with last year, it’s a mix of flat-out progressives in swing or light-blue districts, and Blue Doggish types who are entrenched in deep-red districts that would likely flip without them (or, in the sad cases of Lampson and Boyda, Blue Doggish types who failed to get entrenched):

    Rep. District PVI PVI rank DW/N Liberal rank Difference
    C. Edwards TX-17 R+18 417 – 0.240 196 221
    G. Taylor MS-04 R+16 404.5 – 0.248 193 211.5
    Matheson UT-02 R+17 408 – 0.154 222 186
    Pomeroy ND-AL R+13 379 – 0.245 194 185
    DeFazio OR-04 D+0 200 – 0.602 27 173
    Lampson TX-22 R+15 390 – 0.038 234 156
    Doggett TX-25 D+1 187.5 – 0.533 49 138.5
    Herseth SD-AL R+10 337 – 0.234 199 138
    Skelton MO-04 R+11 347 – 0.203 212 135
    Hinchey NY-22 D+6 147 – 0.685 13 134
    Stupak MI-01 R+2 228.5 – 0.436 97 131.5
    Filner CA-51 D+7 137 – 0.723 9.5 127.5
    Oberstar MN-08 D+4 160 – 0.570 36 124
    Kucinich OH-10 D+8 125 – 0.791 3 122
    Spratt SC-05 R+6 283.5 – 0.325 165 118.5
    Obey WI-07 D+2 185 – 0.486 72 113
    Chandler KY-06 R+7 300.5 – 0.256 192 108.5
    Rodriguez TX-23 R+4 254.5 – 0.348 150 104.5
    Boyda KS-02 R+7 308 – 0.218 206 102
    Boucher VA-09 R+7 303 – 0.232 201 102

    One advantage of the PVI/Vote Index is that, at the same time as shining a light on Democrats who are lagging their districts, it also illuminates right-wing Republicans camped out in moderate districts, who should theoretically be vulnerable a good Democratic challenger because of their poor fit with their districts. If there’s any doubt, check out which of these nutjobs who’ve overperformed their districts got defeated in 2008, and how many more got a serious scare.

    Rep. District PVI PVI rank DW/N Liberal rank Difference
    Ryan WI-01 R+2 224 0.690 397 – 173
    Feeney FL-24 R+3 241 0.744 409 – 168
    Chabot OH-01 R+1 205.5 0.626 372 – 166.5
    Garrett NJ-05 R+4 261 0.771 417 – 156
    Shadegg AZ-03 R+6 288.5 0.903 429 – 140.5
    Rohrabacher CA-46 R+6 291 0.826 424.5 – 133.5
    Kline MN-02 R+3 233.5 0.616 365 – 131.5
    Bilbray CA-50 R+5 264 0.684 394 – 130
    Fossella NY-13 D+1 191 0.507 317 – 126
    Walberg MI-07 R+3 230.5 0.589 356.5 – 126
    Weldon FL-15 R+4 251.5 0.622 367.5 – 116
    Campbell CA-48 R+8 311 0.826 424.5 – 113.5
    Bachmann MN-06 R+5 273.5 0.663 385.5 – 112
    Manzullo IL-16 R+5 263 0.630 374 – 111
    Franks AZ-02 R+9 322 0.910 431 – 109
    Tiberi OH-12 R+1 210 0.508 318 – 108
    Royce CA-40 R+8 315 0.794 421 – 106
    Roskam IL-06 R+3 236.5 0.552 341 – 104.5
    Mica FL-07 R+4 251.5 0.583 355 – 103.5
    Castle DE-AL D+7 142 0.291 245 – 103

    Finally, one last table: the Republicans who are “underperforming” their very conservative districts. While there are a few moderates here (like the primaried-out Wayne Gilchrest), mostly it’s semi-sane conservatives in some of the darkest-red districts in the nation. I’m keeping this list to 10, as either way, there’s not much we can do about these guys, other than sit back and watch as the Club for Growth goes after them with chainsaws. (Note that Jerry Moran, who’s vacating his seat to run for Senate, is one of them. His moderation, relatively speaking, may be an asset for him when running statewide.)

    Rep. District PVI PVI rank DW/N Liberal rank Difference
    W. Jones NC-03 R+15 395 0.279 242 153
    Simpson ID-02 R+19 421 0.397 271 150
    Moran KS-01 R+20 427 0.442 286 141
    Platts PA-19 R+12 366 0.327 255.5 110.5
    D. Young AK-AL R+14 387 0.420 278.5 108.5
    Lucas OK-03 R+18 414 0.493 310 104
    Crenshaw FL-04 R+16 407 0.489 308 99
    Bachus AL-06 R+25 433 0.538 335.5 97.5
    Gilchrest MD-01 R+10 335 0.254 238 97
    Aderholt AL-04 R+16 399 0.476 303 96

    Much more discussion of the methodology and what this all may mean, over the flip.

    We need to talk methodology briefly. I’ll do this as a Q&A in order to make it a little livelier.

    What the heck is DW/N? As my primary vote-aggregating resource, I’m using DW/Nominate scores, which are a tool I used in a number of vote-scoring-themed diaries last summer. The main advantage DW/N has over other scores is that they aggregate absolutely every vote, instead of cherry-picking. (ADA ratings and CQ party unity scores, for instance, pick so few votes that it’s terribly insufficient gradation among representatives; nearly all Dems have an ADA score of 90, 95, or 100, while nearly all have a CQ score in the 96-98 range… which is why I don’t use either of those metrics.) In each case, I’m using the DW/N score of whatever representative ended the session holding the seat, even if someone else held it the majority of the term.

    On the other hand, most everyone else (Progressive Punch, National Journal, CQ, the ADA) uses a 0-100 score, with 100 being most liberal, which is easy for people to mentally convert to the A-B-C-D-F grading scale. By comparison, DW/Nominate scores are difficult to interpret. The scores generally run from – 1 (most liberal) to 1 (least liberal). The scoring algorithm seems to measure similarities between voting records among representatives; a number further away from 0 indicates a greater amount of distance between your record and those of other reps. In fact, if your voting record doesn’t look anything like anybody’s elses, you can exceed the 1 to -1 range (as with Ron Paul’s 1.4).

    You may recall last year, to do this project, I created one averaged-out liberal rating using both Progressive Punch and National Journal scores. While I’d very much like to use Progressive Punch scores again — I think they do the best job of the “just right” amount of vote cherry-picking and turning it into an easy-to-understand score — they’ve already turned their attention to the 111th Congress now in session and their old scores from the 110th have already vanished from public view.

    And rather than try to average out DW/Nominate and National Journal scores, I’ve just decided there’s too much apples and oranges going on there. This is partly because of the different scoring techniques, which results in some odd discrepancies… National Journal’s method is insensitive to ‘purity’ votes (i.e. voting against something not because you disagree but because it doesn’t go far enough) so the furthest-left or right members of the caucuses (like McDermott, Kucinich, Stark, DeFazio, Woolsey, Waters, or Capuano for the Dems, or Paul for the GOP) tend to get buried in mid-caucus or even treated as centrists.

    More importantly, though, there are 19 seats for which there is no National Journal composite score for both 2007 and 2008, mostly because the seat changed hands in a special election (or because of a lot of absences, either for sickness or leadership duties). As a result, what I’ve decided to do is run entirely separate tables based solely on National Journal numbers. As you can see, many of the same people appear relatively in the same places. Members for whom there are scores, and the PVI of their districts, are rated 1-416 instead of 1-435. (The missing parties are Pelosi, Lantos/Speier, Millender-McDonald/Richardson, Crenshaw, Norwood/Broun, Rush, Hastert/Foster, Carson/Carson, Jindal/Scalise, Baker/Cazayoux, Wynn/Edwards, Meehan/Tsongas, Wicker/Childers, Andrews, Gillibrand, Gilmoor/Latta, Pryce, Davis/Wittman, and Cubin.)

    Here are the tables based on National Journal composite scores instead. (There is a rating for both 2007 and 2008, so I averaged the two to get one score for each. Again, representatives and districts are ranked only 1 to 416 in this series, because scores aren’t available for 19 seats.) Here are the underperforming Dems:

    Rep. District PVI PVI rank NJ Liberal rank Difference
    A. Davis AL-07 D+17 60 58.15 181 – 121
    Jefferson LA-02 D+28 25 74.35 119 – 94
    Meek FL-17 D+35 10 78.25 95.5 – 85.5
    Capuano MA-08 D+33 17 77.85 101 – 84
    Stark CA-13 D+21 38 74 120 – 82
    Serrano NY-16 D+43 1 80.75 80 – 79
    G. Green TX-29 D+8 124.5 54.1 198 – 73.5
    Lipinski IL-03 D+10 99.5 61.95 172 – 72.5
    Emanuel IL-05 D+18 56 72.8 128 – 72
    C. Brown FL-03 D+16 63 71.6 134.5 – 71.5
    Ryan OH-17 D+14 71 70.05 142 – 71
    Maloney NY-14 D+26 27 78.15 97 – 70
    Meeks NY-06 D+38 6 81.05 75.5 – 69.5
    M. Udall CO-02 D+8 118 57 186.5 – 68.5
    Engel NY-17 D+21 40 77 108 – 68
    Woolsey CA-06 D+21 42 76.75 109 – 67
    Reyes TX-16 D+9 110.5 61 176 – 65.5
    Berkley NV-01 D+9 113 60.55 177 – 64
    Waters CA-35 D+33 18 80.25 81.5 – 63.5
    Cooper TN-05 D+6 136.5 53.95 199 – 62.5

    Here are overperforming Dems:

    Rep. District PVI PVI rank NJ Liberal rank Difference
    C. Edwards TX-17 R+18 400 55.7 193 207
    Pomeroy ND-AL R+13 363 61.55 175 188
    Matheson UT-03 R+17 391 48.85 218 173
    G. Taylor MS-04 R+16 388.5 48.65 219 169.5
    Skelton MO-04 R+11 332 58.55 180 152
    Lampson TX-22 R+15 374 45.4 227 147
    Obey WI-07 D+2 177 85.15 42 135
    Herseth SD-AL R+10 323.5 52.6 203 120.5
    Spratt SC-05 R+6 272.5 65.75 153 119.5
    Price NC-04 D+6 138 89.1 22 116
    Mollohan WV-01 R+6 275.5 63.75 163 112.5
    Delahunt MA-10 D+9 116 91.4 11 105
    Hinchey NY-22 D+6 139 86.4 35 104
    Boyda KS-02 R+7 296 55.4 194 102
    Boucher VA-09 R+7 291 56.55 189 102
    Hooley OR-05 D+1 185 80.1 85.5 99.5
    Holden PA-17 R+7 288.5 56.1 191 97.5
    Chandler KY-06 R+7 288.5 55.15 195 93.5
    Capps CA-23 D+9 108 90.35 16 92
    Grijalva AZ-07 D+10 103 91.2 12 91

    Here are the overperforming Republicans:

    Rep. District PVI PVI rank NJ Liberal rank Difference
    Kline MN-02 R+3 223.5 10 398 – 174.5
    Mica FL-07 R+4 241.5 11.75 386 – 144.5
    Feeney FL-24 R+3 231 14.1 372.5 – 141.5
    Ryan WI-01 R+2 215 16.4 352 – 137
    Shadegg AZ-03 R+6 277.5 5.5 412 – 134.5
    Bachmann MN-06 R+5 262.5 10.55 396 – 133.5
    Weldon FL-15 R+4 241.5 14.35 370.5 – 129
    Saxton NJ-03 D+3 162.5 30.95 280 – 117.5
    H. Wilson NM-01 D+2 170 28.7 283 – 113
    Garrett NJ-05 R+4 251 15.45 360 – 109
    Walberg MI-07 R+3 221 20.6 328 – 107
    Putnam FL-12 R+5 267.5 14 374 – 106.5
    Franks AZ-02 R+9 310 4.7 416 – 106
    Chabot OH-01 R+1 197.5 24.9 301.5 – 104
    Fossella NY-13 D+1 183 28.2 286 – 103
    S. King IA-05 R+8 305 6.5 407.5 – 102.5
    Latham IA-04 D+0 188 28.25 285 – 97
    M. Rogers MI-08 R+2 212 24.1 308.5 – 96.5
    Royce CA-40 R+8 303 9.9 399 – 96
    Akin MO-02 R+9 311 6.6 406 – 95

    And finally, here are the underperforming Republicans:

    Rep. District PVI PVI rank NJ Liberal rank Difference
    Moran KS-01 R+20 408 33.45 268 140
    W. Jones NC-03 R+15 379 38.5 247 132
    Simpson ID-02 R+19 403 31.5 275 128
    D. Young AK-AL R+14 371 36.25 257 114
    Paul TX-14 R+14 373 35.3 261 112
    Gilchrest MD-01 R+10 322 49.4 217 105
    Bachus AL-06 R+25 414 23.2 314 100
    Platts PA-19 R+12 351 36.75 254.5 96.5
    Inglis SC-04 R+15 375 31.1 279 96
    Emerson MO-08 R+11 335 40.55 240 95

    Is this old or new PVI? This is Classic PVI, calculated using the Cook formula and based on 2000-2004. My rationale is that their 110th Congress votes all predate the 2008 election, so if representatives actually were taking their districts’ lean into consideration, it would be based on the previous elections.

    Still, this raises the interesting question of whether the 2008 election results have changed the dynamic for representatives in those few districts that changed dramatically one way or the other (for instance, are Marion Berry or Mark Kirk more endangered now?). Perhaps some of them might change their records in the 111th Congress, for better or worse, to reflect what they can see is happening on the ground in their districts. Accordingly, I’m creating yet more tables… this time, based on the newly released Cook PVIs reflecting the 2004 and 2008 elections. (I’m leaving out defeated or retired representatives from these lists, which, for instance, removes Jefferson from the underperforming Dems list, or Chabot and Feeney from the overperforming GOPers list.)

    Here are the underperforming Dems. Not that many dramatic changes, but note that David Scott has zoomed up to near the top of the list, as his previously D+10 district in the Atlanta exurbs became D+15 on the strength of a huge influx of African-American residents. He’s one of only two black Blue Dogs (Sanford Bishop in rural GA-02 is the other one, and is a fine fit), and might want to rethink that.

    Rep. District PVI PVI rank NJ Liberal rank Difference
    A. Davis AL-07 D+18 60 – 0.286 183.5 – 123.5
    D. Scott GA-13 D+15 71 – 0.257 191 – 120
    Meeks NY-06 D+36 7 – 0.397 122 – 115
    Meek FL-17 D+34 13 – 0.390 126 – 113
    Moran VA-08 D+16 64 – 0.345 152.5 – 88.5
    Doyle PA-14 D+19 55 – 0.363 142 – 87
    Brady PA-01 D+35 10 – 0.439 96 – 86
    Fattah PA-02 D+38 4 – 0.454 84.5 – 80.5
    Berman CA-28 D+23 37 – 0.406 117.5 – 80.5
    Engel NY-17 D+18 58 – 0.378 137 – 79
    Schiff CA-29 D+14 75 – 0.347 151 – 76
    Reyes TX-16 D+10 109 – 0.286 183.5 – 74.5
    Sires NJ-13 D+21 48 – 0.398 121 – 73
    Harman CA-36 D+12 98 – 0.319 169 – 71
    Rush IL-01 D+34 14 – 0.455 83 – 69
    S. Davis CA-53 D+14 74 – 0.362 143 – 69
    Crowley NY-07 D+26 32 – 0.431 100 – 68
    Lipinski IL-03 D+11 106 – 0.312 174 – 68
    Towns NY-10 D+38 3 – 0.492 69 – 66
    Rangel NY-15 D+41 2 – 0.492 67 – 65

    Here are the overperforming Dems. Gene Taylor overtakes Chet Edwards at the top, based on the different direction their districts are going. There are definitely more Blue Dogs and their ilk on the new list than the old list, thanks to a number of southern uplands districts plunging from GOP-leaning to dark-red (Boren, Berry, Lincoln Davis, Gordon, Mollohan, Rahall).

    Rep. District PVI PVI rank NJ Liberal rank Difference
    G. Taylor MS-04 R+20 415 – 0.248 193 222
    C. Edwards TX-17 R+20 417 – 0.240 196 221
    Matheson UT-02 R+15 386 – 0.154 222 164
    Skelton MO-04 R+14 374 – 0.203 212 162
    DeFazio OR-04 D+2 183 – 0.602 27 156
    Boren OK-02 R+14 368 – 0.128 224 144
    Pomeroy ND-AL R+10 336 – 0.245 194 142
    Berry AR-01 R+8 300 – 0.338 159 141
    Boucher VA-09 R+11 342 – 0.232 201 141
    L. Davis TN-04 R+13 359 – 0.177 218.5 140.5
    Melancon LA-03 R+12 344 – 0.220 205 139
    Oberstar MN-08 D+3 174 – 0.570 36 138
    Childers MS-01 R+14 369 – 0.010 236 133
    Mollohan WV-01 R+9 321 – 0.268 189 132
    Stupak MI-01 R+3 228 – 0.436 97 131
    Gordon TN-06 R+13 350 – 0.171 220 130
    Hinchey NY-22 D+6 140 – 0.685 13 127
    Spratt SC-05 R+7 289 – 0.325 165 124
    Rahall WV-03 R+6 286 – 0.331 163.5 122.5
    Grijalva AZ-07 D+6 138 – 0.655 18 120

    Here are the overperforming Republicans. There’s a lot of turnover on this list from the old PVI list, but that has more to do with defeats and retirements than vastly changed districts (Chabot, Feeney, Walberg, Tancredo, Musgrave, Keller, Tom Davis, Heather Wilson, Weldon, and Knollenberg would all clock in higher than Dave Camp). However, note the sudden appearance of a lot of Illinois, Michigan, and California districts on the new list, based on Obama’s strong performance in those states.

    Rep. District PVI PVI rank NJ Liberal rank Difference
    Ryan WI-01 R+2 218 0.690 397 – 179
    Rohrabacher CA-46 R+6 262 0.826 424.5 – 162.5
    Bilbray CA-50 R+3 232 0.684 394 – 162
    Campbell CA-48 R+6 263 0.826 424.5 – 161.5
    Manzullo IL-16 R+2 222 0.630 374 – 152
    Roskam IL-06 Even 193 0.552 341 – 148
    Tiberi OH-12 D+1 192 0.508 318 – 126
    Garrett NJ-05 R+7 291 0.771 417 – 126
    Kline MN-02 R+4 239 0.616 365 – 126
    Royce CA-40 R+8 303 0.794 421 – 118
    Lungren CA-03 R+6 261 0.641 377 – 116
    Castle DE-AL D+7 133 0.291 245 – 112
    Shadegg AZ-03 R+9 317 0.903 429 – 112
    Biggert IL-13 R+1 210 0.512 321 – 111
    Kirk IL-10 D+6 142 0.320 251.5 – 109.5
    Petri WI-06 R+4 246 0.568 350.5 – 104.5
    Sessions TX-32 R+8 302 0.727 403.5 – 101.5
    Rogers MI-08 R+2 212 0.498 313.5 – 101.5
    Pitts PA-16 R+8 304 0.728 405 – 101
    Camp MI-04 R+3 236 0.538 335.5 – 99.5

    And here are the underperforming Republicans…

    Rep. District PVI PVI rank NJ Liberal rank Difference
    W. Jones NC-03 R+16 397 0.279 242 155
    Moran KS-01 R+23 424 0.442 286 138
    Simpson ID-02 R+17 406 0.397 271 135
    Emerson MO-08 R+15 385 0.329 257 128
    Aderholt AL-04 R+26 430 0.476 303 127
    Lucas OK-03 R+24 425 0.493 310 115
    R. Hall TX-04 R+21 422 0.503 315 107
    Whitfield KY-01 R+15 381 0.430 281 100
    Bachus AL-06 R+29 435 0.538 335.5 99.5
    Crenshaw FL-04 R+17 407 0.489 308 99

    Why aren’t you using regression instead of discrete ranks? Good question. Last year, I used discrete ranks because that’s all I knew how to do. I’ve gotten a lot more familiar since then with some of the more advanced tools in Excel, so when I set out to re-do this project this year, my first attempts tried turning this into a regression exercise. The results, however, weren’t as satisfactory, so I went back to what I knew worked.

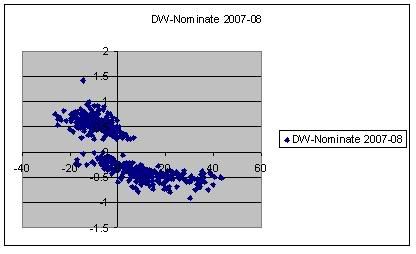
    To illustrate this, take a look at the results graphed as a scatterplot (DW/Nominate data on the vertical axis, PVI on the horizontal axis).

    DW-Nominate 2007-08

    For the most part, you can see very clear correlations, as the two parties cluster tightly but also have nice slopes indicating the relationship between voting record and PVI. (And the gap between the two parties shows how even the worst Dem is still much better than the best GOPer.) However, notice that the tight cluster of Dems start to flatten out and then turn into more of a spray as you get into the districts with super-high PVIs.

    The representatives in the highest-PVI districts aren’t especially more progressive than the ones in the lower but still solid-blue districts. A regression line, however, would predict that because of the great distance between say, the D+43 standing of NY-15 and NY-16 and the other districts, therefore the reps from these districts should also be much, much more progressive than anyone else. This is particularly a problem when using National Journal scores, which max out at 100; even if we somehow elected Angela Davis in those districts, she still would be underperforming because the “TREND” function on Excel says that to be a good fit, you have to bend the laws of mathematics and get a National Journal score of 105.

    Just for the sake of comparison, here’s the Top 10 most underperforming Dems according to a true regression model (based on residuals, which are the differences between the projected voting records according to the trendline and actual voting records): Serrano, Rangel, Meeks, Towns, Meek, Fattah, Brady, Rush, Pelosi, and Clarke. As you can see, there are a number of commonalities between this list and the list above… but a perceptive reader will also notice that these are basically just the people in the districts with the top 10 highest PVIs, in approximately the right order (although Kendrick Meek is still somewhat out-of-whack). On the Republican side, the method also views Ron Paul as the most overperforming and potentially vulnerable Republican (although after that it settles down to the usual suspects: Franks, Rohrabacher, Ryan, etc.).

    So, I discarded the method that just tells me that our juiciest primary targets are the representatives who are in our bluest districts. Switching back to discrete ranks comes with its own problems: while it flattens out the distortion at the margins, it may create some distortion in the middle, where it may place more importance than should be accorded on small DW/Nominate score differences among members who are clustered near the median of their caucuses. So, as always, I welcome any thoughts on the methodology here and how to make this the fairest-possible assessment of House members’ fits.

    One other idea I’ve mulled over is the possibility of ranking representatives only against a cohort of the representatives in 5 or 10 most similar districts, similar not just in terms of presidential voting but other demographic characteristics. For example, let’s take a look at AL-07, of interest to us not just because it’s where the most out-of-whack Dem (Artur Davis) is, but because it’s a district that points to the flaws of using only PVI as an indicator of who’s a good fit, as it’s a good bit more socially conservative than most other districts in the D+18 range.

    One would want to compare Davis to the representatives in MS-03 and SC-06, similar not just in terms of their PVI but also their racial composition. Beyond that, TN-09, NC-12, FL-03, and VA-03 are also similar in region, PVI, and race, though somewhat less similar, in terms of being less impoverished and more urban. If you average out the DW/N scores for Bennie Thompson, Jim Clyburn, Steve Cohen, Mel Watt, Corrine Brown, and Bobby Scott, you get – 0.462 (ranging from – 0.544 for Watt to – 0.403 for Clyburn), so Davis’s – 0.286 still points to a significant under-performance. Of course, I’d need to develop a statistical method for analyzing which districts truly are the most similar to each other using a similar technique as Nate Silver’s state similarity index (rather than simply saying “Hmm, these ones seem similar”), so while this method seems the most promising to me, it’ll still need a lot of work too.

    UPDATE: See the entire dataset at Google Docs.

    Son of Bailout: Who are the Flippers?

    The original economic rescue package that went down to narrow defeat on Monday was notable for the strange coalition that formed. Rather than a clear left/right split, the opposition was an interesting grouping of vulnerable incumbents and representatives from districts geographically or economically far removed from Wall Street, from across the ideological spectrum.

    Today’s second-try vote that passed the bailout 263 to 171 (with Dems splitting 172-63 and the GOP splitting 91-108) necessarily involved a lot of people flipping from nay to yea. As with the original vote, the flippers weren’t heavily concentrated at one point on the ideological spectrum, but scattered throughout. 33 Dems switched from nay to yea, as did 25 Republicans. (Only one representative, Jim McDermott, switched from yea to nay. And one GOP representative, Jerry Weller, switched to no vote to yea.)

    If there was one place the switches came from, though, it was the Progressive Caucus, which was originally 35-32 in favor of the bailout. Today, 16 caucus members flipped to yea, making it 50-17 (accounting for McDermott going the other way). The Progressive Caucus shares many members with the Congressional Black Caucus, which also turned direction (reportedly because of heavy lobbying by Obama himself, based on his promises to revisit the issue in January), with 13 flippers, changing its numbers from 18-19 to 31-6. Likewise, the Congressional Hispanic Caucus also turned, with 5 flippers, going from 8-13 to 13-8.

    As was predicted, there was little movement among the Blue Dogs, who reportedly weren’t happy with the additional pile of debt thrown in as a ‘sweetener.’ Only 5 Blue Dogs flipped, as they went from 31-22 to 36-17. Likewise, 8 New Dems flipped (some of whom are also Blue Dog members), going from 38-21 to 46-13.

    On the Republican side, the ultra-right Republican Study Committee still remained the main bastion of resistance. Of the 205 25 GOPers who flipped, only 11 came from the RSC, as the RSC went from 26-81 to 37-70. On the other hand, the country-clubby Main Street Partnership moved to the most pro-bailout caucus in the whole House, with 7 flippers, taking it from 21-15 to 29-8 (including the addition of Weller).

    More over the flip…

    Few vulnerable representatives wound up changing their votes, as they (especially on the GOP side) continued to hold out in the face of perceived public opposition. On the Democratic side, only 3 vulnerable members flipped (Giffords, Mitchell, and Yarmuth, all Lean D). On the Republican side, 9 vulnerable members flipped (Knollenberg at Tossup, Kuhl and Schmidt at Lean R, and Boustany, Buchanan, Dent, Ros-Lehtinen, Shadegg, and Terry at Likely R).

    (I say ‘perceived’ because a new Democracy Corps memo, based on polling of competitive GOP-held districts taken after the first bill’s failure (and subsequent market crash), suggests that the bailout isn’t as much of a political loser as the “100 to 1 calls against” anecdotes first suggested. This, of course, assumes that the specifics of the bill are properly explained, rather than simply rammed down everyone’s throats, as happened last week.)

    By a 47 to 42 plurality, voters say they want their representative in Congress to support the 700 billion dollar plan to purchase troubled mortgage assets as modified by Congress to include limits on CEO pay and repay taxpayers in the long-term…. The winning Democratic message notes the need to turn the economy around and protect the middle class but mainly focuses on the improvements made by Congress to the Bush administration’s original bill, including limits on CEO compensation and protections to ensure taxpayers are paid back when the economy rebounds.

    Two One retiree also flipped, remarkable since there were so few retirees voting nay in the first place: Ray LaHood and Jim Ramstad.

    One other thing I would have expected was more representatives from what we’ll call ‘investor-class’ districts flipping from nay to yea (in the face of angry constituents upset about their 401(k)s rather than the cost of the bailout). However, they didn’t seem to flip at any greater rate than the rest of the House (although that may be because representatives from these districts were pretty heavily in favor of the package to begin with). Of districts where the 2007 median household income was over $65,000 (approximately the top 20% among districts), there were only 9 flippers: four from the Dems (Donna Edwards, Hirono, Tierney, and Woolsey), and five from the GOP (Biggert, Frelinghuysen, Gerlach, Knollenberg, and Ramstad).

    Bailout Vote: Safety in Numbers

    In the wake of yesterday’s failed vote on the colossal Wall Street rescue plan, let’s take a look at how the members actually voted. This is one of the most confusing votes in recent memory, as there aren’t clear ideological fissures in the voting blocs. There’s something more fundamental going on here: self-preservation… and the question of whether each representative is more in fear of the constituents who keep him or her in office, or the financiers who keep him or her in office. (As often happens, Nate Silver already got there first, but I’m adding some additional details.)

    As you’ve probably already seen, the bill failed 205-228, with Dems splitting 140-65, and the GOP splitting 95-133 (with one GOP non-voter and one vacancy). The votes, however, were pretty evenly distributed throughout the ideological spectrum.

    Follow over the flip for much more:

    For instance, the 10 most liberal Democrats according to Progressive Punch split 6-4. Aye: Baldwin, McGovern, Olver, Schakowsky, Danny Davis, and Markey. Nay: Donna Edwards, Linda Sanchez, Jesse Jackson Jr., and Payne.

    The 10 least liberal Democrats according to Progressive Punch split 3-7. Aye: Marshall, Donnelly, and Ellsworth. Nay: Lampson, Childers, Barrow, Shuler, Hill, Taylor, and Altmire.

    The 10 least conservative Republicans according to Progressive Punch split 5-5. Aye: Gilchrest, Shays, Kirk, Castle, and Ferguson. Nay: Chris Smith, Lo Biondo, Tim Johnson, Walter Jones, and Reichert.

    Only the 10 most conservative Republicans showed much uniformity, splitting 1-9, with Boehner himself providing the only aye.

    The same inconsistency applies if you break results down by caucus: for instance, the Progressive Caucus was split 35-32. The New Dems were split 38-21. The Blue Dogs were split 31-22. Unaffiliated Dems split 42-24. The Congressional Black Caucus was split 18-19; the Congressional Hispanic Caucus was split 8-13 (these were the only Democratic caucuses to give a majority of nays). The centrist Main Street Republicans split 21 ayes and 15 nays. Unaffiliated Republicans split 17-39. The greatest cohesion was in the ultra-conservative Republican Study Committee, which split 26-81 (and this becomes even more stark when you account for retiring members, and wannabe leadership like Putnam, Cantor, and Ryan).

    So, there’s very little correlation between bailout vote and ideology (except at the right end of the spectrum). Where are the correlations? The most important factor is: safety. The Retiree Caucus, as a whole, voted 24 ayes and 10 nays. Among the Dem retirees, the vote was 4 ayes and 2 nays. Among the GOP retirees, the vote was 20 ayes and 7 nays.

    This becomes even more pronounced when you discount retirees who are currently running for higher office. If you eliminate both Udalls, Hulshof, and Pearce, that’s four more ‘nays’ off the table. (Tom Allen voted aye, but at this point he unfortunately seems pretty much free to vote his conscience.) If you also pick off Ramstad, who’s supposedly a likely candidate for Minnesota governor in two years, that leaves only five retirees who apparently bucked leadership and voted ‘nay’ for ideological reasons: the corrupt John Doolittle, the corrupter Rick Renzi, the insane wannabe-prez Duncan Hunter, the primaried-out wingnut David Davis, and lone sane person Ray LaHood.

    Contrast this with the Tossup Caucus (incumbents defined as Tossup by Swing State Project). These profiles in courage contributed 3 ayes and 7 nays. Of the Dems, Kanjorski voted aye, while Cazayoux and Lampson voted nay. (In doing so, Kanjorski may have dug his electoral hole even deeper. As a key member of the Financial Services committee, he couldn’t bail on this, but voting aye plays right into the hands of Barletta’s demagogic right-populist campaign, and his blue-collar district probably doesn’t contain a lot of six-digit 401(k)s.) On the GOP side, Shays (who lives in the one district where the constituents were probably 100 to 1 in favor of the bailout) and fellow affluent suburbanite Porter voted aye, while Feeney, Musgrave, Reichert, Walberg, and Young voted nay.

    The Lean Democratic Caucus (all Dems) split 4 aye and 11 nay. Foster, Mahoney, Marshall, and McNerney voted ‘aye’ (note that all other than Marshall are from affluent suburban districts, and Marshall, a former bankruptcy law professor, has been unusually aggressive in explaining his position). With the exception of Mitchell and, to an extent, Shea-Porter, the ‘nay’ votes came from more downscale digs.

    The Likely Democratic Caucus (also all Dems), on more comfortable terrain, split 5 ayes and 2 nays. Rodriguez and Walz were the nays, while rural Blue Dogs Arcuri and Space perhaps surprisingly joined the more suburban Dennis Moore and both Murphys.

    The Lean Republican Caucus (all GOP) had probably the greatest uniformity of all, giving us only 1 aye and 12 nays. The one holdout: Mark Kirk, again voting his district (one of the nation’s wealthiest).

    The Likely Republican Caucus (also all GOP) also huddled together in fear, voting 3 ayes and 14 nays. The three ayes were Frank Wolf (voting his wealthy district), Alabama’s Mike Rogers, and Mark Souder, who as usual seems to be either indifferent to his reelection or out to lunch.

    One other interesting way to break this problem down is by region. Basically, the greater physical proximity you have to Wall Street (or to a lesser extent, another major metropolitan area), the likelier you were to vote for the bailout.

    For example, representatives from the Northeast voted 60-32 in favor of the bill. This broke down to 49-19 for Democrats, and 11-13 for Republicans. For the most part, the Dems voting nay weren’t the most progressive northeasterners, but the ones furthest from the urban fast lane, ranging from the progressive (Welch, Hodes) to the conservative (Altmire, Carney).

    In the Midwest, the overall breakdown was 41-57. Democrats broke 28-21, while Republicans broke 13-36. (And if you remove leadership, retirees, and affluent suburban districts from the equation, the GOP share of ayes drops down to almost zero.)

    In the West, the overall breakdown was 44-54. Dems broke narrowly against it, 27-30, while the GOP broke 17-24. The near unanimity of western CHC members against it (only Blue Dogs Cardoza and Costa were ayes) provided the margin for nays among the Dems, while a number of ayes from rich-guy Republicans in California (Campbell, Dreier, Lungren, etc.) keep it closer among the GOP.

    In the South, the overall breakdown was 59-86. Democrats broke in favor 36-25, and the GOP went against it 23-61. Interestingly, the majority of white southern Democrats were ayes (although some of the more vocally-populist Blue Dogs, like Childers and McIntyre, were nays); the Democratic nays in the south came mostly from the CBC (which contrasts sharply with the CBC members in the northeast, who were mostly ayes). The GOP ayes were again largely dependent on retirees, but also members from affluent suburbs (Bachus, Sessions).

    So, while the simplest explanation is that voting ‘nay’ has the strongest correlation with being the most endangered and ‘aye’ has the strongest correlation with counting days to retirement, there’s something else going on, too. And it would tend to give some credence to the ‘populist uprising’ theory popular in some quarters of the blogosphere, that instead of a clear left/right fissure, we’re seeing something we haven’t seen much of before: a fissure that’s more rural plus urban core vs. suburban, blue-collar vs. knowledge economy, even, dare I say, proletarian vs. bourgeois. Representatives from rural areas from both parties, in concert with urban CBC and CHC representatives, somehow converged in great enough numbers to overcome united leadership plus suburban representatives of both parties.

    Where We Can Make the Most Progress This Year: Senate Edition

    Last week I wrote about Where We Can Make the Most Progress in the House, where I tried to measure the biggest probable right-to-left swings that might result from the 2008 election in the House (the biggest one would be swapping out Dana Rohrabacher for Debbie Cook, in case you missed it). In the comments, the question came up of what would happen if I ran the same analysis for the competitive 2008 Senate races.

    I have been reluctant to do so, because when I did the House, I relied on a demographic model for predicting which caucus new House members might join and, from there, predicting their likely DW-Nominate score. That just doesn’t work with the Senate: demographics-wise, states don’t break down as cleanly as do House districts. And Senators tend to disobey their states’ partisan lean much more so than Representatives: consider that we have two moderate Republican senators in one of our bluest states (Maine), two populist Democratic senators in one of our reddest states (North Dakota), and the swing states in the middle give us as wide a range of personalities as Russ Feingold and John Sununu.

    So, I decided to try a different approach, more speculative than I generally prefer, where I tried to project prospective Democratic senators’ voting preferences by averaging out the scores of already sitting senators who seem to have some commonalities with them. As a vague rule of thumb, I tried to use one senator who had the most in common geographically and one who seemed to have the most in common ideologically and/or stylistically, although these categories pretty thoroughly blended. Here’s a case in point: Mark Warner. I decided he had a lot in common with Jim Webb (- 0.359), a fellow Virginian and someone else who knows how to connect with white working class voters, and also with Joe Biden (- 0.338), another mid-Atlantic senator with a mix of liberal intentions and pro-corporate leanings. Average those, and voila: Warner projects at – 0.349. (Some of my comparables, or the resulting scores, may strike you as completely misguided. This is all pure speculation on my part, so feel free to argue why in the comments, or ask for some clarification on a particular choice. My feelings won’t be hurt.) One exception: if the Democratic candidates have a House record, I used their most recent score from there.

    State 110th Sen. 110th Score 111th Sen. 111th Score (and Comparables) Difference
    OK Inhofe 0.766 Rice -0.392 (Dorgan + Casey) -1.158
    CO Allard * 0.636 M. Udall -0.375 (110th Congress) -1.011
    MN Coleman 0.178 Franken -0.746 (Klobuchar + Feingold) -0.924
    NH Sununu 0.481 Shaheen -0.442 (Leahy + Feinstein) -0.923
    TX Cornyn 0.557 Noriega -0.336 (Bingaman + Salazar) -0.893
    NM Domenici * 0.281 T. Udall -0.525 (110th Congress) -0.806
    NC Dole 0.451 Hagan -0.330 (Webb + Lincoln) -0.781
    NE Hagel * 0.376 Kleeb -0.366 (Tester + Dorgan) -0.742
    ID Craig * 0.457 LaRocco -0.242 (103rd Congress) -0.699
    OR Smith 0.155 Merkley -0.698 (Wyden + Whitehouse) -0.698
    KY McConnell 0.507 Lunsford -0.168 (Pryor + Ben Nelson) -0.675
    AK Stevens 0.260 Begich -0.360 (Tester + Bingaman) -0.620
    MS Wicker 0.465 Musgrove -0.147 (Landrieu + Ben Nelson) -0.612
    VA J. Warner * 0.258 M. Warner -0.349 (Webb + Biden) -0.607
    ME Collins 0.084 Allen -0.449 (110th Congress) -0.533
    KS Roberts 0.376 Slattery -0.151 (103rd Congress) -0.527

    As you can see, swapping Jim Inhofe for Andrew Rice is the biggest gain (probably in terms of IQ points as well as in terms of voting record) even without factoring in that Rice may be more progressive than my score gives him credit for. However, unlike the House, where there are a fair number of opportunities to replace a right-winger with a progressive, in the Senate we’re pretty much limited to replacing right-wingers with moderates, or moderate Republicans with progressives, so the shifts are smaller.

    Finally, you may notice asterisks for the GOP-held open seats. I’ve compiled a separate table that doesn’t focus on “progress” but the “what if,” i.e. how big a swing we’re looking at in terms of the potential replacement (each of whom I’ve projected to be more conservative than the guy they’re replacing, either based on their House record or on comparables). If you prefer to swap these numbers in for the numbers based on the retiring senator, this doesn’t change the order of the overall results too much, although it does highlight the importance of making sure we win our biggest races. (Especially in Colorado… Mark Udall is on the moderate side, and hasn’t endeared himself much lately with his Iraq and FISA votes, but he’s way to the left of Allard, and even more so than Schaffer, who it turns out was one of the most conservative members of the House during his time there.)

    State GOP Sen. GOP Score (and Comparables) Dem Sen. Dem Score Difference
    CO Schaffer 0.849 (107th Congress) M. Udall -0.375 -1.224
    NM Pearce 0.557 (110th Congress) T. Udall -0.525 -1.082
    VA Gilmore 0.543 (J. Warner + DeMint) M. Warner -0.349 -0.892
    ID Risch 0.547 (Craig + Kyl) LaRocco -0.242 -0.789
    NE Johanns 0.399 (Hagel + Grassley) Kleeb -0.366 -0.765

    Where’s the Pivot Point?

    Who’s the most powerful member of the House? If I told you it was Tim Mahoney, you’d probably laugh in my face; after all, he’s a freshman, and a bit of a flake. Well, if you order all members of the House from most liberal to most conservative (using DW-Nominate scores for the 110th Congress), Tim Mahoney is #218 out of 435. He’s smack in the middle of the House, and the whole thing pivots around him, in the same way that Anthony Kennedy holds all the cards on the Supreme Court because he’s #5 out of 9.

    There are several things wrong with my proposition, though: first, 435 is a lot larger than 9, and there are a lot of transitory coalitions that form around various topics, so the spectrum isn’t always very clear. You aren’t even going to get aggregators to agree on who goes in what slot (ask National Journal, they’ll tell you that #218 is Mike McIntyre; ask Progressive Punch and they’ll tell it’s Charlie Melancon).

    More importantly, just as Matt Stoller mentioned yesterday in regards to 60 as the ‘magic number’ in the Senate, there aren’t very many votes where it actually comes down to the bare minimum. Even controversial things tend to pass by a sizable margin once the initial haggling shakes out (the most recent Iraq Supplemental passed 268-155, and the FISA Amendments passed 293-129); actual 218-217 votes are almost unheard of. As he sagely pointed out, the key is to build the coalitions and implement the infrastructure that allow progressives to control the discursive arena in Congress regardless of actual numbers so that the progressive POV becomes more of an institutional inevitability.

    Nevertheless, some of that sense of the ‘possible’ within that discursive arena is directly influenced by the seat count. Think back to the backstory behind the FISA vote last week: a lot of Dems voted with leadership, but leadership’s hand wasn’t forced by a widespread popular uprising, just by the 21 Blue Dogs who signed the January letter of intent to jump on board the Republicans’ discharge petition. We’ll probably never know who those 21 signatories were (although, given the spectrum in the House, one can assume it included Mahoney, McIntyre, and Melancon), but it’s clear they turned the tide on the FISA amendments. Looking at the pivot point, Pelosi could have safely ignored 12 Blue Dogs (233 – 12 = 221), but she couldn’t safely ignore 21 (233 – 21 = 212).

    What if, on the other hand, there weren’t fewer Blue Dogs, but rather more Progressives in seats that are currently occupied by moderate (or, in a few possibilities, extreme) Republicans? If there were only 7 more Democrats, all Progressive or New Dem, then Pelosi also could have ignored the 21 Blue Dogs (240 – 21 = 219). Now, of course, this is pure speculation that only 21 Dems would have signed the discharge petition, but my point stands that it would take only a few more net Progressives to move the core Blue Dogs past the pivot point and thus out of the House’s driver’s seat (or at least out of reach of the steering wheel). In shorter words, the goal for the 111th Congress needs to be: Progressives + New Dems > Blue Dogs + Republicans.

    More over the flip (including many tables)…

    So the question is: how many progressives (they don’t have to be card-carrying members of the Progressive Caucus; non-capitulating New Dems and unaffiliated types work fine too) do we need to add above the pivot point in order to push all of the Blue Dogs down the spectrum, to below the pivot point? Here’s where we get to break out the tables, starting with where we are right now in the current 110th Congress:

    Rank District 110th Rep. 110th Score Caucus Bad Votes
    215.5 FL-02 Boyd -0.198 BDC Iraq, FISA
    215.5 TX-28 Cuellar -0.198 NDC, CHC Iraq, FISA
    217 MO-04 Skelton -0.193 Unaff. Iraq, FISA
    218 FL-16 Mahoney -0.186 BDC, NDC, Fr. Iraq, FISA
    219.5 MN-07 C. Peterson -0.177 BDC Iraq, FISA
    219.5 TN-04 L. Davis -0.177 BDC Iraq, FISA
    221 TN-06 Gordon -0.165 BDC Iraq, FISA
    222 UT-02 Matheson -0.163 BDC Iraq, FISA
    223 TX-22 Lampson -0.158 BDC, NDC, Fr. Iraq, FISA
    224 AZ-05 Mitchell -0.148 NDC, Fr. Iraq, FISA
    225 PA-10 Carney -0.144 BDC, NDC, Fr. Iraq, FISA
    226 GA-08 Marshall -0.135 BDC Iraq, FISA
    227 PA-04 Altmire -0.12 NDC, Fr. Iraq, FISA
    228 OK-02 Boren -0.119 BDC Iraq, FISA
    229 IN-08 Ellsworth -0.118 BDC, Fr. Iraq, FISA
    230 AL-05 Cramer -0.112 BDC Iraq, FISA
    231.5 IN-02 Donnelly -0.107 BDC, Fr. Iraq, FISA
    231.5 NC-11 Shuler -0.107 BDC, Fr. Iraq, FISA
    233 GA-12 Barrow -0.080 BDC, NDC Iraq, FISA
    234.5 CT-04 Shays 0.241 MSP Iraq, FISA
    234.5 NJ-02 LoBiondo 0.241 MSP Iraq, FISA

    As you can see from this table, Pelosi is able to consider legislation without needing to rely on the worst 15 Blue Dogs on the final vote. (Again, though, she’s still affected by what happens in committee and other back-room wrangling.) However, there are a lot more Blue Dogs than that, if you continue on up the totem pole.

    One thing worth noting is that 7 of those 15 Blue Dogs below the pivot point are freshmen, indicating that maybe we didn’t come as far in the 2006 elections as we thought we did (many of our pickups were in red districts inhabited by corrupt or incompetent Republicans… 2008 looks to be somewhat different, as a lot of the GOP fruit that outright spoiled has been picked and now the lowest-hanging fruit is mostly in moderate suburban districts, which is what this year’s Red to Blue targeting reflects). Although the pivot point is much better than where it was in the 109th Congress (where #218 was Jim Gerlach, not only giving the Rs control of the House but giving Dennis Hastert license to ignore the 14 Republicans to the left of Gerlach), we swelled the ranks of the Blue Dogs in 2006, so much so that the pivot point is right in the middle of the Blue Dog caucus.

    Now let’s look at where we might be after the 2008 elections. I’m going to look at three different scenarios: a pessimistic scenario (where we only pick up 13 seats: the Lean D and Toss-up seats according to Swing State Project), an average scenario (where we also pick up the Lean R seats, giving us 26 seats), and a wildly optimistic scenario (where we also pick up the Likely R seats, giving us 56 new seats). I’m plugging in the new freshmen according to the scores I predicted for them last week. (I also need to fit the three new mid-term guys in there: based on their records so far, I’m assigning Childers and Cazayoux a score of – 0.200 and Foster a score of – 0.300. I also need to give a score to the three new Cuban-American reps, who didn’t fit in my formula; for an easy solution, I’ll just give them each – 0.400.) Let’s start with the pessimistic scenario:

    Rank District 110th Rep. 110th Score Caucus Bad Votes
    216.5 TN-08 Tanner -0.230 BDC Iraq, FISA
    216.5 TX-27 Ortiz -0.230 CHC Iraq, FISA
    218 PA-17 Holden -0.227 BDC Iraq, FISA
    219 CA-11 McNerney -0.226 Unaff., Fr. FISA
    220 GA-02 S. Bishop -0.22 BDC, CBC Iraq, FISA
    221 LA-03 Melancon -0.218 BDC, NDC Iraq, FISA
    222 AZ-08 Giffords -0.215 BDC, NDC, Fr. Iraq, FISA
    223 PA-12 Murtha -0.21 Unaff. Iraq, FISA
    224 IL-08 Bean -0.209 BDC, NDC Iraq, FISA
    225 TN-05 Cooper -0.208 BDC Iraq, FISA
    226 MS-04 Taylor -0.207 BDC Iraq, FISA
    227 IN-09 Hill -0.204 BDC, NDC, Fr. Iraq
    229 LA-06 Cazayoux -0.200 Unaff., Fr. Iraq, FISA
    229 MS-01 Childers -0.200 Unaff., Fr. Iraq, FISA
    229 OH-18 Space -0.200 BDC, Fr. Iraq, FISA
    231.5 FL-02 Boyd -0.198 BDC Iraq, FISA
    231.5 TX-28 Cuellar -0.198 NDC, CHC Iraq, FISA

    Under this scenario, Tim Holden becomes the new pivot point. Although we’re past the point where 21 holdouts can provoke a mutiny, we’re still in the Land of the Blue Dog. We’ve added 13 new Democrats, and the good news is that all of them fall above the pivot point, pushing the list down so that the pivot point is one of the less objectionable Blue Dogs.

    Now let’s look at the average scenario (26 pickups, including all of the Lean Rs):

    Rank District 110th Rep. 110th Score Caucus Bad Votes
    216 WV-01 Mollohan -0.269 Unaff. Iraq
    217 KY-06 Chandler -0.264 BDC, NDC Iraq, FISA
    218 CA-20 Costa -0.259 BDC, CHC Iraq, FISA
    219 GA-13 D. Scott -0.257 BDC, NDC,  CBC Iraq, FISA
    220 SD-AL Herseth -0.253 BDC, NDC Iraq, FISA
    221 ND-AL Pomeroy -0.247 BDC Iraq, FISA
    222 TX-17 C. Edwards -0.246 Unaff. Iraq, FISA
    223 KS-02 Boyda -0.239 Unaff., Fr. Iraq, FISA
    224 AR-04 Ross -0.235 BDC Iraq, FISA
    225 NC-07 McIntyre -0.234 BDC, NDC Iraq, FISA
    226 PA-08 P. Murphy -0.233 BDC, NDC, Fr. FISA
    227 VA-09 Boucher -0.231 Unaff. Iraq, FISA
    228.5 TN-08 Tanner -0.230 BDC Iraq, FISA
    228.5 TX-27 Ortiz -0.230 CHC Iraq, FISA

    Now we’re getting a little closer to the light at the end of the tunnel. Under this scenario, Jim Costa becomes the pivot point. He’s a Blue Dog, and there are still a few Blue Dogs above him, but we’re starting to reach the bottom of New Dem terrain. Of the 26 Dems we’ve added under this scenario, only one of them is projected to slot in below the pivot point: Paul Carmouche in LA-04 (-0.200).

    Now let’s look at the extremely optimistic scenario (56 pickups, including all Likely Rs):

    Rank District 110th Rep. 110th Score Caucus Bad Votes
    215 WA-09 A. Smith -0.308 NDC FISA
    216 TX-15 Hinojosa -0.304 CHC Iraq, FISA
    222 AK-AL Berkowitz -0.300
    222 AZ-01 Kirkpatrick -0.300
    222 FL-13 Jennings -0.300
    222 IL-14 Foster -0.300 Unaff. Iraq
    222 IL-18 Callahan -0.300
    222 MN-06 Tinklenburg -0.300
    222 MO-06 Barnes -0.300
    222 MO-09 Baker -0.300
    222 NC-08 Kissell -0.300
    222 OH-16 Boccieri -0.300
    222 WV-02 Barth -0.300
    228 MD-02 Ruppersburger -0.292 Unaff. Iraq, FISA
    229 TX-16 Reyes -0.291 CHC Iraq, FISA
    230 OH-06 C. Wilson -0.289 BDC, Fr. Iraq, FISA
    231.5 IA-03 Boswell -0.288 BDC FISA
    231.5 PA-07 Sestak -0.288 NDC, Fr. Iraq, FISA
    233 AL-07 A. Davis -0.286 NDC, CBC Iraq, FISA
    234 FL-22 Klein -0.278 NDC, Fr. FISA
    235 CO-03 Salazar -0.275 BDC, CHC Iraq, FISA
    236 NY-20 Gillibrand -0.272 BDC, NDC, Fr. Iraq, FISA
    237.5 AR-02 Snyder -0.271 NDC Iraq, FISA
    237.5 CA-18 Cardoza -0.271 BDC, CHC FISA
    239 WV-01 Mollohan -0.269 Unaff. Iraq
    240 KY-06 Chandler -0.264 BDC, NDC Iraq, FISA

    We’re finally starting to make some progress. Under this scenario, #218 is part of an 11-way tie, but #216 is Ruben Hinojosa. We’re pretty much out of Blue Dog territory here, and the pivot point has started to move into the realm of the New Dems. Unfortunately, we’re also starting to reach a point of diminishing returns here: to bring about a 56-seat pickup, this requires sweeping not only all the moderate suburban seats but also a lot of seats that are more rural and conservative, meaning that we’ve added to the ranks of Dems who fall below the pivot point (18 of the new 56 fall at or below the pivot point).

    And unfortunately, you can see we’re still at a pivot point where most of the veterans have voted the wrong way on the most recent Iraq Supplemental and FISA bills. For instance, we’re still a little short of pushing down Lipinski, Kanjorski, Etheridge, Dicks, or Dennis Moore.  However, the important thing to remember is that it will be a different playing field: one where, most likely, they’ll be working with President Obama rather than fretting over how best to oppose President Bush. Congress won’t need to act as a brake on out-of-control Iraq policy, and FISA… well… FISA remains a big question mark, but it’s unlikely that Congress would need act as a brake on further attempts to expand the President’s unchecked powers.

    Instead, we’ll be needing to worry about whether we have enough votes to overcome any Blue Dog defections from Obama’s agenda. No doubt there will be enough votes to overcome any defections on the relatively uncontroversial stuff (there was only one Dem defection on the SCHIP veto override [Jim Marshall], and only two defections on the Employee Free Choice Act [Boren and Taylor]). But we need enough Progressive votes in the House to push Blue Dog objections to, say, universal health care and more progressive tax brackets, down below the pivot point.

    One last Stupid Excel Trick before wrapping it up. This left me thinking of the last time the Democrats had a Congressional majority: the first two years of the Clinton administration, which were a legislative disaster by most anyone’s standards, where conservative Democrats (I suppose they were still ‘Boll Weevils’ back then; the term ‘Blue Dog’ hadn’t really been invented yet) scuttled most attempts to implement anything other than the most incremental change. Let’s take a quick look at where the pivot point was back then:

    Rank District 103rd Rep. 103rd Score
    216 WI-01 Barca -0.169
    217 TX-02 C. Wilson -0.166
    218 AR-01 Lincoln -0.161
    219 TX-25 Andrews -0.154
    220 CA-19 Lehman -0.152
    Very very long break…
    260 LA-03 Tauzin 0.083
    261 NY-23 Boehlert (R) 0.088
    262 FL-01 Hutto 0.090
    263 ME-02 Snowe (R) 0.098

    (This table doesn’t include 3 Republicans who fall in the gap: Morella at 250, Fish at 256, and Gilman at 258, and 1 Democrat who’s off the chart: Ralph Hall at 272).

    If there’s any wonder why Clinton got hosed during his first term, this is it. Even though he started office with a gaping 258-176-1 edge in the House (right where we’d be under the average scenario from above, with 26 pickups), look at the DW-Nominate score for his pivot point: Blanche Lincoln (who now has graduated to the Senate): – 0.161. (And yes, right above her is Charlie Wilson, of Charlie Wilson’s War fame.) That’s a significantly lower score than the current pivot point we’re saddled with (Tim Mahoney, at – 0.186). Remember that these are DW-Nominate scores, which are designed for comparing one Congress against another and measure only left-to-right movement, not the distortions caused by the size of the caucus.

    Clinton had fully 41 Democratic representatives below the pivot point, and most of them were more conservative than your average Blue Dog today. In fact, 20 of them were more conservative than today’s most conservative Dem (John Barrow)! (Only 3 of those 20 remain today, and only one as a Dem [Gene Taylor], with two party-switchers [Ralph Hall and Nathan Deal]; other delightful rogues from that gallery include Jim Traficant and Gary Condit.) So, by that measure, consider that we may well have a more progressive House right now than Clinton had to work with, despite the showy seat count in the 103rd (thanks to fewer, but more cohesive, Dems). Adding more progressives in the next Congress, on top of what he have now, will only help us more.

    The House Seats Where We Can Make the Most Progress This Year

    By popular demand (meaning questions from at least two different commenters), I need to do a follow-up to The Class of 2008: Who’s Going to Be Progressive? from last Friday that sees it through to the next step. I had previously investigated The House Seats Where We Made the Most Progress in 2006, comparing the DW-Nominate scores of new Democrats elected in 2006 against the Republicans who occupied the seats until 2006. The question arose: which seats will potentially have the biggest similar right-to-left shifts in 2008?

    There’s a big problem there. The demographic prediction method I was using in the Class of 2008 diary was, at best, a blunt instrument, and I feel a little embarrassed using it even to estimate broad categories like “Progressive” or “Blue Dog,” let alone using it to extrapolate specific legislators’ future DW-Nominate scores to three significant digits. However, I quickly realized the importance of making some educated guesses about this topic, pushed along by Mimikatz‘s diary over at Open Left. It’s important information for deciding what races to give our relatively-tiny netroots dollars to, where we can have the most leverage in moving the needle to the left.

    As an added bonus, most of the races that topped the list are lower on prognosticators’ watch lists. Many are on the DCCC’s “Emerging Races” list and on Swing State Project‘s “Likely R” or “Races to Watch” lists. Again, that stretches the effect of our dollars, and it means our targeted giving can help clue the DCCC in for what deserves “Red to Blue” status instead. Here are the top 20 races for maximum right-to-left impact:

    District 110th Rep. 110th Score 111th Rep. 111th Score Difference
    CA-46 Rohrabacher (R) 0.836 Cook (D) -0.600 -1.436
    NJ-05 Garrett (R) 0.771 Shulman (D) -0.600 -1.371
    AZ-03 Shadegg (R) 0.923 Lord (D) -0.400 -1.323
    CA-50 Bilbray (R) 0.715 Leibham (D) -0.600 -1.315
    FL-24 Feeney (R) 0.768 Kosmas? (D) -0.350 -1.118
    CO-04 Musgrave (R) 0.684 Markey (D) -0.400 -1.084
    ID-01 Sali (R) 0.852 Minnick (D) -0.200 -1.052
    TX-07 Culberson (R) 0.637 Skelly (D) -0.400 -1.037
    MI-07 Walberg (R) 0.623 Schauer (D) -0.400 -1.023
    MN-02 Kline (R) 0.615 Sarvi (D) -0.400 -1.015
    OH-01 Chabot (R) 0.665 Dreihaus (D) -0.350 -1.015
    IL-13 Biggert (R) 0.508 Harper (D) -0.500 -1.008
    MN-06 Bachmann (R) 0.703 Tinklenburg (D) -0.300 -1.003
    CA-26 Dreier (R) 0.495 Warner (D) -0.500 -0.995
    FL-15 Weldon (R – open) 0.590 Blythe? (D) -0.400 -0.990
    IL-06 Roskam (R) 0.538 Morganthaler (D) -0.450 -0.988
    NY-13 Fosella (R – open) 0.518 McMahon? (D) -0.450 -0.968
    NV-02 Heller (R) 0.561 Derby (D) -0.400 -0.961
    NE-02 Terry (R) 0.545 Esch (D) -0.400 -0.945
    NC-10 McHenry (R) 0.745 Johnson (D) -0.200 -0.945

    More over the flip…

    Now let’s look at the rest of the Toss-ups and Lean races, that didn’t fit into the previous table. These tend not to have as big a right-to-left impact, as these tend to be races where a Main Street (i.e. ‘moderate’) Republican currently occupies the seat. (Although in some cases, the moderate Republican is retiring and a probably-more-conservative Republican is running to replace him or her.) As you can probably tell, this is where the “Red to Blue” races cluster.

    District 110th Rep. 110th Score 111th Rep. 111th Score Difference
    MI-09 Knollenberg (R) 0.428 Peters (D) -0.500 -0.928
    WA-08 Reichert (R) 0.324 Burner (D) -0.600 -0.924
    IL-10 Kirk (R) 0.323 Seals (D) -0.600 -0.923
    OH-02 Schmidt (R) 0.535 Wulsin (D) -0.350 -0.885
    MN-03 Ramstad (R – open) 0.433 Madia (D) -0.450 -0.883
    NY-26 Reynolds (R – open) 0.462 Powers? (D) -0.400 -0.862
    CT-04 Shays (R) 0.241 Himes (D) -0.600 -0.841
    VA-11 Davis (R – open) 0.419 Connolly (D) -0.400 -0.819
    OH-15 Pryce (R – open) 0.413 Kilroy (D) -0.400 -0.813
    NY-29 Kuhl (R) 0.358 Massa (D) -0.450 -0.808
    MO-06 Graves (R) 0.499 Barnes (D) -0.300 -0.799
    NJ-03 Saxton (R – open) 0.288 Adler (D) -0.500 -0.788
    NJ-07 Ferguson (R – open) 0.280 Stender (D) -0.500 -0.780
    NM-01 Wilson (R – open) 0.317 Heinrich (D) -0.450 -0.767
    NY-25 Walsh (R – open) 0.312 Maffei (D) -0.450 -0.762
    NC-08 Hayes (R) 0.457 Kissell (D) -0.300 -0.757
    IL-11 Weller (R – open) 0.386 Halvorson (D) -0.350 -0.736
    NV-03 Porter (R) 0.324 Titus (D) -0.400 -0.724
    AK-AL Young (R) 0.401 Berkowitz? (D) -0.300 -0.701
    LA-04 McCrery (R – open) 0.482 Carmouche (D) -0.200 -0.682
    AZ-01 Renzi (R – open) 0.337 Kirkpatrick? D) -0.300 -0.637
    OH-16 Regula (R – open) 0.325 Boccieri (D) -0.300 -0.625

    Finally, some of you may be wondering where the smallest right-to-left impact would be felt. That would be MD-01, where Wayne Gilchrest is one of the most moderate Republicans in the House (0.257), and district demographics predict Frank Kratovil as Likely New Dem, Possible Blue Dog (- 0.350), for a difference of – 0.607. (Bear in mind that the Republican candidate this year, though, is Andy Harris, who’s well to the right of Gilchrest, so this race gains some importance.) IL-18 is runner-up, and a similar case (Aaron Schock is likely to be well to the right of retiring Ray LaHood). This leaves IA-04 as the race with a GOP incumbent and the smallest impact (Tom Latham at 0.412 versus Becky Greenwald, predicted at – 0.200, difference of – 0.612).

    If you’re wondering where the likely DW-Nominate scores came from, the short answer is: my butt. The longer answer is, I assigned a relatively round number to each category from my Class of 2008 diary, based on where Progressives, sorta-Progressives, New Dems, and so on, tended to cluster. The assigned value, however doesn’t seem as important in providing the right-to-left shift as just how wingnutty the current Republican is; see how much correlation there is between my first list and the list of vulnerable Republicans as predicted by my PVI/Vote Index.

    Here are the assigned values (along with the Dem representatives who have scores in the 110th closest to those scores, so you have a point of comparison):

    Likely Progressives: – 0.600 (Diane Watson, Mike Honda, Alcee Hastings)

    Likely Progressives, Possible New Dems: – 0.500 (Zoe Lofgren, E.B. Johnson, Charlie Rangel)

    Likely New Dems, Possible Progressives: – 0.450 (Al Green, Tom Allen, Loretta Sanchez)

    Likely New Dems: – 0.400 (Albio Sires, John Yarmuth, Sander Levin)

    Likely New Dems, Possible Blue Dogs: – 0.350 (Mel Carnahan, Shelly Berkley, Brian Higgins)

    Likely Blue Dogs, Possible New Dems: – 0.300 (Ruben Hinojosa, Dutch Ruppersburger, Silvestre Reyes)

    Likely Blue Dogs: – 0.200 (Baron Hill, Zack Space, Allen Boyd)

    Based on people’s comments from the Class of 2008 diary where they gave some anecdotal evidence that so-and-so scored too low, I gave a +0.100 bonus to Schauer, Kissell, Baker (in MO-09), and Barth, lifting them out of Blue Dog terrain. Please keep the comments coming, in case there are any other cases you see where someone’s ranking doesn’t pass the smell test.

    The Class of 2008: Who’s Going to be Progressive?

    A few days ago I wrote about the House districts that made the greatest progress in 2006, moving from Republican to Democrat and, in the best cases, moving from wingnut to progressive. That left me wondering, however, where would the greatest changes in the House come in 2008? Unfortunately, that would require knowing where on the liberal/conservative spectrum the likely new freshmen in 2008 are likely to fall. That’s something where there won’t be useful metrics until at least, say, late 2009. After trying hard to put that question out of my mind, finally I decided, “Damn it, I want to know right now.”

    I tried looking at issue pages and other content on a few candidate websites… and man, did my eyes glaze over fast. While I was pleased to see a general conformity with Democratic messaging and avoidance of right-wing talking points, there was little there to help a discerning eye differentiate between a Progressive, a New Dem, or a Blue Dog. Basically, everyone hates high gas prices and global warming; everyone loves job creation, access to health care, cute children, firefighters, and standing in front of scenic views in their districts.

    So, I was left with no alternative but to do what any reasonable nerd would do when faced with the task of extrapolating future events: I performed a Poblano-style analysis using a variety of demographic factors, bearing in mind what demographics in a district tend to lead to what kind of representative getting elected. Just as whether a district would go for Obama or Clinton turned out to have little relationship to that district’s PVI, the PVI alone isn’t a good indicator for whether a district is likelier to produce a Progressive, a New Dem, or a Blue Dog.

    More over the flip…

    However, it’s not that complex: you need to factor in PVI (preferably more Dem-leaning), region (preferably northeast or west), ruralness (preferably more urban), education (preferably higher), and per capita income (preferably higher). (And this only applies in majority-white districts; obviously, there are a lot of districts that elect Progressives that have very low education and PCI numbers, but those are usually also non-white districts. Since Democrats already control all districts where Anglos are a distinct minority except for the three in south Florida, I just ignored that potential problem.) There’s only one element of ‘special sauce’ where I awarded bonus points, and that’s having endorsed the Responsible Plan for withdrawal from Iraq, which has become something of a statement of one’s progressive bona fides.

    In testing the formula against the current crop of freshmen, it worked very well at predicting whether or not a representative would become a Blue Dog (and there are a lot of them among the current freshmen). It was a little screwier when predicting who would be a Progressive vs. who would be a New Dem. (For instance, it predicted John Hall and Peter Welch would be New Dems, while Joe Sestak and Ed Perlmutter would be Progressives (the opposites are true). Not that it matters too much, as the differences aren’t that great; it tends to be the difference between a Progressive Punch score of, say, 94 vs. 92.) Therefore, rather than using hard-and-fast predictions, I’ve tried to blur the boundaries a bit, with some ‘maybe’ categories on the cusp.

    One last point to reiterate: these rankings don’t express how likely the Democrats are to pick up these seats. They express where these candidates, if elected, are likely to fit in on the liberal/conservative spectrum. The following tables include the demographics for districts for the candidates in toss-up and leaning seats, according to Swing State Project predictions. I also included all of our candidates in ‘likely R’ and ‘race to watch’ races, but I’m not including full demographic information in the tables for them. (A question mark next to the name means a primary still needs to be resolved.)

    Likely Progressives

    District Candidate PVI Region Rural % 4-yr. degree % PCI
    CT-04 Himes D+5 NE 4.1 42.2 41K
    IL-10 Seals D+4 MW 0.4 47.5 39K
    WA-08 Burner * D+2 W 12.4 37.4 31K

    * = Extra credit for Responsible Plan endorsement (although in Burner’s case, she’d still be “Likely Progressive” just based on district demographics alone)

    Lower on the list: CA-46 (Cook *), CA-50 (Leibham), NJ-05 (Shulman *)

    Likely Progressives, Maybe New Dems

    District Candidate PVI Region Rural % 4-yr. degree % PCI
    MI-09 Peters D+0 MW 0.7 43.5 36K
    NJ-03 Adler D+3 NE 3.8 27.2 26K
    NJ-07 Stender R+1 NE 9.6 41.5 36K

    Lower on the list: CA-26 (Warner), IL-13 (Harper), PA-06 (Roggio), PA-15 (Bennett *)

    Likely New Dems, Maybe Progressives

    District Candidate PVI Region Rural % 4-yr. degree % PCI
    MN-03 Madia R+1 MW 4.2 40.1 33K
    NM-01 Heinrich D+2 W 8.7 29.5 20K
    NY-13 McMahon (?) D+1 NE 0.0 24.0 23K
    NY-25 Maffei D+3 NE 21.0 27.8 22K
    NY-29 Massa * R+5 NE 41.6 26.1 21K

    Lower on the list: IL-06 (Morganthaler)

    Likely New Dems

    District Candidate PVI Region Rural % 4-yr. degree % PCI
    CO-04 Markey R+9 W 24.9 28.7 21K
    NV-03 Titus D+1 W 3.7 20.4 25K
    NY-26 Powers (?) R+3 NE 28.8 25.5 22K
    OH-15 Kilroy R+1 MW 8.8 32.1 23K
    VA-11 Connolly R+1 S 4.1 48.9 33K

    Lower on the list: AZ-03 (Lord), FL-15 (Blythe *?), MN-02 (Sarvi), NE-02 (Esch), NV-02 (Derby *), OH-14 (O’Neill *), PA-18 (O’Donnell), TX-07 (Skelly), VA-10 (Feder)

    Likely New Dems, Maybe Blue Dogs

    District Candidate PVI Region Rural % 4-yr. degree % PCI
    IL-11 Halvorson R+1 MW 21.8 18.5 21K
    OH-01 Dreihaus R+1 MW 5.2 22.3 20K
    OH-02 Wulsin R+13 MW 27.0 29.0 26K

    Lower on the list: CA-04 (Brown), CA-45 (Borenstein), FL-08 (Stuart?), FL-24 (Kosmas), MD-01 (Kratovil), TX-10 (Doherty)

    Likely Blue Dogs, Maybe New Dems

    District Candidate PVI Region Rural % 4-yr. degree % PCI
    AK-AL Berkowitz (?) R+14 W 34.3 24.7 23K
    AZ-01 Fitzpatrick (?) R+2 W 44.5 17.5 15K
    MI-07 Schauer R+2 MW 46.0 19.1 21K
    MO-06 Barnes R+5 MW 33.7 21.2 20K
    OH-16 Boccieri R+4 MW 26.4 19.2 21K

    Lower on the list: FL-09 (Dicks), FL-13 (Jennings), IL-18 (Callahan), KS-04 (Betts), MN-06 (Tinklenburg), PA-03 (Dahlkemper), SC-01 (Ketner)

    Likely Blue Dogs

    District Candidate PVI Region Rural % 4-yr. degree % PCI
    LA-04 Carmouche (?) R+7 S 40.7 16.7 16K
    NC-08 Kissell R+3 S 30.6 18.2 18K

    Lower on the list: AL-02 (Bright), AL-03 (Segall), ID-01 (Minnick), IN-03 (Montagano), IN-04 (Ackerson), IA-04 (Greenwald), KY-02 (Boswell), MO-09 (Baker?), NM-02 (Teague), NC-10 (Johnson), OH-07 (Neuhardt), PA-05 (McCracken), SC-02 (Miller), VA-02 (Nye), VA-05 (Perriello *), WV-02 (Barth), WY-AL (Trauner)

    (I’ve left out Annette Taddeo, Raul Martinez, and Joe Garcia, as I have no idea whether this formula applies to non-white districts. We’re basically flying blind in terms of where the Cuban-American community is headed, in terms of generational change and Castro no longer having much boogeyman power.)

    Now, granted, this is an analysis performed in a academic vacuum, bereft of any anecdotal evidence from campaign websites, press releases, appearances, local rumor mills, etc., that might give more clarity to predicting a candidate’s ideological record. (For instance, Larry Kissell may not turn out to be a Blue Dog, or at least not a bottom-of-the-barrel one like John Barrow or Jim Marshall. And that’s not just because I’m taking it on faith, like much of the blogosphere seems to, that a man who posts regularly at Daily Kos simply can’t be a Blue Dog. Check out the issues section of his website; he starts out by framing his agenda using right-wing talking points, but when you click on each one, he performs a neat bit of jujitsu on each one. That’s progressive messaging.) (And conversely, from what I’ve heard of Mike McMahon, he certainly doesn’t seem like a candidate to be a Progressive, and that’s reasonable, given the social conservatism of Staten Island.) So I’m relying on you guys in the comments to debunk my analysis and provide the anecdotes that prove that so-and-so is going to be a Progressive, district demographics be damned!