This is part of an analysis of the swing state Pennsylvania. Part three can be found here.
(A note: There will be a lot of maps in this post.)
Philadelphia: Precinct Results
My first post on the swing state Pennsylvania focused on the city Philadelphia, an incredibly Democratic city. At the time, I looked for detailed ward and precinct results but was unable to find any. Recently, however, I have come across a website which maps Philadelphia precinct results across a whole range of elections; it is a literal gold mine. This offers the opportunity to substantially deepen the previous analysis.
Below is a map, derived from the website, of the 2008 presidential election in Philadelphia (by precinct!)
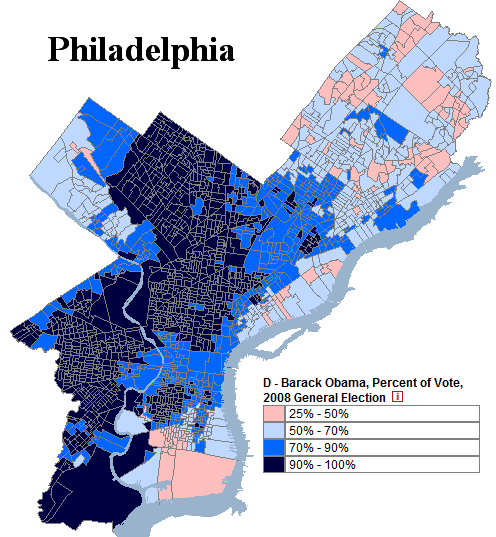
An analysis of this result below.
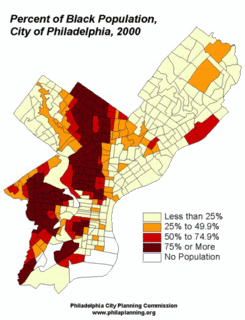
The legend ranges from President Barack Obama’s weakest precinct (25% of the vote) to his strongest (literally every single person voted for him). In total, Mr. Obama won 83.00% of the county’s vote – an amazingly high figure. For reference, below is a map of Philadelphia’s black population.
There is, of course, a distinct parallel between the two demographic maps; blacks vote heavily Democratic and will continue to do so in the foreseeable future.
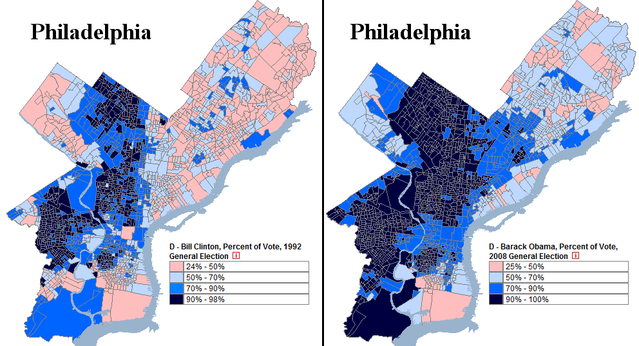
For decades, the city Philadelphia has trended Democratic. In percentage terms, its Democratic vote has increased for the past seven consecutive elections. In 1992, for example, former President Bill Clinton won 68.16% of the county. A comparison to Obama’s performance is revealing:
If there is any consolation for Republicans in all this, it is northeast (and parts of south) Philadelphia. Notice that in both maps above, Mr. Clinton and Mr. Obama perform distinctly worse here. This area of the city is populated mostly by white Catholics and Jews, although white flight has weakened their numbers. Nevertheless, northeast Philadelphia remains far whiter than the rest of the city, and as assimilated Catholics lose their traditional Democratic loyalties, Republicans have been gradually improving their percentages. John McCain actually did better than Bush in parts Northeast Philadelphia, supported by voters uncomfortable with Barack Obama’s race.
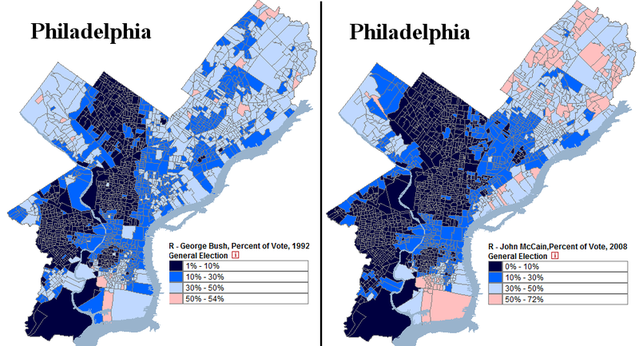
The above map hides this trend; many northeast Philadelphia voters cast their ballots for Ross Perot in 1992, so the Democratic percentage vote was artificially low that year (minority voters, on the other hand, generally did not vote for Mr. Perot). Comparing the Republican vote is more useful:
In general, Senator John McCain (who won 16.33% of the vote) does worse than former President George H.W. Bush (who won 20.19%). In the northeast, however, the opposite trend occurs. The shift is gradual and slow – not like West Virginia’s rapid red turn – but enough to be noticeable.
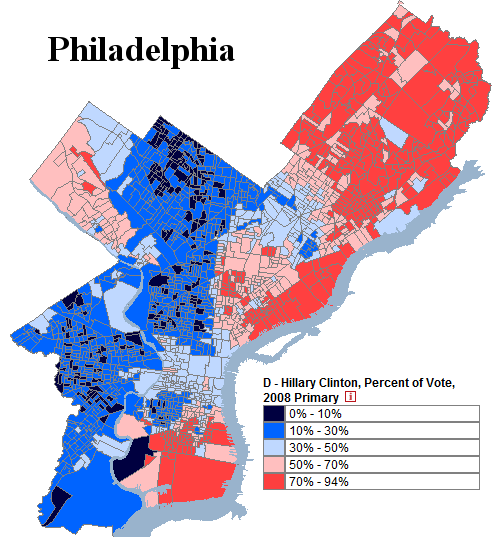
Under perfect conditions, growing Republican strength might result in something like this:
This is Secretary of State Hillary Clinton’s performance during the Pennsylvania primary. The senator won a respectable 34.80% of Philadelphia’s vote, fueled by support amongst white Catholics in the northeast. As evident in the map, the city contained extensive polarization; the majority of precincts gave over 70% of the vote to one candidate. In effect, Philadelphia split into two different blocs.
To be clear, Republicans will have a very difficult time achieving a result like this. It would take a momentous change for white Catholics to cast more than 70% of their ballots for Republicans. If this happened, moreover, winning Philadelphia would be the least of Democratic worries.
The other possibility would be for Republicans to improve their percentage amongst African-Americans. Statistically, 90+% support for any party seems untenable over a long period of time. Republicans, however, do not appear anywhere close to achieving this goal. The fact that they are more likely to reach 60% support amongst white Catholics than 15% support amongst blacks says a lot about the state of the Republican Party (and the state of America, too).
–Inoljt, http://mypolitikal.com/
Thank you again.
that went for McCain in the Germantown/Chestnut Hill area is? I’m talking about the one that looks like a needle.
That does baffle me that in a big city in the NE Corridor would have a precinct, even a small one, that went that strongly for McCain.
Not long after the election I looked up the precinct-by-precinct breakdown in the City of Baltimore. I went looking for McCain precincts. I found a small handful but none where McCain got anywhere near even 65% of the vote, let alone 75%. Baltimore is a majority-black city but has several neighborhoods that are nearly all white, but most of the precincts in those neighorhoods, including my own, were carried by Obama without much trouble.
I thought that 25% figure must have been an error, but then I looked it up, and sure enough, there it is. In a little corner of South Philly.