This is the fifth part of an analysis of the swing state Pennsylvania. It focuses on the traditionally Republican region between the Democratic strongholds in the southeast and southwest. The last part can be found here.
Pennsyltucky
Outside the Pittsburgh and the Philadelphia metropolis, Pennsylvania is a very different place. Political analysts often label this area “the T,” while others call it Pennsyltucky.
Popular culture mythologizes Pennsyltucky as red-neck capital – a rural region dominated by NASCAR-loving red-necks. Politically, James Carville compared Pennsyltucky to Alabama without the blacks.
In fact, this stereotype is inaccurate on two accounts. Firstly, Pennsyltucky contains far more than so-called rural red-necks; most of its counties are fairly populated (they are far more densely peopled than, say, rural Arkansas). Secondly, many of these supposedly NASCAR-loving red-necks also belong to the local union and vote Democratic on economic issues. The majority may support Republicans, but that majority certainly is below the 88% of Alabama whites that voted for John McCain.
Nevertheless, the “T” does constitute the Republican base in Pennsylvania. Former president George W. Bush pulled 48.42% of the state’s vote in 2004, and he had to get those votes somewhere.
More below.
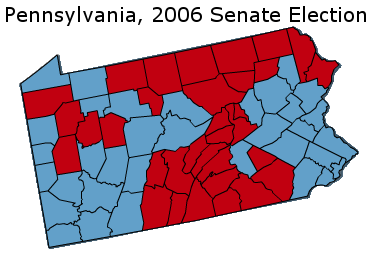
Pennsylvania’s 2006 Senate election provides a geographic illustration of this base. In that election, former Senator Rick Santorum lost by a landslide 17.36% margin; only the reddest counties supported him:
Although they cover a lot of land, not all these counties are rural enclaves of Pennsyltucky (if they were all rural, Senator John Kerry would have won by double-digits in the state). In fact, fast-growing exurbs constitute a substantial source of Republican votes. Located east of the Philadelphia metropolis, these are somewhat wealthy and mostly white. They include Lancaster County (where Bush won 65.80% of the vote) and York County (where he won 63.74%); the former president came out of these two counties with a 121,832 margin, enough to offset Pittsburgh, Erie, and Scranton.
Erie and Scranton both constitute solidly blue areas belonging to “the T.” They give lie to the myth that all Pennsyltucky votes loyally Republican. Like the southwest, Erie and Scranton contain a number of working-class Democrats; unlike the southwest, however, cultural appeals have not swayed these folk into voting Republican.
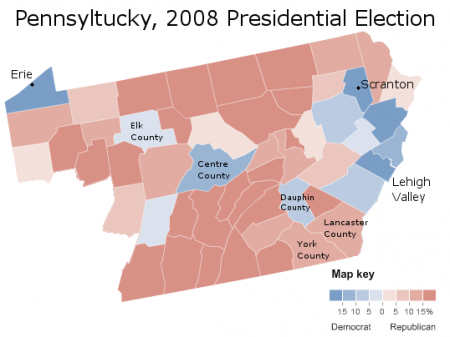
Indeed, Democrats do respectably in many parts of Pennsyltucky. Here is President Barack Obama’s performance:
Mr. Obama did not just win Erie and Scranton; he took several other counties and ran closely elsewhere. These included Centre County, home to Pennsylvania State University, and Dauphin County, which has a relatively high black population. All the Lehigh Valley – somewhat an extension of Philadelphia’s suburbs – voted for the president. More surprisingly, Obama ran very closely in several rural, lily-white regions of the T; one such county (Elk) even gave the president a 4% margin of victory.
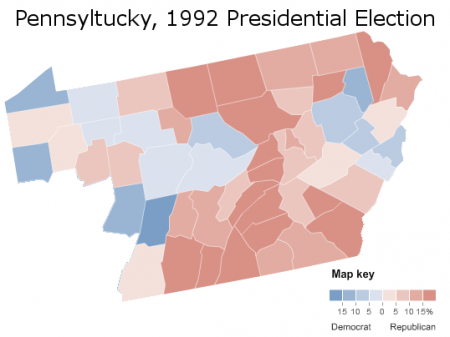
Obama was not the only Democrat to do well in parts of Pennsyltucky. Here is how former president Bill Clinton performed:
Mr. Clinton, of course, was a fellow with immense appeal to so-called “red-necks.” Since his time, much of Pennsyltucky has moved to the right. Yet not all of it is deep-red: while some counties gave Mr. McCain more than 70% of the vote, others – demographically identical – gave him barely more than 50%. These are substantial and curious variations.
While Pennsyltucky as a whole votes strongly Republican, it is wrong to generalize the area. Its most populous regions – the exurbs – constitute a vital part of the Republican coalition, while some rural counties have a fairly weak Republican habit. Finally, a number of places dependent upon industry routinely support Democrats. To stereotype the “T” as a composed solely of Republican-voting red-necks would do injustice to the region’s complexities.
(Note: All statistics come from http://uselectionatlas.org/ . Some pictures modified from the NYT.)
–Inoljt, http://mypolitikal.com/


the west have of the state (except Erie) is moving right