PBI (Party Brand Index) Part 2: Colorado & Virginia (updated)

I have been working on (with some much appreciated help from pl515) a concept I’m calling PBI or Party Brand Index, as a replacement for PVI.  PVI (Partisan Voting Index), which is measured by averaging voting percentage from the last two presidential elections in each house district, and comparing it to how the nation as a whole voted, is a useful shorthand for understanding the liberal v. conservative dynamics of a district. But in my opinion it falls short in a number of areas. First it doesn’t explain states like Arkansas or West Virginia. These states have districts who’s PVI indicates a Democrat shouldn’t win, yet Democrats (outside of the presidency) win quite handily. Secondly why is this the case in Arkansas but not Oklahoma with similar PVI rated districts?

Secondly PVI can miss trends as it takes 4 years to readjust. The main purpose of Party Brand Index is to give a better idea of how a candidate does not relative to how the presidential candidate did, but compared to how their generic PARTY would be expected to perform. Last week I calculated PBI for Indiana, this week I tackled Colorado and Virginia.

My best case for arguing against PVI is Indiana.  Bush won Indiana quite easily in 2000 and 2004. The PVI of a number of it’s districts showed them to be quite Red. Yet in 2006 democrats won several districts despite their PVI’s. Also Obama won Indiana in 2008 a state, which based on the make up of the districts PVIs, made little sense. I therefore chose Indiana as my first test case for PBI:

Donnelly in the Indiana 2nd is a perfect example of my issues with PVI. Under PVI Donnelly is in a Republican district with a PVI of -2. But look at how Democrats have recently performed in this district. In 2008 Donnelly won reelection by 37%! Obama won this district by 9 points, and Bayh won it by 22%! Does this sound like a lean GOP district? Under PVI it is, under PBI it’s not it’s a +11 democratic district.

This week I tackled Colorado and Virginia. My general strategy is to work my way “out” from swing states. Both these states have undergone noticable ideological shift. Yet the PVI of their districts haven’t moved as much. This made them ideal candidates.

COLORADO

The big difference in Colorado is that Salazar’s district goes from being a lean Republican one under PVI (-5 Republican), to a lean Democratic one (+4 Democrat), considering that a Salazar has held this same seat for some time this makes more sense. Remember I measuring total party preference not just the presidential preference of a district like PVI measures.

VIRGINIA

Virginia was the first time I had doubts on my ability to compute rough Senate numbers for House districts based on county totals. My estimates from Mark Warner Senate run yielded results of 3540% in Tom Perriello’s (VA-5th) district. This seemed way to high, even though now Senator Warner won the state with 65% of the vote.  At the time Virgil Goode was the representative from the VA-5th, and he lost by only a few hundred votes.- This lead me to do some additional research to try and discover if these numbers were published anywhere. Boy was I wrong Warner actually won the VA-5th by 65%!. Also several of the large victory margins were the results of representatives who ran unopposed. Fixed Party ID, and election results

________________________________________________________________________________

As a reminder I will review how I calculate Party Brand Index.

To compute PBI I basically did the following. I weighed the last 3 presidential elections by a factor of 0.45. Presidential preference is the most indicative vote since it’s the one politician people follow the most. The POTUS is the elected official people identify with or despise the most, thus illuminating their own ideological identification. I then weighed each house seat by 0.35. House seats are gerrymandered and the local leader can most closely match their districts make up in a way the POTUS can’t. So even though they have a lower profile I still gave them a heavy weight. Lastly I gave the last two Senate elections a weight of 0.2. Senatorial preference can make a difference, although I think it’s less than that of the President or the House members. Also (more practically) because I have to back calculate (estimate) Senate result totals from county results, a smaller number helps lessen the “noise” caused by any errors I may make. Under my system Democratic leaning have a positive number, the GOP has a negative number.

I then developed a way to weight for incumbents.  The reelection numbers for incumbents is so high it would be a mistake to weight a district solely on the fact that an incumbent continues to get elected. There is a long list of districts that have PVI that deviate from their incumbent members, whom none the less keep getting elected. These districts then change parties as soon as the incumbent member retires. This is evidence that incumbency can disguise the ideology of voters in a district.

Next I added a weighting of about 7% for House members. I remember reading that incumbency is worth about 5-10%. Nate wrote in a 538.com article that a VP pick from a small state was worth about a 7% swing, a house seat could in fact be thought of as a small state, that seems as good a number as any to start from. Conversely I will deduct 7% from an incumbents win. I think this will score them closer to the natural weight of a district. By the way I’m weighting the win 7% less, not actually subtracting 7% from the number.  Open seat races will be considered “pure” events and will remain neutral as far as weighting goes.  A seat switching parties will also be considered a neutral event. The 1st defense of a seat by a freshman house member will be given a weighting of 2%. The toughest race for any incumbent is their 1st defense. I decided to adjust for this fact. Note: Indiana’s bloddy 9th was a tough call a case could be made that when a seat keeps flipping, and the same two guys run 4 straight times in a row each election should be a neutral event.

Senate weighting is as follows. In state with a single House seat the Senate seat will be weighted the same as a house. In states with multiple seats, the Senate will get a weighting of 2%. Nate Silva stated that a VP pick in a large state is worth this amount. An argument could be made for a sliding scale of Senate weighting from 2-7%, this added complexity may be added at a later date. I will give incumbent presidents a 2% weighting, until I get better data on how powerful a “pull” being the sitting POTUS is, I will give them the same weighting as a senator.

______________________________________

Still to come:

The last major issue is how to deal with the “wingnut” factor. Sometimes a politician like Bill Sali (R-Idaho) or Marylin Musgrove (R-CO)lose because their voting record is outside of the mainstream of their district. I decided to try and factor this in.  

First I had to take a brief refresher on statistics. I developed a formula based on standard deviations. Basically I can figure out how much the average rep deviates from their district.  If I then compare where a reps voting pattern falls (in what percentile) and compare it to their district’s PVI, I can develop a “standard deviation factor”. Inside the standard deviation will get a bonus, outside a negative.

For example, if Rep X is the 42 most conservative rep, that would place her in the 90th percentile. But if her district’s PVI was “only” the in the 60th, their is a good chance her margins would be effected. Using a few random samples I found most reps lie within 12% of their district’s PVI.

Using these dummy numbers I then came up with this.  


   SQRT[(30-12)^2 /2] = about 13%

    Her factor would then be 100 – 13 = 0.87.

So her victory margin would be weighted by 0.87 because she is more than 12% beyond her acceptable percentile range it making the victories in her district approximate 13% less “representative”.

    My theory yields the following formula:

        If rep’s voting record is > PVI then

            100 – SQRT[({Record percentile – PVI} – Standard PVI Sigma)^2 /2] = factor

        else if rep’s voting record < PVI

             100 + SQRT[({Record percentile – PVI} – Standard PVI Sigma)^2 /2] = factor

To really do this I need to compute the standard deviation for all 435 reps, which is a pretty large undertaking. Instead  I will do a google search  to see if anyone has already done this. If not well it will take some time. But this would deal with the wingnut factor. Since politician tend to vote relatively close to their districts interest (even changing voting patterns over time) this may not be a major issue. But developing this factor may eventually allow the creation of a “reelection predictor”, so I am still going to work on it.

One last note, the corruption factor (for example Rep. Cao (R-LA) beating former Rep. Jefferson) is outside of any formula I can think of. The only saving grace here is that because my formula uses several elections, the “noise” from a single event will eventually be reduced.

NEXT UP: NC and MO

Introducing PBI (Party Brand Index)

I have been working on (with some much appreciated help from pl515) a concept I’m calling PBI or Party Brand Index, as a replacement for PVI.  PVI (Partisan Voting Index), which is measured by averaging voting percentage from the last two presidential elections in each house district, and comparing it to how the nation as a whole voted, is a useful shorthand for understanding the liberal v. conservative dynamics of a district. But in my opinion it falls short in a number of areas. First it doesn’t explain states like Arkansas or West Virginia. These states have districts who’s PVI indicates a Democrat would be in a hard position to win, never the less Democrats (outside of the presidency) win quite handily. Secondly why is that the case in Arkansas but not Oklahoma with similar PVI rated districts?

Secondly PVI can miss trends as it takes 4 years to readjust. The main purpose of Party Brand Index is to give a better idea of how a candidate does not relative to how the presidential candidate did, but rather compared to how their generic PARTY would be expected to perform. I’m calling this Party Brand Index.

My best case for arguing against PVI is Indiana.  Bush won Indiana quite easily in 2000 and 2004. The PVI of a number of it’s districts showed them to be quite Red. Yet in 2006 democrats won several districts despite their PVI’s. Also Obama won Indiana in 2008 a state, which based on the make up of the districts PVIs, made little sense. I therefor chose Indiana as my first test case for PBI.

Indiana also had a number of other oddity that made it an interesting test case. Indiana has Senators from opposite parties that each won election by large blowouts. Lugar’s in particular was enormous as he was essentially unopposed. Indiana also had a number of districts that flipped in the 3 election cycle expanse that I’m examining. Finally it makes the best case for why PVI can be misleading.

To compute PBI I basically did the following. I weighed the last 3 presidential elections by a factor of 0.45. Presidential preference is the most indicative vote since it’s the one politician people follow the most. The POTUS is the elected official people identify with or despise the most, thus illuminating their own ideological identification. I then weighed each house seat by 0.35. House seats are gerrymandered and the local leader can most closely match their districts make up in a way the POTUS can’t. So even though they have a lower profile I still gave them a heavy weight. Lastly I gave the last two Senate elections a weight of 0.2. Senatorial preference can make a difference, although I think it’s less than that of the President or the House members. Also (more practically) because I have to back calculate (estimate) Senate result totals from county results, a smaller number helps lessen the “noise” caused by any errors I may make.

I was then left with this chart:

I now began to look at the results. Under my system Democratic leaning have a positive number, the GOP has a negative number. Donnelly in the Indiana 2nd is a perfect example of my issues with PVI. Under PVI Donnelly is in a Republican district with a PVI of -2. But look at how democrats have recently performed in this district. In 2008 Donnelly won reelection by 37%! Obama won this ditrict by 9 points, and Bayh won it by 22%! Does this sound like a lean GOP district? Under PVI it is, under PBI it’s not it’s a +11 democratic district.

I then decided to go all Nate Silvaish and gave more recent elections a greater weight. I gave an addition 5% weight to each election as it got closer to the most recent election. To be honest I pulled 5% out of my dairy air but Nate gave a similar weighting to poll results as fresher ones came in 2008, so I copied this formula. This resulted in the following:

The next issue I decided to tackle was to develop a way to weight for incumbents.  The reelection numbers for incumbants is so high it would be a mistake to weight a district soley on the fact that an incumbat continues to get elected. There is a long list of districts that have PVI that devate from their incumbant members, whom none the less keep getting elected. These disticts then change parties as soon as the incumbant member retires. This is evidence that incumbancy can disguise the ideology of voters in a district.

I decided on a weight of about 7% for House members. I remember reading that incumbency is worth about 5-10%. Also Nate wrote in a 538.com article that a VP pick from a small state was worth about a 7% swing, a house seat could in fact be thought of as a small state, that seems as good a number as any to start from. Conversely I will deduct 7% from an incumbents win. I think this will score them closer to the natural weight of a district. By the way I’m weighting the win 7% less, not actually subtracting 7% from the number.  Open seat races will be considered “pure” events and will remain neutral as far as weighting goes.  A seat switching parties will also be considered a neutral event. The 1st defense of a seat by a freshman house member will be given a weighting of 2%. The toughest race for any incumbant is their 1st defense. I decided to adjust for this fact. Note: Indiana’s bloddy 9th was a tough call a case could be made that when a seat keeps flipping, and the same two guys run 4 straight times in a row each election should be a neutral event.

Senate weighting will be as follows. In state with a single House seat the Senate seat will be weighted the same as a house. In states with mutiple seat, the Senate will get a wighting of 2%. Nate Silva stated that a VP pick in a large state is worth this amount. An argument could be made for a sliding scale of Senate weighting from 2-7%, this added complexity may be added at a later date. I will give incumbant presidents a 2% weighting, until I get better data on how powerful a “pull” being the sitting POTUS is, I will give them the same weighting as a senator.

The main purpose of Party Brand Index is to give a better idea of how a candidate does not relative to how the presidential candidate did, but rather compared to how their generic PARTY would be expected to perform. I’m calling this Party Brand Index.

______________________________________

The last major issue is how to deal with the “wingnut” factor. Sometimes a politician like Bill Sali (R-Idaho) or Marylin Musgrove (R-CO)lose because their voting record is outside of the mainstream of their district. I decided to try and factor this in.

First I had to take a brief refresher on statistics. I developed a formula based on standard deviations. Basically I can figure out how much the average rep deviates from their district.  If I then compare where a reps voting pattern falls (in what percentile) and compare it to their district’s PVI, I can develop a “standard deviation factor”. Inside the standard deviation will get a bonus, outside a negative.

For example, if Rep X is the 42 most conservative rep, that would place her in the 90th percentile. But if her district’s PVI was “only” the in the 60th, their is a good chance her margins would be effected. Using a few random samples I found most reps lie within 12% of their district’s PVI.

Using these dummy numbers I then came up with this.  


   SQRT[(30-12)^2 /2] = about 13%

    Her factor would then be 100 – 13 = 0.87.

So her victory margin would be weighted by 0.87 because she is more than 12% beyond her acceptable percentile range it making the victories in her district approximate 13% less “representative”.

    My theory yields the following formula:

        If rep’s voting record is > PVI then

            100 – SQRT[({Record percentile – PVI} – Standard PVI Sigma)^2 /2] = factor

        else if rep’s voting record < PVI

             100 + SQRT[({Record percentile – PVI} – Standard PVI Sigma)^2 /2] = factor

To really do this I need to compute the standard deviation for all 435 reps, which is a pretty large undertaking. Instead  I will do a google search  to see if anyone has already done this. If not well it will take some time. But this would deal with the wingnut factor. Since politician tend to vote relatively close to their districts interest (even changing voting patterns over time) this may not be a major issue. But developing this factor may eventually allow the creation of a “reelection predictor”, so I am still going to work on it.

One last note, the corruption factor (for example Rep. Cao (R-LA) beating former Rep. Jefferson) is outside of any formula I can think of. The only saving grace here is that because my formula uses several elections, the “noise” from a single event will eventually be reduced.

Next Up: Colorado ( have the data done already) and Virginia

PVI/Vote Index for 2008

One year ago I tried out an experiment where I plotted US Representatives’ voting records against the presidential lean of their districts, in an effort to identify what representatives were not the most liberal or conservative, but who most overperformed or underperformed their districts. After some hemming and hawing, it was called the PVI/Vote Index. The point of the exercise was to give some clarity and focus to one of the most frequently heard refrains of the liberal blogosphere: “We’re going to primary that ratfink so-and-so,” usually delivered without much consideration as to what kind of candidate that district might actually support.

It’s time to revisit the topic, partly because another year has gone by, and aggregators have released another year’s worth of data, letting us look at the 110th Congress as a whole (instead of just 2007). Also, with the creation of the blogger/labor Accountability Now PAC for purposes of nudging (or primarying) recalcitrant Dems, with Progressive Punch adding a similar function to their website, and with even the Cook Political Report (subscription req’d) tipping a toe into this type of analysis, it seems like other people are starting to zero in on who is and isn’t a good fit for his or her district.

As before, the Index is based on a pretty simple idea: rank every district from 1 to 435 in terms of how Democratic its presidential voting record is, rank every representative from 1 to 435 in terms of how liberal his or her voting record is, and find the difference, with a larger difference in one direction or the other meaning that representative is overperforming or underperforming the district’s lean. (There are a host of methodological issues that go along with this assumption, and I’ll discuss some of them over the fold. In the meantime, let’s get right to the numbers.)

Let’s start with Democrats who are underperforming their districts (in other words, Democrats whose voting records are less liberal than their district composition would ordinarily support):

Rep. District PVI PVI rank DW/N Liberal rank Difference
A. Davis AL-07 D+17 65 – 0.286 183.5 – 118.5
Meeks NY-06 D+38 6 – 0.397 122 – 116
Meek FL-17 D+35 11 – 0.390 126 – 115
Jefferson LA-02 D+28 28 – 0.371 139 – 111
Doyle PA-14 D+22 42 – 0.363 142 – 100
Engel NY-17 D+21 45 – 0.378 137 – 92
Brady PA-01 D+36 9.5 – 0.439 96 – 86.5
Sires NJ-13 D+23 39 – 0.398 121 – 82
Berman CA-28 D+25 35.5 – 0.406 117.5 – 82
Fattah PA-02 D+39 5 – 0.454 84.5 – 79.5
D. Scott GA-13 D+10 112 – 0.257 191 – 79
Moran VA-08 D+14 81 – 0.345 152.5 – 71.5
Crowley NY-07 D+28 29 – 0.431 100 – 71
Rush IL-01 D+35 12 – 0.455 83 – 71
Lipinski IL-03 D+10 106.5 – 0.312 174 – 67.5
Reyes TX-16 D+9 117.5 – 0.286 183.5 – 66
Towns NY-10 D+41 3 – 0.492 69 – 66
Harman CA-36 D+11 103.5 – 0.319 169 – 65.5
Rangel NY-15 D+43 2 – 0.493 67 -65
Cooper TN-05 D+6 144.5 – 0.211 208.5 – 64

Three of the top four underperformers here were also in the top four last year: Artur Davis, Kendrick Meek, and Bill Jefferson, which indicates that the pattern is pretty consistent. (The fourth, Greg Meeks, not coincidentally the only African-American member of the New Dems besides Davis and Meek, replaces Charlie Rangel.)

Notice something else interesting? We don’t have to primary any of those three! Jefferson learned the hard way that the future is Cao, while Davis and Meek are doing us a solid by opening up their seats to run for higher office. (And if they somehow win, they’ll immediately switch from goats to heroes in my book, since if they stay consistent policy-wise, they’ll suddenly be vastly overperforming the lean of their states as a whole.)

But it does shine a spotlight on the open primaries in AL-07, FL-17, and LA-02. These primaries should be absolute top priority for blogosphere action: these are districts that can support progressives, not just centrists, and we have basically free shots at electing Better Democrats here. (These mostly-African-American districts may be a little outside the familiarity zone of the mostly-white blogosphere, but remember that one of our signature achievements is knocking off Al Wynn in MD-04, which is what can happen when the netroots and the local grassroots actually work in concert.)

As with last year, the list is heavy on Congressional Black Caucus members, some of whom are also Progressive Caucus members. The latter may not be terribly fruitful targets (although, again, the primaries will be very important once they retire), who are being penalized a bit unfairly for living in some of the nation’s most Democratic districts. They’d need to be in McDermott/Kucinich/Lee territory to be truly apt ‘fits’ for their districts.

Some better targets might be a little further down the list, including frequent netroots foils like Dan Lipinski and the newly-vulnerable Jane Harman. To my eye, one of the juiciest targets is Jim Cooper, about the only representative in a district with a solidly Dem PVI who’s not just voting poorly around the margins but on some of the important stuff as well (like the stimulus). Pressure on Cooper is particularly important as the focus turns to health care, as his singular influence in the health care arena gives him unique power to obstruct progessive health care policy.

Now let’s turn to the good news: the Democrats who are most overperforming their districts, and who are most deserving of our praise (or in the case of the bluest Dogs, our tolerance). As with last year, it’s a mix of flat-out progressives in swing or light-blue districts, and Blue Doggish types who are entrenched in deep-red districts that would likely flip without them (or, in the sad cases of Lampson and Boyda, Blue Doggish types who failed to get entrenched):

Rep. District PVI PVI rank DW/N Liberal rank Difference
C. Edwards TX-17 R+18 417 – 0.240 196 221
G. Taylor MS-04 R+16 404.5 – 0.248 193 211.5
Matheson UT-02 R+17 408 – 0.154 222 186
Pomeroy ND-AL R+13 379 – 0.245 194 185
DeFazio OR-04 D+0 200 – 0.602 27 173
Lampson TX-22 R+15 390 – 0.038 234 156
Doggett TX-25 D+1 187.5 – 0.533 49 138.5
Herseth SD-AL R+10 337 – 0.234 199 138
Skelton MO-04 R+11 347 – 0.203 212 135
Hinchey NY-22 D+6 147 – 0.685 13 134
Stupak MI-01 R+2 228.5 – 0.436 97 131.5
Filner CA-51 D+7 137 – 0.723 9.5 127.5
Oberstar MN-08 D+4 160 – 0.570 36 124
Kucinich OH-10 D+8 125 – 0.791 3 122
Spratt SC-05 R+6 283.5 – 0.325 165 118.5
Obey WI-07 D+2 185 – 0.486 72 113
Chandler KY-06 R+7 300.5 – 0.256 192 108.5
Rodriguez TX-23 R+4 254.5 – 0.348 150 104.5
Boyda KS-02 R+7 308 – 0.218 206 102
Boucher VA-09 R+7 303 – 0.232 201 102

One advantage of the PVI/Vote Index is that, at the same time as shining a light on Democrats who are lagging their districts, it also illuminates right-wing Republicans camped out in moderate districts, who should theoretically be vulnerable a good Democratic challenger because of their poor fit with their districts. If there’s any doubt, check out which of these nutjobs who’ve overperformed their districts got defeated in 2008, and how many more got a serious scare.

Rep. District PVI PVI rank DW/N Liberal rank Difference
Ryan WI-01 R+2 224 0.690 397 – 173
Feeney FL-24 R+3 241 0.744 409 – 168
Chabot OH-01 R+1 205.5 0.626 372 – 166.5
Garrett NJ-05 R+4 261 0.771 417 – 156
Shadegg AZ-03 R+6 288.5 0.903 429 – 140.5
Rohrabacher CA-46 R+6 291 0.826 424.5 – 133.5
Kline MN-02 R+3 233.5 0.616 365 – 131.5
Bilbray CA-50 R+5 264 0.684 394 – 130
Fossella NY-13 D+1 191 0.507 317 – 126
Walberg MI-07 R+3 230.5 0.589 356.5 – 126
Weldon FL-15 R+4 251.5 0.622 367.5 – 116
Campbell CA-48 R+8 311 0.826 424.5 – 113.5
Bachmann MN-06 R+5 273.5 0.663 385.5 – 112
Manzullo IL-16 R+5 263 0.630 374 – 111
Franks AZ-02 R+9 322 0.910 431 – 109
Tiberi OH-12 R+1 210 0.508 318 – 108
Royce CA-40 R+8 315 0.794 421 – 106
Roskam IL-06 R+3 236.5 0.552 341 – 104.5
Mica FL-07 R+4 251.5 0.583 355 – 103.5
Castle DE-AL D+7 142 0.291 245 – 103

Finally, one last table: the Republicans who are “underperforming” their very conservative districts. While there are a few moderates here (like the primaried-out Wayne Gilchrest), mostly it’s semi-sane conservatives in some of the darkest-red districts in the nation. I’m keeping this list to 10, as either way, there’s not much we can do about these guys, other than sit back and watch as the Club for Growth goes after them with chainsaws. (Note that Jerry Moran, who’s vacating his seat to run for Senate, is one of them. His moderation, relatively speaking, may be an asset for him when running statewide.)

Rep. District PVI PVI rank DW/N Liberal rank Difference
W. Jones NC-03 R+15 395 0.279 242 153
Simpson ID-02 R+19 421 0.397 271 150
Moran KS-01 R+20 427 0.442 286 141
Platts PA-19 R+12 366 0.327 255.5 110.5
D. Young AK-AL R+14 387 0.420 278.5 108.5
Lucas OK-03 R+18 414 0.493 310 104
Crenshaw FL-04 R+16 407 0.489 308 99
Bachus AL-06 R+25 433 0.538 335.5 97.5
Gilchrest MD-01 R+10 335 0.254 238 97
Aderholt AL-04 R+16 399 0.476 303 96

Much more discussion of the methodology and what this all may mean, over the flip.

We need to talk methodology briefly. I’ll do this as a Q&A in order to make it a little livelier.

What the heck is DW/N? As my primary vote-aggregating resource, I’m using DW/Nominate scores, which are a tool I used in a number of vote-scoring-themed diaries last summer. The main advantage DW/N has over other scores is that they aggregate absolutely every vote, instead of cherry-picking. (ADA ratings and CQ party unity scores, for instance, pick so few votes that it’s terribly insufficient gradation among representatives; nearly all Dems have an ADA score of 90, 95, or 100, while nearly all have a CQ score in the 96-98 range… which is why I don’t use either of those metrics.) In each case, I’m using the DW/N score of whatever representative ended the session holding the seat, even if someone else held it the majority of the term.

On the other hand, most everyone else (Progressive Punch, National Journal, CQ, the ADA) uses a 0-100 score, with 100 being most liberal, which is easy for people to mentally convert to the A-B-C-D-F grading scale. By comparison, DW/Nominate scores are difficult to interpret. The scores generally run from – 1 (most liberal) to 1 (least liberal). The scoring algorithm seems to measure similarities between voting records among representatives; a number further away from 0 indicates a greater amount of distance between your record and those of other reps. In fact, if your voting record doesn’t look anything like anybody’s elses, you can exceed the 1 to -1 range (as with Ron Paul’s 1.4).

You may recall last year, to do this project, I created one averaged-out liberal rating using both Progressive Punch and National Journal scores. While I’d very much like to use Progressive Punch scores again — I think they do the best job of the “just right” amount of vote cherry-picking and turning it into an easy-to-understand score — they’ve already turned their attention to the 111th Congress now in session and their old scores from the 110th have already vanished from public view.

And rather than try to average out DW/Nominate and National Journal scores, I’ve just decided there’s too much apples and oranges going on there. This is partly because of the different scoring techniques, which results in some odd discrepancies… National Journal’s method is insensitive to ‘purity’ votes (i.e. voting against something not because you disagree but because it doesn’t go far enough) so the furthest-left or right members of the caucuses (like McDermott, Kucinich, Stark, DeFazio, Woolsey, Waters, or Capuano for the Dems, or Paul for the GOP) tend to get buried in mid-caucus or even treated as centrists.

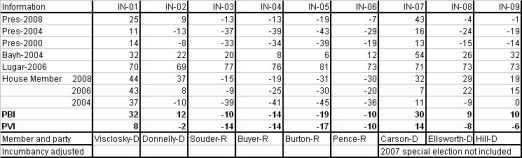
More importantly, though, there are 19 seats for which there is no National Journal composite score for both 2007 and 2008, mostly because the seat changed hands in a special election (or because of a lot of absences, either for sickness or leadership duties). As a result, what I’ve decided to do is run entirely separate tables based solely on National Journal numbers. As you can see, many of the same people appear relatively in the same places. Members for whom there are scores, and the PVI of their districts, are rated 1-416 instead of 1-435. (The missing parties are Pelosi, Lantos/Speier, Millender-McDonald/Richardson, Crenshaw, Norwood/Broun, Rush, Hastert/Foster, Carson/Carson, Jindal/Scalise, Baker/Cazayoux, Wynn/Edwards, Meehan/Tsongas, Wicker/Childers, Andrews, Gillibrand, Gilmoor/Latta, Pryce, Davis/Wittman, and Cubin.)

Here are the tables based on National Journal composite scores instead. (There is a rating for both 2007 and 2008, so I averaged the two to get one score for each. Again, representatives and districts are ranked only 1 to 416 in this series, because scores aren’t available for 19 seats.) Here are the underperforming Dems:

Rep. District PVI PVI rank NJ Liberal rank Difference
A. Davis AL-07 D+17 60 58.15 181 – 121
Jefferson LA-02 D+28 25 74.35 119 – 94
Meek FL-17 D+35 10 78.25 95.5 – 85.5
Capuano MA-08 D+33 17 77.85 101 – 84
Stark CA-13 D+21 38 74 120 – 82
Serrano NY-16 D+43 1 80.75 80 – 79
G. Green TX-29 D+8 124.5 54.1 198 – 73.5
Lipinski IL-03 D+10 99.5 61.95 172 – 72.5
Emanuel IL-05 D+18 56 72.8 128 – 72
C. Brown FL-03 D+16 63 71.6 134.5 – 71.5
Ryan OH-17 D+14 71 70.05 142 – 71
Maloney NY-14 D+26 27 78.15 97 – 70
Meeks NY-06 D+38 6 81.05 75.5 – 69.5
M. Udall CO-02 D+8 118 57 186.5 – 68.5
Engel NY-17 D+21 40 77 108 – 68
Woolsey CA-06 D+21 42 76.75 109 – 67
Reyes TX-16 D+9 110.5 61 176 – 65.5
Berkley NV-01 D+9 113 60.55 177 – 64
Waters CA-35 D+33 18 80.25 81.5 – 63.5
Cooper TN-05 D+6 136.5 53.95 199 – 62.5

Here are overperforming Dems:

Rep. District PVI PVI rank NJ Liberal rank Difference
C. Edwards TX-17 R+18 400 55.7 193 207
Pomeroy ND-AL R+13 363 61.55 175 188
Matheson UT-03 R+17 391 48.85 218 173
G. Taylor MS-04 R+16 388.5 48.65 219 169.5
Skelton MO-04 R+11 332 58.55 180 152
Lampson TX-22 R+15 374 45.4 227 147
Obey WI-07 D+2 177 85.15 42 135
Herseth SD-AL R+10 323.5 52.6 203 120.5
Spratt SC-05 R+6 272.5 65.75 153 119.5
Price NC-04 D+6 138 89.1 22 116
Mollohan WV-01 R+6 275.5 63.75 163 112.5
Delahunt MA-10 D+9 116 91.4 11 105
Hinchey NY-22 D+6 139 86.4 35 104
Boyda KS-02 R+7 296 55.4 194 102
Boucher VA-09 R+7 291 56.55 189 102
Hooley OR-05 D+1 185 80.1 85.5 99.5
Holden PA-17 R+7 288.5 56.1 191 97.5
Chandler KY-06 R+7 288.5 55.15 195 93.5
Capps CA-23 D+9 108 90.35 16 92
Grijalva AZ-07 D+10 103 91.2 12 91

Here are the overperforming Republicans:

Rep. District PVI PVI rank NJ Liberal rank Difference
Kline MN-02 R+3 223.5 10 398 – 174.5
Mica FL-07 R+4 241.5 11.75 386 – 144.5
Feeney FL-24 R+3 231 14.1 372.5 – 141.5
Ryan WI-01 R+2 215 16.4 352 – 137
Shadegg AZ-03 R+6 277.5 5.5 412 – 134.5
Bachmann MN-06 R+5 262.5 10.55 396 – 133.5
Weldon FL-15 R+4 241.5 14.35 370.5 – 129
Saxton NJ-03 D+3 162.5 30.95 280 – 117.5
H. Wilson NM-01 D+2 170 28.7 283 – 113
Garrett NJ-05 R+4 251 15.45 360 – 109
Walberg MI-07 R+3 221 20.6 328 – 107
Putnam FL-12 R+5 267.5 14 374 – 106.5
Franks AZ-02 R+9 310 4.7 416 – 106
Chabot OH-01 R+1 197.5 24.9 301.5 – 104
Fossella NY-13 D+1 183 28.2 286 – 103
S. King IA-05 R+8 305 6.5 407.5 – 102.5
Latham IA-04 D+0 188 28.25 285 – 97
M. Rogers MI-08 R+2 212 24.1 308.5 – 96.5
Royce CA-40 R+8 303 9.9 399 – 96
Akin MO-02 R+9 311 6.6 406 – 95

And finally, here are the underperforming Republicans:

Rep. District PVI PVI rank NJ Liberal rank Difference
Moran KS-01 R+20 408 33.45 268 140
W. Jones NC-03 R+15 379 38.5 247 132
Simpson ID-02 R+19 403 31.5 275 128
D. Young AK-AL R+14 371 36.25 257 114
Paul TX-14 R+14 373 35.3 261 112
Gilchrest MD-01 R+10 322 49.4 217 105
Bachus AL-06 R+25 414 23.2 314 100
Platts PA-19 R+12 351 36.75 254.5 96.5
Inglis SC-04 R+15 375 31.1 279 96
Emerson MO-08 R+11 335 40.55 240 95

Is this old or new PVI? This is Classic PVI, calculated using the Cook formula and based on 2000-2004. My rationale is that their 110th Congress votes all predate the 2008 election, so if representatives actually were taking their districts’ lean into consideration, it would be based on the previous elections.

Still, this raises the interesting question of whether the 2008 election results have changed the dynamic for representatives in those few districts that changed dramatically one way or the other (for instance, are Marion Berry or Mark Kirk more endangered now?). Perhaps some of them might change their records in the 111th Congress, for better or worse, to reflect what they can see is happening on the ground in their districts. Accordingly, I’m creating yet more tables… this time, based on the newly released Cook PVIs reflecting the 2004 and 2008 elections. (I’m leaving out defeated or retired representatives from these lists, which, for instance, removes Jefferson from the underperforming Dems list, or Chabot and Feeney from the overperforming GOPers list.)

Here are the underperforming Dems. Not that many dramatic changes, but note that David Scott has zoomed up to near the top of the list, as his previously D+10 district in the Atlanta exurbs became D+15 on the strength of a huge influx of African-American residents. He’s one of only two black Blue Dogs (Sanford Bishop in rural GA-02 is the other one, and is a fine fit), and might want to rethink that.

Rep. District PVI PVI rank NJ Liberal rank Difference
A. Davis AL-07 D+18 60 – 0.286 183.5 – 123.5
D. Scott GA-13 D+15 71 – 0.257 191 – 120
Meeks NY-06 D+36 7 – 0.397 122 – 115
Meek FL-17 D+34 13 – 0.390 126 – 113
Moran VA-08 D+16 64 – 0.345 152.5 – 88.5
Doyle PA-14 D+19 55 – 0.363 142 – 87
Brady PA-01 D+35 10 – 0.439 96 – 86
Fattah PA-02 D+38 4 – 0.454 84.5 – 80.5
Berman CA-28 D+23 37 – 0.406 117.5 – 80.5
Engel NY-17 D+18 58 – 0.378 137 – 79
Schiff CA-29 D+14 75 – 0.347 151 – 76
Reyes TX-16 D+10 109 – 0.286 183.5 – 74.5
Sires NJ-13 D+21 48 – 0.398 121 – 73
Harman CA-36 D+12 98 – 0.319 169 – 71
Rush IL-01 D+34 14 – 0.455 83 – 69
S. Davis CA-53 D+14 74 – 0.362 143 – 69
Crowley NY-07 D+26 32 – 0.431 100 – 68
Lipinski IL-03 D+11 106 – 0.312 174 – 68
Towns NY-10 D+38 3 – 0.492 69 – 66
Rangel NY-15 D+41 2 – 0.492 67 – 65

Here are the overperforming Dems. Gene Taylor overtakes Chet Edwards at the top, based on the different direction their districts are going. There are definitely more Blue Dogs and their ilk on the new list than the old list, thanks to a number of southern uplands districts plunging from GOP-leaning to dark-red (Boren, Berry, Lincoln Davis, Gordon, Mollohan, Rahall).

Rep. District PVI PVI rank NJ Liberal rank Difference
G. Taylor MS-04 R+20 415 – 0.248 193 222
C. Edwards TX-17 R+20 417 – 0.240 196 221
Matheson UT-02 R+15 386 – 0.154 222 164
Skelton MO-04 R+14 374 – 0.203 212 162
DeFazio OR-04 D+2 183 – 0.602 27 156
Boren OK-02 R+14 368 – 0.128 224 144
Pomeroy ND-AL R+10 336 – 0.245 194 142
Berry AR-01 R+8 300 – 0.338 159 141
Boucher VA-09 R+11 342 – 0.232 201 141
L. Davis TN-04 R+13 359 – 0.177 218.5 140.5
Melancon LA-03 R+12 344 – 0.220 205 139
Oberstar MN-08 D+3 174 – 0.570 36 138
Childers MS-01 R+14 369 – 0.010 236 133
Mollohan WV-01 R+9 321 – 0.268 189 132
Stupak MI-01 R+3 228 – 0.436 97 131
Gordon TN-06 R+13 350 – 0.171 220 130
Hinchey NY-22 D+6 140 – 0.685 13 127
Spratt SC-05 R+7 289 – 0.325 165 124
Rahall WV-03 R+6 286 – 0.331 163.5 122.5
Grijalva AZ-07 D+6 138 – 0.655 18 120

Here are the overperforming Republicans. There’s a lot of turnover on this list from the old PVI list, but that has more to do with defeats and retirements than vastly changed districts (Chabot, Feeney, Walberg, Tancredo, Musgrave, Keller, Tom Davis, Heather Wilson, Weldon, and Knollenberg would all clock in higher than Dave Camp). However, note the sudden appearance of a lot of Illinois, Michigan, and California districts on the new list, based on Obama’s strong performance in those states.

Rep. District PVI PVI rank NJ Liberal rank Difference
Ryan WI-01 R+2 218 0.690 397 – 179
Rohrabacher CA-46 R+6 262 0.826 424.5 – 162.5
Bilbray CA-50 R+3 232 0.684 394 – 162
Campbell CA-48 R+6 263 0.826 424.5 – 161.5
Manzullo IL-16 R+2 222 0.630 374 – 152
Roskam IL-06 Even 193 0.552 341 – 148
Tiberi OH-12 D+1 192 0.508 318 – 126
Garrett NJ-05 R+7 291 0.771 417 – 126
Kline MN-02 R+4 239 0.616 365 – 126
Royce CA-40 R+8 303 0.794 421 – 118
Lungren CA-03 R+6 261 0.641 377 – 116
Castle DE-AL D+7 133 0.291 245 – 112
Shadegg AZ-03 R+9 317 0.903 429 – 112
Biggert IL-13 R+1 210 0.512 321 – 111
Kirk IL-10 D+6 142 0.320 251.5 – 109.5
Petri WI-06 R+4 246 0.568 350.5 – 104.5
Sessions TX-32 R+8 302 0.727 403.5 – 101.5
Rogers MI-08 R+2 212 0.498 313.5 – 101.5
Pitts PA-16 R+8 304 0.728 405 – 101
Camp MI-04 R+3 236 0.538 335.5 – 99.5

And here are the underperforming Republicans…

Rep. District PVI PVI rank NJ Liberal rank Difference
W. Jones NC-03 R+16 397 0.279 242 155
Moran KS-01 R+23 424 0.442 286 138
Simpson ID-02 R+17 406 0.397 271 135
Emerson MO-08 R+15 385 0.329 257 128
Aderholt AL-04 R+26 430 0.476 303 127
Lucas OK-03 R+24 425 0.493 310 115
R. Hall TX-04 R+21 422 0.503 315 107
Whitfield KY-01 R+15 381 0.430 281 100
Bachus AL-06 R+29 435 0.538 335.5 99.5
Crenshaw FL-04 R+17 407 0.489 308 99

Why aren’t you using regression instead of discrete ranks? Good question. Last year, I used discrete ranks because that’s all I knew how to do. I’ve gotten a lot more familiar since then with some of the more advanced tools in Excel, so when I set out to re-do this project this year, my first attempts tried turning this into a regression exercise. The results, however, weren’t as satisfactory, so I went back to what I knew worked.

To illustrate this, take a look at the results graphed as a scatterplot (DW/Nominate data on the vertical axis, PVI on the horizontal axis).

DW-Nominate 2007-08

For the most part, you can see very clear correlations, as the two parties cluster tightly but also have nice slopes indicating the relationship between voting record and PVI. (And the gap between the two parties shows how even the worst Dem is still much better than the best GOPer.) However, notice that the tight cluster of Dems start to flatten out and then turn into more of a spray as you get into the districts with super-high PVIs.

The representatives in the highest-PVI districts aren’t especially more progressive than the ones in the lower but still solid-blue districts. A regression line, however, would predict that because of the great distance between say, the D+43 standing of NY-15 and NY-16 and the other districts, therefore the reps from these districts should also be much, much more progressive than anyone else. This is particularly a problem when using National Journal scores, which max out at 100; even if we somehow elected Angela Davis in those districts, she still would be underperforming because the “TREND” function on Excel says that to be a good fit, you have to bend the laws of mathematics and get a National Journal score of 105.

Just for the sake of comparison, here’s the Top 10 most underperforming Dems according to a true regression model (based on residuals, which are the differences between the projected voting records according to the trendline and actual voting records): Serrano, Rangel, Meeks, Towns, Meek, Fattah, Brady, Rush, Pelosi, and Clarke. As you can see, there are a number of commonalities between this list and the list above… but a perceptive reader will also notice that these are basically just the people in the districts with the top 10 highest PVIs, in approximately the right order (although Kendrick Meek is still somewhat out-of-whack). On the Republican side, the method also views Ron Paul as the most overperforming and potentially vulnerable Republican (although after that it settles down to the usual suspects: Franks, Rohrabacher, Ryan, etc.).

So, I discarded the method that just tells me that our juiciest primary targets are the representatives who are in our bluest districts. Switching back to discrete ranks comes with its own problems: while it flattens out the distortion at the margins, it may create some distortion in the middle, where it may place more importance than should be accorded on small DW/Nominate score differences among members who are clustered near the median of their caucuses. So, as always, I welcome any thoughts on the methodology here and how to make this the fairest-possible assessment of House members’ fits.

One other idea I’ve mulled over is the possibility of ranking representatives only against a cohort of the representatives in 5 or 10 most similar districts, similar not just in terms of presidential voting but other demographic characteristics. For example, let’s take a look at AL-07, of interest to us not just because it’s where the most out-of-whack Dem (Artur Davis) is, but because it’s a district that points to the flaws of using only PVI as an indicator of who’s a good fit, as it’s a good bit more socially conservative than most other districts in the D+18 range.

One would want to compare Davis to the representatives in MS-03 and SC-06, similar not just in terms of their PVI but also their racial composition. Beyond that, TN-09, NC-12, FL-03, and VA-03 are also similar in region, PVI, and race, though somewhat less similar, in terms of being less impoverished and more urban. If you average out the DW/N scores for Bennie Thompson, Jim Clyburn, Steve Cohen, Mel Watt, Corrine Brown, and Bobby Scott, you get – 0.462 (ranging from – 0.544 for Watt to – 0.403 for Clyburn), so Davis’s – 0.286 still points to a significant under-performance. Of course, I’d need to develop a statistical method for analyzing which districts truly are the most similar to each other using a similar technique as Nate Silver’s state similarity index (rather than simply saying “Hmm, these ones seem similar”), so while this method seems the most promising to me, it’ll still need a lot of work too.

UPDATE: See the entire dataset at Google Docs.

Cook Releases 2008 PVIs, With a Change SSPers Will Like

Our friends at the Cook Political Report have released an updated Partisan Voting Index that now includes the results of the 2008 presidential election. They’ve also made a small change in the formula used to calculate PVIs, and I think it’ll be instantly recognizable to SSPers:

To determine the national average for these latest ratings, we have taken the average Democratic share of the two-party presidential vote for 2004 and 2008, which is roughly 51.3 percent, and that of Republicans, which is roughly 48.7 percent. So, if John Kerry captured 55 percent of the vote in a district and Barack Obama carried 57 percent in the district four years later, the district would have a PVI score of roughly D+5. (Emphasis added.)

As we discussed at length, the old PVI formula compared district-level results for the past two presidential elections to nationwide results for only the most recent election. This choice sparked plenty of debate, and some folks even suggested we use our own “SVI” that would compare 2004 to 2004 and 2008 to 2008.

Fortunately, the debate has been resolved. As you can discern from the description above (the key part is in bold), Cook has decided to revise its methodology along the lines proposed by people here. Charlie Cook (an SSP reader, as is House editor David Wasserman) told me he wanted something that was “totally apples and apples,” and I agree with the choice. Ultimately, this means that the new PVIs will be about two points bluer than under the old system – e.g., a district that would have been R+10 will now come in at R+8.

You can find the new PVIs by partisan rank in this PDF, as well as by member name and by state/district. There’s also a giant-size map and a cool chart showing trends in the PVI over the last decade. (As you’d expect, the number of “competitive” districts, at least on the presidential level, has been shrinking.) Have fun!

New Swing State PVIs for All Congressional Districts

I previously posted new Cook PVIs for all congressional districts.  As many noted, the numbers seem screwy.  This is a function of the formula Cook uses to calculate PVI.

Currently, Cook uses this formula for calculating PVI:

Cook PVI = ((Gore’s 2000 two-party vote share in congressional district – Kerry’s 2004 two-party vote share nationally) + (Kerry’s 2004 two-party vote share in congressional district – Kerry’s 2004 two-party vote share nationally))/2.  Positive numbers are Democratic PVIs and negative numbers are Republican PVIs.

The entire problem with the Cook PVI is that it compares 2000 state results with 2004 national results.  The USA as a whole should have a PVI of 0.0.  But, by comparing 2000 state results with 2004 national results (apples to oranges) it screws things up and, in fact, the USA as a whole had a PVI of R+0.8 for 2005-2008.  Using this same formula to calculate new PVIs after 2008 elections results in the USA as a whole having a PVI of D+2.5.  This is totally screwy and defeats the purpose of the Cook PVI which is to show how much a congressional district is more democratic or republican than the nation as a whole.

The formula fix to correct this problem is simple:

PVI = (Kerry’s 2004 two-party vote share in particular congressional district – Kerry’s 2004 two-party vote share nationally) + (Obama’s 2008 two-party vote share in congressional district – Obama’s 2008 two-party vote share nationally)/2.  Positive numbers are Democratic PVIs and negative numbers are Republican PVIs.  Using this formula to calculate PVI, results in the USA as a whole having a PVI of 0.  So, the numbers for each congressional district truly show how much more Democratic or Republican leaning the district is versus the nation as a whole, unlike the current Cook PVI numbers.

Past discussion of the Cook PVI, problems with it, and how to fix it are here, here, and here.

Using this formula and based on Swing State’s Compilation of presidential results for all 435 Congressional Districts, I have calculated “Swing State” PVIs for each congressional district, for both before the 2008 Presidential Election and afterwards:

State     CD     Member     Party           Old SPVI           New SPVI           Change            
AK AL Young (R) R+ 14.9 R+ 13.1 D+ 1.8
AL 1 Bonner (R) R+ 12.4 R+ 14.0 R+ 1.6
AL 2 Bright (D) R+ 13.8 R+ 16.5 R+ 2.7
AL 3 Rogers (R) R+ 5.1 R+ 8.8 R+ 3.7
AL 4 Aderholt (R) R+ 16.5 R+ 25.5 R+ 9.0
AL 5 Griffith (D) R+ 7.4 R+ 12.3 R+ 5.0
AL 6 Bachus (R) R+ 25.9 R+ 28.6 R+ 2.7
AL 7 Davis (D) D+ 16.1 D+ 17.5 D+ 1.3
AR 1 Berry (D) R+ 0.3 R+ 7.9 R+ 7.6
AR 2 Snyder (D) R+ 0.5 R+ 4.5 R+ 4.0
AR 3 Boozman (R) R+ 12.1 R+ 15.5 R+ 3.4
AR 4 Ross (D) R+ 0.0 R+ 6.9 R+ 6.9
AZ 1 Kirkpatrick (D) R+ 2.8 R+ 5.8 R+ 3.0
AZ 2 Franks (R) R+ 9.4 R+ 12.8 R+ 3.4
AZ 3 Shadegg (R) R+ 6.9 R+ 9.3 R+ 2.4
AZ 4 Pastor (D) D+ 13.6 D+ 13.1 R+ 0.5
AZ 5 Mitchell (D) R+ 4.6 R+ 4.8 R+ 0.1
AZ 6 Flake (R) R+ 13.0 R+ 14.4 R+ 1.4
AZ 7 Grijalva (D) D+ 9.2 D+ 6.1 R+ 3.1
AZ 8 Giffords (D) R+ 2.3 R+ 4.5 R+ 2.2
CA 1 Thompson (D) D+ 9.7 D+ 13.1 D+ 3.4
CA 2 Herger (R) R+ 13.3 R+ 10.6 D+ 2.7
CA 3 Lungren (R) R+ 7.5 R+ 5.5 D+ 1.9
CA 4 McClintock (R) R+ 11.7 R+ 9.9 D+ 1.8
CA 5 Matsui (D) D+ 12.9 D+ 15.3 D+ 2.4
CA 6 Woolsey (D) D+ 19.9 D+ 23.3 D+ 3.4
CA 7 Miller (D) D+ 18.3 D+ 19.2 D+ 0.9
CA 8 Pelosi (D) D+ 35.3 D+ 35.5 D+ 0.3
CA 9 Lee (D) D+ 36.9 D+ 37.1 D+ 0.3
CA 10 Tauscher (D) D+ 8.9 D+ 11.7 D+ 2.8
CA 11 McNerney (D) R+ 3.8 R+ 1.2 D+ 2.6
CA 12 Speier (D) D+ 21.7 D+ 22.9 D+ 1.2
CA 13 Stark (D) D+ 20.9 D+ 22.4 D+ 1.5
CA 14 Eshoo (D) D+ 17.5 D+ 20.7 D+ 3.2
CA 15 Honda (D) D+ 13.6 D+ 15.3 D+ 1.7
CA 16 Lofgren (D) D+ 15.3 D+ 16.0 D+ 0.7
CA 17 Farr (D) D+ 16.1 D+ 18.8 D+ 2.8
CA 18 Cardoza (D) D+ 2.6 D+ 3.6 D+ 1.1
CA 19 Radanovich (R) R+ 10.2 R+ 8.6 D+ 1.7
CA 20 Costa (D) D+ 4.0 D+ 4.8 D+ 0.8
CA 21 Nunes (R) R+ 13.5 R+ 12.6 D+ 0.8
CA 22 McCarthy (R) R+ 16.8 R+ 16.2 D+ 0.7
CA 23 Capps (D) D+ 8.8 D+ 11.9 D+ 3.1
CA 24 Gallegly (R) R+ 5.6 R+ 3.7 D+ 1.9
CA 25 McKeon (R) R+ 7.9 R+ 5.5 D+ 2.4
CA 26 Dreier (R) R+ 4.6 R+ 3.0 D+ 1.6
CA 27 Sherman (D) D+ 11.8 D+ 12.6 D+ 0.7
CA 28 Berman (D) D+ 24.0 D+ 23.4 R+ 0.6
CA 29 Schiff (D) D+ 11.8 D+ 14.6 D+ 2.8
CA 30 Waxman (D) D+ 19.2 D+ 17.8 R+ 1.4
CA 31 Becerra (D) D+ 29.5 D+ 28.5 R+ 1.0
CA 32 (D) D+ 16.0 D+ 14.8 R+ 1.2
CA 33 Watson (D) D+ 35.2 D+ 34.6 R+ 0.6
CA 34 Roybal-Allard (D) D+ 22.1 D+ 21.9 R+ 0.2
CA 35 Waters (D) D+ 31.8 D+ 31.5 R+ 0.3
CA 36 Harman (D) D+ 10.0 D+ 11.2 D+ 1.3
CA 37 Richardson (D) D+ 26.6 D+ 26.6 R+ 0.1
CA 38 Napolitano (D) D+ 19.0 D+ 17.8 R+ 1.2
CA 39 Sanchez (D) D+ 11.9 D+ 12.3 D+ 0.3
CA 40 Royce (R) R+ 8.7 R+ 7.5 D+ 1.1
CA 41 Lewis (R) R+ 9.7 R+ 10.1 R+ 0.4
CA 42 Miller (R) R+ 10.9 R+ 9.6 D+ 1.4
CA 43 Baca (D) D+ 12.4 D+ 12.8 D+ 0.3
CA 44 Calvert (R) R+ 6.6 R+ 5.8 D+ 0.9
CA 45 Bono (R) R+ 3.8 R+ 3.2 D+ 0.6
CA 46 Rohrabacher (R) R+ 6.6 R+ 5.5 D+ 1.1
CA 47 Sanchez (D) D+ 3.8 D+ 4.1 D+ 0.3
CA 48 Campbell (R) R+ 8.7 R+ 5.8 D+ 2.9
CA 49 Issa (R) R+ 11.4 R+ 10.1 D+ 1.4
CA 50 Bilbray (R) R+ 5.1 R+ 3.0 D+ 2.1
CA 51 Filner (D) D+ 6.3 D+ 7.4 D+ 1.0
CA 52 Hunter (R) R+ 9.7 R+ 9.1 D+ 0.6
CA 53 Davis (D) D+ 11.5 D+ 14.3 D+ 2.8
CO 1 DeGette (D) D+ 17.3 D+ 20.9 D+ 3.6
CO 2 Udall (D) D+ 7.2 D+ 10.7 D+ 3.6
CO 3 Salazar (D) R+ 6.3 R+ 4.8 D+ 1.6
CO 4 Markey (D) R+ 9.1 R+ 5.8 D+ 3.4
CO 5 Lamborn (R) R+ 16.4 R+ 14.4 D+ 2.0
CO 6 Coffman (R) R+ 10.7 R+ 8.3 D+ 2.5
CO 7 Perlmutter (D) D+ 1.5 D+ 4.3 D+ 2.8
CT 1 Larson (D) D+ 13.4 D+ 12.4 R+ 1.0
CT 2 Courtney (D) D+ 6.8 D+ 6.1 R+ 0.6
CT 3 DeLauro (D) D+ 11.0 D+ 9.2 R+ 1.8
CT 4 Himes (D) D+ 4.6 D+ 5.3 D+ 0.7
CT 5 Murphy (D) D+ 2.9 D+ 2.4 R+ 0.5
DE AL Castle (R) D+ 5.6 D+ 6.9 D+ 1.3
FL 1 Miller (R) R+ 20.0 R+ 21.1 R+ 1.0
FL 2 Boyd (D) R+ 3.0 R+ 5.5 R+ 2.5
FL 3 Brown (D) D+ 15.5 D+ 18.1 D+ 2.7
FL 4 Crenshaw (R) R+ 17.0 R+ 16.5 D+ 0.5
FL 5 Brown-Waite (R) R+ 5.8 R+ 8.8 R+ 3.0
FL 6 Stearns (R) R+ 9.0 R+ 10.0 R+ 1.0
FL 7 Mica (R) R+ 5.0 R+ 6.5 R+ 1.5
FL 8 Grayson (D) R+ 4.0 R+ 2.2 D+ 1.8
FL 9 Bilirakis (R) R+ 5.0 R+ 6.0 R+ 1.0
FL 10 Young (R) D+ 0.5 R+ 0.7 R+ 1.2
FL 11 Castor (D) D+ 10.3 D+ 11.4 D+ 1.1
FL 12 Putnam (R) R+ 6.0 R+ 5.5 D+ 0.5
FL 13 Buchanan (R) R+ 4.7 R+ 5.5 R+ 0.7
FL 14 Mack (R) R+ 11.0 R+ 11.0 D+ 0.0
FL 15 Posey (R) R+ 5.0 R+ 5.5 R+ 0.5
FL 16 Rooney (R) R+ 3.0 R+ 4.5 R+ 1.5
FL 17 Meek (D) D+ 34.5 D+ 34.2 R+ 0.3
FL 18 Ros-Lehtinen (R) R+ 5.0 R+ 2.7 D+ 2.3
FL 19 Wexler (D) D+ 20.0 D+ 14.6 R+ 5.4
FL 20 Wasserman-Schultz (D) D+ 17.0 D+ 12.6 R+ 4.4
FL 21 Diaz-Balart (R) R+ 7.0 R+ 5.2 D+ 1.8
FL 22 Klein (D) D+ 2.5 D+ 0.8 R+ 1.7
FL 23 Hastings (D) D+ 28.5 D+ 28.3 R+ 0.2
FL 24 Kosmas (D) R+ 3.5 R+ 4.2 R+ 0.7
FL 25 Diaz-Balart (R) R+ 5.0 R+ 4.5 D+ 0.5
GA 1 Kingston (R) R+ 13.5 R+ 16.0 R+ 2.5
GA 2 Bishop (D) D+ 1.5 D+ 0.8 R+ 0.7
GA 3 Westmoreland (R) R+ 18.4 R+ 18.9 R+ 0.5
GA 4 Johnson (D) D+ 21.3 D+ 24.1 D+ 2.8
GA 5 Lewis (D) D+ 24.0 D+ 25.7 D+ 1.7
GA 6 Price (R) R+ 18.9 R+ 17.9 D+ 1.0
GA 7 Linder (R) R+ 19.0 R+ 16.5 D+ 2.5
GA 8 Marshall (D) R+ 9.0 R+ 10.0 R+ 1.0
GA 9 Deal (R) R+ 23.5 R+ 27.6 R+ 4.1
GA 10 Broun (R) R+ 13.5 R+ 14.5 R+ 1.0
GA 11 Gingrey (R) R+ 17.7 R+ 20.1 R+ 2.4
GA 12 Barrow (D) D+ 1.2 D+ 0.8 R+ 0.4
GA 13 Scott (D) D+ 9.0 D+ 14.6 D+ 5.7
HI 1 Abercrombie (D) D+ 6.2 D+ 11.0 D+ 4.8
HI 2 Hirono (D) D+ 8.9 D+ 14.0 D+ 5.1
IA 1 Braley (D) D+ 4.1 D+ 4.8 D+ 0.8
IA 2 Loebsack (D) D+ 5.9 D+ 7.2 D+ 1.3
IA 3 Boswell (D) D+ 0.7 D+ 1.3 D+ 0.6
IA 4 Latham (R) R+ 0.5 D+ 0.1 D+ 0.6
IA 5 King (R) R+ 9.2 R+ 9.1 D+ 0.1
ID 1 Minnick (D) R+ 19.8 R+ 17.7 D+ 2.1
ID 2 Simpson (R) R+ 19.6 R+ 17.5 D+ 2.1
IL 1 Rush (D) D+ 34.0 D+ 33.8 R+ 0.2
IL 2 Jackson (D) D+ 34.0 D+ 35.8 D+ 1.8
IL 3 Lipinski (D) D+ 9.6 D+ 10.6 D+ 1.0
IL 4 Gutierrez (D) D+ 29.9 D+ 31.6 D+ 1.8
IL 5 (D) D+ 17.0 D+ 19.1 D+ 2.2
IL 6 Roskam (R) R+ 3.3 D+ 0.6 D+ 3.9
IL 7 Davis (D) D+ 33.9 D+ 34.3 D+ 0.4
IL 8 Bean (D) R+ 6.1 R+ 0.9 D+ 5.1
IL 9 Schakowsky (D) D+ 18.7 D+ 19.5 D+ 0.8
IL 10 Kirk (R) D+ 3.0 D+ 6.1 D+ 3.1
IL 11 Halvorson (D) R+ 1.8 R+ 0.9 D+ 0.8
IL 12 Costello (D) D+ 4.3 D+ 2.3 R+ 2.0
IL 13 Biggert (R) R+ 5.4 R+ 1.4 D+ 3.9
IL 14 Foster (D) R+ 5.1 R+ 1.2 D+ 3.9
IL 15 Johnson (R) R+ 6.8 R+ 6.2 D+ 0.6
IL 16 Manzullo (R) R+ 5.1 R+ 2.0 D+ 3.2
IL 17 Hare (D) D+ 3.8 D+ 3.1 R+ 0.7
IL 18 Schock (R) R+ 6.1 R+ 5.7 D+ 0.3
IL 19 Shimkus (R) R+ 8.9 R+ 9.3 R+ 0.4
IN 1 Visclosky (D) D+ 6.8 D+ 7.9 D+ 1.0
IN 2 Donnelly (D) R+ 4.8 R+ 2.2 D+ 2.6
IN 3 Souder (R) R+ 17.2 R+ 13.8 D+ 3.3
IN 4 Buyer (R) R+ 18.0 R+ 14.4 D+ 3.7
IN 5 Burton (R) R+ 20.2 R+ 16.9 D+ 3.3
IN 6 Pence (R) R+ 11.6 R+ 10.3 D+ 1.3
IN 7 Carson (D) D+ 7.8 D+ 13.6 D+ 5.9
IN 8 Ellsworth (D) R+ 9.3 R+ 8.2 D+ 1.1
IN 9 Hill (D) R+ 7.9 R+ 6.3 D+ 1.6
KS 1 Moran (R) R+ 21.1 R+ 22.8 R+ 1.7
KS 2 Jenkins (R) R+ 8.0 R+ 9.4 R+ 1.3
KS 3 Moore (D) R+ 5.2 R+ 3.2 D+ 1.9
KS 4 Tiahrt (R) R+ 12.9 R+ 13.5 R+ 0.6
KY 1 Whitfield (R) R+ 10.9 R+ 14.4 R+ 3.4
KY 2 Guthrie (R) R+ 13.7 R+ 14.9 R+ 1.2
KY 3 Yarmuth (D) D+ 1.5 D+ 2.6 D+ 1.1
KY 4 Davis (R) R+ 12.5 R+ 13.6 R+ 1.2
KY 5 Rogers (R) R+ 8.8 R+ 15.9 R+ 7.1
KY 6 Chandler (D) R+ 7.4 R+ 8.6 R+ 1.2
LA 1 Scalise (R) R+ 19.6 R+ 23.9 R+ 4.4
LA 2 Cao (R) D+ 27.1 D+ 24.0 R+ 3.1
LA 3 Melancon (D) R+ 5.6 R+ 11.6 R+ 6.0
LA 4 Fleming (R) R+ 7.4 R+ 10.8 R+ 3.4
LA 5 Alexander (R) R+ 10.2 R+ 13.8 R+ 3.6
LA 6 Cassidy (R) R+ 7.4 R+ 10.1 R+ 2.7
LA 7 Boustany (R) R+ 8.2 R+ 13.7 R+ 5.5
MA 1 Olver (D) D+ 14.1 D+ 13.6 R+ 0.5
MA 2 Neal (D) D+ 11.5 D+ 8.7 R+ 2.8
MA 3 McGovern (D) D+ 11.7 D+ 8.7 R+ 3.0
MA 4 Frank (D) D+ 18.2 D+ 14.3 R+ 4.0
MA 5 Tsongas (D) D+ 10.2 D+ 8.0 R+ 2.3
MA 6 Tierney (D) D+ 10.4 D+ 7.4 R+ 3.1
MA 7 Markey (D) D+ 18.2 D+ 15.3 R+ 3.0
MA 8 Capuano (D) D+ 32.3 D+ 32.1 R+ 0.2
MA 9 Lynch (D) D+ 14.6 D+ 10.9 R+ 3.7
MA 10 Delahunt (D) D+ 7.8 D+ 4.8 R+ 3.0
MD 1 Kratovil (D) R+ 10.5 R+ 12.4 R+ 1.9
MD 2 Ruppersberger (D) D+ 6.8 D+ 6.7 R+ 0.2
MD 3 Sarbanes (D) D+ 6.4 D+ 6.2 R+ 0.3
MD 4 Edwards (D) D+ 29.2 D+ 31.1 D+ 1.9
MD 5 Hoyer (D) D+ 8.4 D+ 10.7 D+ 2.4
MD 6 Bartlett (R) R+ 13.8 R+ 13.6 D+ 0.1
MD 7 Cummings (D) D+ 24.6 D+ 25.5 D+ 0.9
MD 8 Van Hollen (D) D+ 19.4 D+ 21.0 D+ 1.6
ME 1 Pingree (D) D+ 5.4 D+ 7.7 D+ 2.2
ME 2 Michaud (D) D+ 2.8 D+ 3.4 D+ 0.5
MI 1 Stupak (D) R+ 3.1 R+ 2.5 D+ 0.6
MI 2 Hoekstra (R) R+ 10.2 R+ 7.3 D+ 2.9
MI 3 Ehlers (R) R+ 9.9 R+ 6.0 D+ 3.9
MI 4 Camp (R) R+ 4.8 R+ 3.5 D+ 1.4
MI 5 Kildee (D) D+ 11.1 D+ 10.6 R+ 0.5
MI 6 Upton (R) R+ 3.1 R+ 0.7 D+ 2.4
MI 7 Schauer (D) R+ 3.1 R+ 2.0 D+ 1.1
MI 8 Rogers (R) R+ 2.8 R+ 1.7 D+ 1.1
MI 9 Peters (D) R+ 1.0 D+ 1.6 D+ 2.6
MI 10 Miller (R) R+ 5.1 R+ 5.2 R+ 0.2
MI 11 McCotter (R) R+ 2.0 R+ 0.4 D+ 1.6
MI 12 Levin (D) D+ 12.1 D+ 12.4 D+ 0.3
MI 13 Kilpatrick (D) D+ 31.4 D+ 31.8 D+ 0.4
MI 14 Conyers (D) D+ 32.9 D+ 33.3 D+ 0.4
MI 15 Dingell (D) D+ 12.1 D+ 13.1 D+ 1.0
MN 1 Walz (D) R+ 1.6 R+ 1.2 D+ 0.4
MN 2 Kline (R) R+ 3.6 R+ 4.0 R+ 0.4
MN 3 Paulsen (R) R+ 1.3 R+ 0.4 D+ 0.9
MN 4 McCollum (D) D+ 12.1 D+ 12.7 D+ 0.6
MN 5 Ellison (D) D+ 20.6 D+ 22.4 D+ 1.8
MN 6 Bachmann (R) R+ 6.0 R+ 7.0 R+ 1.1
MN 7 Peterson (D) R+ 6.3 R+ 5.1 D+ 1.2
MN 8 Oberstar (D) D+ 3.6 D+ 2.6 R+ 1.0
MO 1 Clay (D) D+ 24.7 D+ 26.7 D+ 2.0
MO 2 Akin (R) R+ 9.6 R+ 9.0 D+ 0.6
MO 3 Carnahan (D) D+ 6.8 D+ 7.6 D+ 0.8
MO 4 Skelton (D) R+ 11.4 R+ 14.4 R+ 2.9
MO 5 Cleaver (D) D+ 11.2 D+ 10.9 R+ 0.3
MO 6 Graves (R) R+ 5.6 R+ 7.3 R+ 1.7
MO 7 Blunt (R) R+ 15.0 R+ 17.2 R+ 2.2
MO 8 Emerson (R) R+ 11.6 R+ 14.9 R+ 3.2
MO 9 Luetkemeyer (R) R+ 7.4 R+ 8.5 R+ 1.1
MS 1 Childers (D) R+ 10.6 R+ 13.5 R+ 2.9
MS 2 Thompson (D) D+ 9.4 D+ 11.6 D+ 2.2
MS 3 Harper (R) R+ 14.7 R+ 15.0 R+ 0.4
MS 4 Taylor (D) R+ 17.0 R+ 19.6 R+ 2.5
MT AL Rehberg (R) R+ 11.5 R+ 6.8 D+ 4.6
NC 1 Butterfield (D) D+ 8.1 D+ 8.9 D+ 0.8
NC 2 Etheridge (D) R+ 3.3 R+ 2.0 D+ 1.3
NC 3 Jones (R) R+ 15.8 R+ 16.0 R+ 0.2
NC 4 Price (D) D+ 5.0 D+ 8.4 D+ 3.3
NC 5 Foxx (R) R+ 16.2 R+ 15.4 D+ 0.8
NC 6 Coble (R) R+ 18.2 R+ 17.9 D+ 0.3
NC 7 McIntyre (D) R+ 3.5 R+ 5.5 R+ 2.0
NC 8 Kissell (D) R+ 3.8 R+ 2.0 D+ 1.8
NC 9 Myrick (R) R+ 13.1 R+ 10.5 D+ 2.6
NC 10 McHenry (R) R+ 15.8 R+ 16.5 R+ 0.7
NC 11 Shuler (D) R+ 7.6 R+ 6.0 D+ 1.6
NC 12 Watt (D) D+ 10.8 D+ 15.6 D+ 4.9
NC 13 Miller (D) D+ 1.5 D+ 4.8 D+ 3.3
ND AL Pomeroy (D) R+ 13.8 R+ 10.1 D+ 3.7
NE 1 Fortenberry (R) R+ 12.4 R+ 10.6 D+ 1.8
NE 2 Terry (R) R+ 9.8 R+ 6.6 D+ 3.2
NE 3 Smith (R) R+ 24.4 R+ 23.9 D+ 0.4
NH 1 Shea-Porter (D) R+ 1.1 R+ 0.5 D+ 0.6
NH 2 Hodes (D) D+ 2.0 D+ 3.3 D+ 1.3
NJ 1 Andrews (D) D+ 13.5 D+ 12.1 R+ 1.4
NJ 2 Lobiondo (R) D+ 3.1 D+ 0.8 R+ 2.3
NJ 3 Adler (D) D+ 2.8 R+ 0.5 R+ 3.3
NJ 4 Smith (R) R+ 1.5 R+ 5.5 R+ 4.0
NJ 5 Garrett (R) R+ 4.8 R+ 7.0 R+ 2.2
NJ 6 Pallone (D) D+ 10.8 D+ 7.6 R+ 3.2
NJ 7 Lance (R) R+ 1.3 R+ 2.0 R+ 0.7
NJ 8 Pascrell (D) D+ 10.9 D+ 10.1 R+ 0.8
NJ 9 Rothman (D) D+ 12.5 D+ 9.1 R+ 3.4
NJ 10 Payne (D) D+ 33.4 D+ 33.3 R+ 0.1
NJ 11 Frelinghuysen (R) R+ 6.3 R+ 7.5 R+ 1.1
NJ 12 Holt (D) D+ 6.7 D+ 5.1 R+ 1.6
NJ 13 Sires (D) D+ 22.1 D+ 21.2 R+ 0.9
NM 1 Heinrich (D) D+ 1.5 D+ 4.5 D+ 3.0
NM 2 Teague (D) R+ 6.6 R+ 5.8 D+ 0.9
NM 3 Lujan (D) D+ 5.1 D+ 6.9 D+ 1.7
NV 1 Berkley (D) D+ 8.1 D+ 10.2 D+ 2.1
NV 2 Heller (R) R+ 8.9 R+ 5.3 D+ 3.6
NV 3 Titus (D) D+ 0.5 D+ 1.6 D+ 1.1
NY 1 Bishop (D) D+ 2.6 R+ 0.2 R+ 2.8
NY 2 Israel (D) D+ 7.2 D+ 4.1 R+ 3.1
NY 3 King (R) D+ 1.3 R+ 3.7 R+ 5.1
NY 4 McCarthy (D) D+ 8.7 D+ 5.9 R+ 2.8
NY 5 Ackerman (D) D+ 16.8 D+ 12.4 R+ 4.4
NY 6 Meeks (D) D+ 37.3 D+ 35.7 R+ 1.6
NY 7 Crowley (D) D+ 26.9 D+ 26.1 R+ 0.9
NY 8 Nadler (D) D+ 27.1 D+ 22.1 R+ 4.9
NY 9 Weiner (D) D+ 13.0 D+ 4.6 R+ 8.5
NY 10 Towns (D) D+ 39.8 D+ 37.7 R+ 2.0
NY 11 Clarke (D) D+ 39.0 D+ 37.7 R+ 1.3
NY 12 Velazquez (D) D+ 32.7 D+ 32.6 R+ 0.1
NY 13 McMahon (D) D+ 0.1 R+ 4.2 R+ 4.3
NY 14 Maloney (D) D+ 25.5 D+ 25.5 D+ 0.1
NY 15 Rangel (D) D+ 42.2 D+ 41.2 R+ 1.0
NY 16 Serrano (D) D+ 42.9 D+ 41.2 R+ 1.6
NY 17 Engel (D) D+ 19.9 D+ 18.3 R+ 1.6
NY 18 Lowey (D) D+ 9.4 D+ 8.8 R+ 0.6
NY 19 Hall (D) R+ 2.3 R+ 2.7 R+ 0.4
NY 20 (D) R+ 3.4 R+ 2.5 D+ 0.9
NY 21 Tonko (D) D+ 8.0 D+ 6.4 R+ 1.6
NY 22 Hinchey (D) D+ 5.2 D+ 6.2 D+ 1.0
NY 23 McHugh (R) R+ 1.1 R+ 1.0 D+ 0.1
NY 24 Arcuri (D) R+ 1.3 R+ 2.0 R+ 0.7
NY 25 Maffei (D) D+ 2.6 D+ 2.6 D+ 0.0
NY 26 Lee (R) R+ 4.4 R+ 5.8 R+ 1.4
NY 27 Higgins (D) D+ 5.7 D+ 3.4 R+ 2.3
NY 28 Slaughter (D) D+ 13.9 D+ 15.4 D+ 1.6
NY 29 Massa (D) R+ 5.7 R+ 5.5 D+ 0.1
OH 1 Driehaus (D) R+ 1.3 D+ 1.1 D+ 2.4
OH 2 Schmidt (R) R+ 14.0 R+ 13.0 D+ 1.0
OH 3 Turner (R) R+ 3.3 R+ 4.2 R+ 0.9
OH 4 Jordan (R) R+ 14.3 R+ 14.7 R+ 0.4
OH 5 Latta (R) R+ 10.7 R+ 8.8 D+ 2.0
OH 6 Wilson (D) R+ 0.5 R+ 2.2 R+ 1.7
OH 7 Austria (R) R+ 6.6 R+ 7.0 R+ 0.4
OH 8 Boehner (R) R+ 13.3 R+ 14.2 R+ 0.9
OH 9 Kaptur (D) D+ 8.1 D+ 9.4 D+ 1.3
OH 10 Kucinich (D) D+ 7.7 D+ 8.2 D+ 0.5
OH 11 Fudge (D) D+ 32.1 D+ 32.6 D+ 0.5
OH 12 Tiberi (R) R+ 1.5 D+ 0.0 D+ 1.6
OH 13 Sutton (D) D+ 5.8 D+ 5.6 R+ 0.2
OH 14 LaTourette (R) R+ 3.1 R+ 2.7 D+ 0.4
OH 15 Kilroy (D) R+ 1.6 D+ 1.1 D+ 2.6
OH 16 Boccieri (D) R+ 4.4 R+ 3.7 D+ 0.7
OH 17 Ryan (D) D+ 13.6 D+ 11.9 R+ 1.7
OH 18 Space (D) R+ 6.7 R+ 6.5 D+ 0.1
OK 1 Sullivan (R) R+ 13.3 R+ 15.7 R+ 2.4
OK 2 Boren (D) R+ 5.3 R+ 13.7 R+ 8.4
OK 3 Lucas (R) R+ 18.3 R+ 23.7 R+ 5.4
OK 4 Cole (R) R+ 13.8 R+ 17.7 R+ 3.9
OK 5 Fallin (R) R+ 12.5 R+ 12.7 R+ 0.2
OR 1 Wu (D) D+ 4.9 D+ 8.0 D+ 3.1
OR 2 Walden (R) R+ 11.9 R+ 9.9 D+ 2.0
OR 3 Blumenauer (D) D+ 16.8 D+ 18.9 D+ 2.1
OR 4 Defazio (D) R+ 0.9 D+ 1.6 D+ 2.5
OR 5 Schrader (D) R+ 0.0 D+ 1.4 D+ 1.4
PA 1 Brady (D) D+ 35.3 D+ 35.2 R+ 0.1
PA 2 Fattah (D) D+ 38.4 D+ 37.7 R+ 0.6
PA 3 Dahlkemper (D) R+ 2.0 R+ 2.7 R+ 0.7
PA 4 Altmire (D) R+ 3.3 R+ 6.3 R+ 3.0
PA 5 Thompson (R) R+ 10.4 R+ 9.5 D+ 0.9
PA 6 Gerlach (R) D+ 1.5 D+ 4.1 D+ 2.6
PA 7 Sestak (D) D+ 3.0 D+ 3.6 D+ 0.6
PA 8 Murphy (D) D+ 2.5 D+ 1.8 R+ 0.7
PA 9 Shuster (R) R+ 15.7 R+ 16.9 R+ 1.2
PA 10 Carney (D) R+ 8.4 R+ 8.5 R+ 0.1
PA 11 Kanjorski (D) D+ 4.8 D+ 4.1 R+ 0.8
PA 12 Murtha (D) D+ 3.8 R+ 1.0 R+ 4.7
PA 13 Schwartz (D) D+ 7.3 D+ 6.6 R+ 0.8
PA 14 Doyle (D) D+ 21.1 D+ 19.0 R+ 2.1
PA 15 Dent (R) D+ 0.7 D+ 2.1 D+ 1.3
PA 16 Pitts (R) R+ 12.0 R+ 7.8 D+ 4.2
PA 17 Holden (D) R+ 7.4 R+ 6.0 D+ 1.4
PA 18 Murphy (R) R+ 2.8 R+ 6.0 R+ 3.2
PA 19 Platts (R) R+ 13.0 R+ 11.5 D+ 1.5
RI 1 Kennedy (D) D+ 15.6 D+ 13.6 R+ 2.1
RI 2 Langevin (D) D+ 11.8 D+ 9.0 R+ 2.8
SC 1 Brown (R) R+ 10.4 R+ 10.5 R+ 0.1
SC 2 Wilson (R) R+ 9.7 R+ 8.8 D+ 0.9
SC 3 Barrett (R) R+ 14.7 R+ 16.5 R+ 1.9
SC 4 Inglis (R) R+ 15.3 R+ 14.7 D+ 0.7
SC 5 Spratt (D) R+ 6.4 R+ 6.8 R+ 0.4
SC 6 Clyburn (D) D+ 10.6 D+ 11.6 D+ 1.0
SD AL Herseth (D) R+ 10.7 R+ 8.9 D+ 1.9
TN 1 Roe (R) R+ 14.7 R+ 20.9 R+ 6.3
TN 2 Duncan (R) R+ 11.9 R+ 16.2 R+ 4.3
TN 3 Wamp (R) R+ 9.4 R+ 13.3 R+ 3.9
TN 4 Davis (D) R+ 4.1 R+ 13.2 R+ 9.1
TN 5 Cooper (D) D+ 5.3 D+ 3.1 R+ 2.2
TN 6 Gordon (D) R+ 4.5 R+ 12.5 R+ 8.0
TN 7 Blackburn (R) R+ 12.6 R+ 17.4 R+ 4.7
TN 8 Tanner (D) R+ 0.3 R+ 6.0 R+ 5.7
TN 9 Cohen (D) D+ 17.3 D+ 22.7 D+ 5.4
TX 1 Gohmert (R) R+ 17.7 R+ 20.2 R+ 2.5
TX 2 Poe (R) R+ 12.5 R+ 12.7 R+ 0.2
TX 3 Johnson (R) R+ 18.0 R+ 13.5 D+ 4.5
TX 4 Hall (R) R+ 17.5 R+ 21.1 R+ 3.6
TX 5 Hensarling (R) R+ 16.0 R+ 16.5 R+ 0.5
TX 6 Barton (R) R+ 15.5 R+ 14.2 D+ 1.3
TX 7 Culberson (R) R+ 16.0 R+ 12.5 D+ 3.5
TX 8 Brady (R) R+ 20.0 R+ 24.2 R+ 4.2
TX 9 Green (D) D+ 20.0 D+ 22.3 D+ 2.3
TX 10 McCaul (R) R+ 13.7 R+ 10.0 D+ 3.7
TX 11 Conaway (R) R+ 26.0 R+ 28.2 R+ 2.2
TX 12 Granger (R) R+ 15.0 R+ 16.5 R+ 1.5
TX 13 Thornberry (R) R+ 25.5 R+ 28.7 R+ 3.2
TX 14 Paul (R) R+ 15.0 R+ 18.1 R+ 3.0
TX 15 Hinojosa (D) D+ 2.0 D+ 3.3 D+ 1.3
TX 16 Reyes (D) D+ 8.2 D+ 10.0 D+ 1.8
TX 17 Edwards (D) R+ 18.5 R+ 20.1 R+ 1.5
TX 18 Jackson-Lee (D) D+ 22.5 D+ 23.7 D+ 1.2
TX 19 Neugebauer (R) R+ 25.5 R+ 26.1 R+ 0.6
TX 20 Gonzalez (D) D+ 7.0 D+ 8.1 D+ 1.1
TX 21 Smith (R) R+ 17.0 R+ 13.5 D+ 3.5
TX 22 Olson (R) R+ 15.0 R+ 12.5 D+ 2.5
TX 23 Rodriguez (D) R+ 4.7 R+ 4.0 D+ 0.8
TX 24 Marchant (R) R+ 16.0 R+ 11.5 D+ 4.5
TX 25 Doggett (D) D+ 1.0 D+ 5.6 D+ 4.6
TX 26 Burgess (R) R+ 13.0 R+ 13.0 R+ 0.0
TX 27 Ortiz (D) R+ 2.0 R+ 2.0 D+ 0.1
TX 28 Cuellar (D) R+ 1.5 R+ 0.2 D+ 1.3
TX 29 Green (D) D+ 7.0 D+ 7.8 D+ 0.8
TX 30 Johnson (D) D+ 25.0 D+ 27.3 D+ 2.3
TX 31 Carter (R) R+ 17.2 R+ 13.7 D+ 3.5
TX 32 Sessions (R) R+ 11.5 R+ 8.0 D+ 3.5
UT 1 Bishop (R) R+ 22.5 R+ 21.5 D+ 1.1
UT 2 Matheson (D) R+ 17.7 R+ 14.9 D+ 2.8
UT 3 Chaffetz (R) R+ 27.1 R+ 25.8 D+ 1.3
VA 1 Wittman (R) R+ 9.7 R+ 7.3 D+ 2.4
VA 2 Nye (D) R+ 6.6 R+ 4.7 D+ 1.9
VA 3 Scott (D) D+ 17.5 D+ 20.1 D+ 2.6
VA 4 Forbes (R) R+ 5.6 R+ 4.5 D+ 1.1
VA 5 Perriello (D) R+ 6.4 R+ 5.3 D+ 1.2
VA 6 Goodlatte (R) R+ 12.3 R+ 11.8 D+ 0.4
VA 7 Cantor (R) R+ 11.4 R+ 8.8 D+ 2.6
VA 8 Moran (D) D+ 12.8 D+ 16.0 D+ 3.1
VA 9 Boucher (D) R+ 8.2 R+ 11.3 R+ 3.2
VA 10 Wolf (R) R+ 6.2 R+ 2.2 D+ 3.9
VA 11 Connolly (D) R+ 1.6 D+ 2.3 D+ 3.9
VT AL Welch (D) D+ 8.3 D+ 13.2 D+ 4.9
WA 1 Inslee (D) D+ 7.0 D+ 9.0 D+ 2.0
WA 2 Larsen (D) D+ 2.0 D+ 3.4 D+ 1.3
WA 3 Baird (D) R+ 0.6 R+ 0.2 D+ 0.4
WA 4 Hastings (R) R+ 13.9 R+ 13.0 D+ 1.0
WA 5 McMorris (R) R+ 7.8 R+ 6.8 D+ 0.9
WA 6 Dicks (D) D+ 4.9 D+ 4.9 D+ 0.0
WA 7 McDermott (D) D+ 29.5 D+ 31.5 D+ 2.0
WA 8 Reichert (R) D+ 1.8 D+ 3.3 D+ 1.6
WA 9 Smith (D) D+ 4.9 D+ 5.3 D+ 0.5
WI 1 Ryan (R) R+ 3.1 R+ 2.5 D+ 0.6
WI 2 Baldwin (D) D+ 12.7 D+ 14.9 D+ 2.3
WI 3 Kind (D) D+ 2.0 D+ 3.8 D+ 1.8
WI 4 Moore (D) D+ 19.9 D+ 21.7 D+ 1.8
WI 5 Sensenbrenner (R) R+ 13.3 R+ 12.3 D+ 1.0
WI 6 Petri (R) R+ 5.7 R+ 4.2 D+ 1.4
WI 7 Obey (D) D+ 1.0 D+ 2.3 D+ 1.3
WI 8 Kagen (D) R+ 4.7 R+ 1.7 D+ 2.9
WV 1 Mollohan (D) R+ 6.3 R+ 9.0 R+ 2.7
WV 2 Capito (R) R+ 5.9 R+ 7.8 R+ 1.9
WV 3 Rahall (D) R+ 0.3 R+ 6.6 R+ 6.3
WY AL Lummis (R) R+ 20.3 R+ 19.6 D+ 0.7

New Cook PVIs for All Congressional Districts

Based on Swing State’s Compilation of presidential results for all 435 Congressional Districts, I have calculated the new Cook PVIs for each congressional district:

State   CD       Member Party           Old PVI         New PVI             Change    
AK AL Young (R) R+ 14.1 R+ 15.5 R+ 1.4
AL 1 Bonner (R) R+ 11.7 R+ 16.5 R+ 4.8
AL 2 Bright (D) R+ 13.1 R+ 19.0 R+ 5.9
AL 3 Rogers (R) R+ 4.3 R+ 11.3 R+ 6.9
AL 4 Aderholt (R) R+ 15.7 R+ 27.9 R+ 12.2
AL 5 Griffith (D) R+ 6.6 R+ 14.8 R+ 8.2
AL 6 Bachus (R) R+ 25.1 R+ 31.1 R+ 5.9
AL 7 Davis (D) D+ 16.9 D+ 15.0 R+ 1.9
AR 1 Berry (D) D+ 0.5 R+ 10.4 R+ 10.8
AR 2 Snyder (D) D+ 0.2 R+ 7.0 R+ 7.2
AR 3 Boozman (R) R+ 11.3 R+ 18.0 R+ 6.6
AR 4 Ross (D) D+ 0.7 R+ 9.3 R+ 10.1
AZ 1 Kirkpatrick (D) R+ 2.0 R+ 8.2 R+ 6.2
AZ 2 Franks (R) R+ 8.6 R+ 15.3 R+ 6.6
AZ 3 Shadegg (R) R+ 6.1 R+ 11.8 R+ 5.6
AZ 4 Pastor (D) D+ 14.4 D+ 10.7 R+ 3.7
AZ 5 Mitchell (D) R+ 3.9 R+ 7.2 R+ 3.4
AZ 6 Flake (R) R+ 12.2 R+ 16.8 R+ 4.6
AZ 7 Grijalva (D) D+ 10.0 D+ 3.6 R+ 6.3
AZ 8 Giffords (D) R+ 1.6 R+ 7.0 R+ 5.4
CA 1 Thompson (D) D+ 10.4 D+ 10.6 D+ 0.2
CA 2 Herger (R) R+ 12.5 R+ 13.1 R+ 0.5
CA 3 Lungren (R) R+ 6.7 R+ 8.0 R+ 1.3
CA 4 McClintock (R) R+ 10.9 R+ 12.4 R+ 1.4
CA 5 Matsui (D) D+ 13.6 D+ 12.8 R+ 0.8
CA 6 Woolsey (D) D+ 20.7 D+ 20.8 D+ 0.2
CA 7 Miller (D) D+ 19.1 D+ 16.8 R+ 2.3
CA 8 Pelosi (D) D+ 36.0 D+ 33.1 R+ 3.0
CA 9 Lee (D) D+ 37.6 D+ 34.7 R+ 3.0
CA 10 Tauscher (D) D+ 9.7 D+ 9.3 R+ 0.4
CA 11 McNerney (D) R+ 3.1 R+ 3.7 R+ 0.6
CA 12 Speier (D) D+ 22.5 D+ 20.4 R+ 2.1
CA 13 Stark (D) D+ 21.6 D+ 19.9 R+ 1.7
CA 14 Eshoo (D) D+ 18.2 D+ 18.3 D+ 0.0
CA 15 Honda (D) D+ 14.3 D+ 12.8 R+ 1.5
CA 16 Lofgren (D) D+ 16.1 D+ 13.5 R+ 2.6
CA 17 Farr (D) D+ 16.8 D+ 16.4 R+ 0.4
CA 18 Cardoza (D) D+ 3.3 D+ 1.2 R+ 2.1
CA 19 Radanovich (R) R+ 9.5 R+ 11.0 R+ 1.6
CA 20 Costa (D) D+ 4.8 D+ 2.4 R+ 2.4
CA 21 Nunes (R) R+ 12.7 R+ 15.1 R+ 2.4
CA 22 McCarthy (R) R+ 16.1 R+ 18.6 R+ 2.5
CA 23 Capps (D) D+ 9.6 D+ 9.4 R+ 0.1
CA 24 Gallegly (R) R+ 4.9 R+ 6.2 R+ 1.3
CA 25 McKeon (R) R+ 7.1 R+ 8.0 R+ 0.8
CA 26 Dreier (R) R+ 3.9 R+ 5.4 R+ 1.6
CA 27 Sherman (D) D+ 12.6 D+ 10.1 R+ 2.5
CA 28 Berman (D) D+ 24.7 D+ 21.0 R+ 3.8
CA 29 Schiff (D) D+ 12.6 D+ 12.1 R+ 0.4
CA 30 Waxman (D) D+ 20.0 D+ 15.4 R+ 4.6
CA 31 Becerra (D) D+ 30.2 D+ 26.0 R+ 4.2
CA 32 (D) D+ 16.7 D+ 12.3 R+ 4.4
CA 33 Watson (D) D+ 35.9 D+ 32.2 R+ 3.8
CA 34 Roybal-Allard (D) D+ 22.8 D+ 19.4 R+ 3.4
CA 35 Waters (D) D+ 32.6 D+ 29.1 R+ 3.5
CA 36 Harman (D) D+ 10.7 D+ 8.8 R+ 2.0
CA 37 Richardson (D) D+ 27.4 D+ 24.1 R+ 3.3
CA 38 Napolitano (D) D+ 19.8 D+ 15.4 R+ 4.4
CA 39 Sanchez (D) D+ 12.7 D+ 9.8 R+ 2.9
CA 40 Royce (R) R+ 7.9 R+ 10.0 R+ 2.1
CA 41 Lewis (R) R+ 8.9 R+ 12.5 R+ 3.6
CA 42 Miller (R) R+ 10.2 R+ 12.0 R+ 1.9
CA 43 Baca (D) D+ 13.2 D+ 10.3 R+ 2.9
CA 44 Calvert (R) R+ 5.9 R+ 8.2 R+ 2.4
CA 45 Bono (R) R+ 3.1 R+ 5.7 R+ 2.6
CA 46 Rohrabacher (R) R+ 5.9 R+ 8.0 R+ 2.1
CA 47 Sanchez (D) D+ 4.6 D+ 1.7 R+ 2.9
CA 48 Campbell (R) R+ 7.9 R+ 8.3 R+ 0.3
CA 49 Issa (R) R+ 10.7 R+ 12.5 R+ 1.9
CA 50 Bilbray (R) R+ 4.4 R+ 5.4 R+ 1.1
CA 51 Filner (D) D+ 7.1 D+ 4.9 R+ 2.2
CA 52 Hunter (R) R+ 8.9 R+ 11.5 R+ 2.6
CA 53 Davis (D) D+ 12.3 D+ 11.8 R+ 0.4
CO 1 DeGette (D) D+ 18.0 D+ 18.4 D+ 0.4
CO 2 Udall (D) D+ 7.9 D+ 8.3 D+ 0.4
CO 3 Salazar (D) R+ 5.6 R+ 7.2 R+ 1.7
CO 4 Markey (D) R+ 8.4 R+ 8.2 D+ 0.1
CO 5 Lamborn (R) R+ 15.6 R+ 16.8 R+ 1.2
CO 6 Coffman (R) R+ 10.0 R+ 10.8 R+ 0.8
CO 7 Perlmutter (D) D+ 2.3 D+ 1.9 R+ 0.4
CT 1 Larson (D) D+ 14.2 D+ 10.0 R+ 4.2
CT 2 Courtney (D) D+ 7.5 D+ 3.7 R+ 3.8
CT 3 DeLauro (D) D+ 11.7 D+ 6.7 R+ 5.0
CT 4 Himes (D) D+ 5.4 D+ 2.9 R+ 2.5
CT 5 Murphy (D) D+ 3.6 R+ 0.1 R+ 3.7
DE AL Castle (R) D+ 6.4 D+ 4.4 R+ 2.0
FL 1 Miller (R) R+ 19.3 R+ 23.5 R+ 4.3
FL 2 Boyd (D) R+ 2.3 R+ 8.0 R+ 5.7
FL 3 Brown (D) D+ 16.2 D+ 15.7 R+ 0.6
FL 4 Crenshaw (R) R+ 16.3 R+ 19.0 R+ 2.7
FL 5 Brown-Waite (R) R+ 5.1 R+ 11.3 R+ 6.2
FL 6 Stearns (R) R+ 8.3 R+ 12.5 R+ 4.2
FL 7 Mica (R) R+ 4.3 R+ 8.9 R+ 4.7
FL 8 Grayson (D) R+ 3.3 R+ 4.7 R+ 1.4
FL 9 Bilirakis (R) R+ 4.3 R+ 8.4 R+ 4.2
FL 10 Young (R) D+ 1.2 R+ 3.2 R+ 4.4
FL 11 Castor (D) D+ 11.0 D+ 8.9 R+ 2.1
FL 12 Putnam (R) R+ 5.3 R+ 7.9 R+ 2.7
FL 13 Buchanan (R) R+ 4.0 R+ 7.9 R+ 4.0
FL 14 Mack (R) R+ 10.3 R+ 13.5 R+ 3.2
FL 15 Posey (R) R+ 4.3 R+ 7.9 R+ 3.7
FL 16 Rooney (R) R+ 2.3 R+ 6.9 R+ 4.7
FL 17 Meek (D) D+ 35.2 D+ 31.8 R+ 3.5
FL 18 Ros-Lehtinen (R) R+ 4.3 R+ 5.2 R+ 0.9
FL 19 Wexler (D) D+ 20.7 D+ 12.1 R+ 8.6
FL 20 Wasserman-Schultz (D) D+ 17.7 D+ 10.1 R+ 7.6
FL 21 Diaz-Balart (R) R+ 6.3 R+ 7.7 R+ 1.4
FL 22 Klein (D) D+ 3.2 R+ 1.7 R+ 4.9
FL 23 Hastings (D) D+ 29.2 D+ 25.8 R+ 3.4
FL 24 Kosmas (D) R+ 2.8 R+ 6.7 R+ 3.9
FL 25 Diaz-Balart (R) R+ 4.3 R+ 6.9 R+ 2.7
GA 1 Kingston (R) R+ 12.8 R+ 18.5 R+ 5.7
GA 2 Bishop (D) D+ 2.2 R+ 1.7 R+ 3.9
GA 3 Westmoreland (R) R+ 17.6 R+ 21.4 R+ 3.7
GA 4 Johnson (D) D+ 22.1 D+ 21.7 R+ 0.4
GA 5 Lewis (D) D+ 24.7 D+ 23.2 R+ 1.5
GA 6 Price (R) R+ 18.1 R+ 20.3 R+ 2.2
GA 7 Linder (R) R+ 18.3 R+ 19.0 R+ 0.7
GA 8 Marshall (D) R+ 8.3 R+ 12.5 R+ 4.2
GA 9 Deal (R) R+ 22.8 R+ 30.1 R+ 7.3
GA 10 Broun (R) R+ 12.8 R+ 17.0 R+ 4.2
GA 11 Gingrey (R) R+ 16.9 R+ 22.5 R+ 5.6
GA 12 Barrow (D) D+ 2.0 R+ 1.7 R+ 3.7
GA 13 Scott (D) D+ 9.7 D+ 12.2 D+ 2.4
HI 1 Abercrombie (D) D+ 7.0 D+ 8.5 D+ 1.5
HI 2 Hirono (D) D+ 9.7 D+ 11.6 D+ 1.9
IA 1 Braley (D) D+ 4.8 D+ 2.4 R+ 2.4
IA 2 Loebsack (D) D+ 6.6 D+ 4.7 R+ 1.9
IA 3 Boswell (D) D+ 1.5 R+ 1.1 R+ 2.6
IA 4 Latham (R) D+ 0.2 R+ 2.4 R+ 2.6
IA 5 King (R) R+ 8.4 R+ 11.5 R+ 3.1
ID 1 Minnick (D) R+ 19.0 R+ 20.2 R+ 1.1
ID 2 Simpson (R) R+ 18.9 R+ 20.0 R+ 1.1
IL 1 Rush (D) D+ 34.7 D+ 31.3 R+ 3.4
IL 2 Jackson (D) D+ 34.7 D+ 33.3 R+ 1.4
IL 3 Lipinski (D) D+ 10.3 D+ 8.1 R+ 2.2
IL 4 Gutierrez (D) D+ 30.6 D+ 29.2 R+ 1.5
IL 5 (D) D+ 17.7 D+ 16.7 R+ 1.1
IL 6 Roskam (R) R+ 2.6 R+ 1.9 D+ 0.7
IL 7 Davis (D) D+ 34.7 D+ 31.8 R+ 2.8
IL 8 Bean (D) R+ 5.3 R+ 3.4 D+ 1.9
IL 9 Schakowsky (D) D+ 19.4 D+ 17.1 R+ 2.4
IL 10 Kirk (R) D+ 3.8 D+ 3.6 R+ 0.1
IL 11 Halvorson (D) R+ 1.0 R+ 3.4 R+ 2.4
IL 12 Costello (D) D+ 5.1 R+ 0.1 R+ 5.2
IL 13 Biggert (R) R+ 4.6 R+ 3.9 D+ 0.7
IL 14 Foster (D) R+ 4.4 R+ 3.7 D+ 0.7
IL 15 Johnson (R) R+ 6.1 R+ 8.7 R+ 2.6
IL 16 Manzullo (R) R+ 4.4 R+ 4.4 R+ 0.0
IL 17 Hare (D) D+ 4.6 D+ 0.6 R+ 3.9
IL 18 Schock (R) R+ 5.3 R+ 8.2 R+ 2.9
IL 19 Shimkus (R) R+ 8.1 R+ 11.7 R+ 3.6
IN 1 Visclosky (D) D+ 7.6 D+ 5.4 R+ 2.2
IN 2 Donnelly (D) R+ 4.1 R+ 4.7 R+ 0.6
IN 3 Souder (R) R+ 16.4 R+ 16.3 D+ 0.1
IN 4 Buyer (R) R+ 17.3 R+ 16.8 D+ 0.5
IN 5 Burton (R) R+ 19.5 R+ 19.3 D+ 0.1
IN 6 Pence (R) R+ 10.9 R+ 12.8 R+ 1.9
IN 7 Carson (D) D+ 8.5 D+ 11.2 D+ 2.7
IN 8 Ellsworth (D) R+ 8.5 R+ 10.7 R+ 2.2
IN 9 Hill (D) R+ 7.1 R+ 8.7 R+ 1.6
KS 1 Moran (R) R+ 20.4 R+ 25.3 R+ 4.9
KS 2 Jenkins (R) R+ 7.3 R+ 11.8 R+ 4.6
KS 3 Moore (D) R+ 4.4 R+ 5.7 R+ 1.3
KS 4 Tiahrt (R) R+ 12.1 R+ 15.9 R+ 3.8
KY 1 Whitfield (R) R+ 10.2 R+ 16.8 R+ 6.6
KY 2 Guthrie (R) R+ 12.9 R+ 17.3 R+ 4.4
KY 3 Yarmuth (D) D+ 2.3 D+ 0.1 R+ 2.2
KY 4 Davis (R) R+ 11.7 R+ 16.1 R+ 4.4
KY 5 Rogers (R) R+ 8.0 R+ 18.4 R+ 10.3
KY 6 Chandler (D) R+ 6.6 R+ 11.0 R+ 4.4
LA 1 Scalise (R) R+ 18.8 R+ 26.4 R+ 7.6
LA 2 Cao (R) D+ 27.9 D+ 21.6 R+ 6.3
LA 3 Melancon (D) R+ 4.9 R+ 14.1 R+ 9.2
LA 4 Fleming (R) R+ 6.6 R+ 13.3 R+ 6.7
LA 5 Alexander (R) R+ 9.5 R+ 16.3 R+ 6.9
LA 6 Cassidy (R) R+ 6.6 R+ 12.6 R+ 5.9
LA 7 Boustany (R) R+ 7.4 R+ 16.1 R+ 8.7
MA 1 Olver (D) D+ 14.8 D+ 11.1 R+ 3.7
MA 2 Neal (D) D+ 12.2 D+ 6.2 R+ 6.0
MA 3 McGovern (D) D+ 12.4 D+ 6.2 R+ 6.2
MA 4 Frank (D) D+ 19.0 D+ 11.8 R+ 7.2
MA 5 Tsongas (D) D+ 11.0 D+ 5.5 R+ 5.5
MA 6 Tierney (D) D+ 11.2 D+ 4.9 R+ 6.3
MA 7 Markey (D) D+ 19.0 D+ 12.8 R+ 6.2
MA 8 Capuano (D) D+ 33.0 D+ 29.6 R+ 3.4
MA 9 Lynch (D) D+ 15.3 D+ 8.4 R+ 6.9
MA 10 Delahunt (D) D+ 8.6 D+ 2.4 R+ 6.2
MD 1 Kratovil (D) R+ 9.8 R+ 14.9 R+ 5.1
MD 2 Ruppersberger (D) D+ 7.6 D+ 4.2 R+ 3.4
MD 3 Sarbanes (D) D+ 7.2 D+ 3.7 R+ 3.5
MD 4 Edwards (D) D+ 29.9 D+ 28.6 R+ 1.3
MD 5 Hoyer (D) D+ 9.1 D+ 8.3 R+ 0.8
MD 6 Bartlett (R) R+ 13.0 R+ 16.1 R+ 3.1
MD 7 Cummings (D) D+ 25.4 D+ 23.1 R+ 2.3
MD 8 Van Hollen (D) D+ 20.1 D+ 18.5 R+ 1.6
ME 1 Pingree (D) D+ 6.2 D+ 5.2 R+ 1.0
ME 2 Michaud (D) D+ 3.6 D+ 0.9 R+ 2.7
MI 1 Stupak (D) R+ 2.3 R+ 4.9 R+ 2.6
MI 2 Hoekstra (R) R+ 9.5 R+ 9.7 R+ 0.3
MI 3 Ehlers (R) R+ 9.2 R+ 8.5 D+ 0.7
MI 4 Camp (R) R+ 4.1 R+ 5.9 R+ 1.9
MI 5 Kildee (D) D+ 11.9 D+ 8.1 R+ 3.7
MI 6 Upton (R) R+ 2.3 R+ 3.2 R+ 0.8
MI 7 Schauer (D) R+ 2.3 R+ 4.4 R+ 2.1
MI 8 Rogers (R) R+ 2.1 R+ 4.2 R+ 2.1
MI 9 Peters (D) R+ 0.3 R+ 0.9 R+ 0.6
MI 10 Miller (R) R+ 4.3 R+ 7.7 R+ 3.4
MI 11 McCotter (R) R+ 1.3 R+ 2.9 R+ 1.6
MI 12 Levin (D) D+ 12.9 D+ 10.0 R+ 2.9
MI 13 Kilpatrick (D) D+ 32.1 D+ 29.3 R+ 2.8
MI 14 Conyers (D) D+ 33.7 D+ 30.8 R+ 2.8
MI 15 Dingell (D) D+ 12.9 D+ 10.7 R+ 2.2
MN 1 Walz (D) R+ 0.8 R+ 3.7 R+ 2.8
MN 2 Kline (R) R+ 2.9 R+ 6.5 R+ 3.6
MN 3 Paulsen (R) R+ 0.6 R+ 2.9 R+ 2.4
MN 4 McCollum (D) D+ 12.9 D+ 10.3 R+ 2.6
MN 5 Ellison (D) D+ 21.3 D+ 19.9 R+ 1.4
MN 6 Bachmann (R) R+ 5.2 R+ 9.5 R+ 4.3
MN 7 Peterson (D) R+ 5.5 R+ 7.5 R+ 2.0
MN 8 Oberstar (D) D+ 4.4 D+ 0.1 R+ 4.2
MO 1 Clay (D) D+ 25.5 D+ 24.2 R+ 1.3
MO 2 Akin (R) R+ 8.9 R+ 11.5 R+ 2.6
MO 3 Carnahan (D) D+ 7.6 D+ 5.1 R+ 2.5
MO 4 Skelton (D) R+ 10.7 R+ 16.8 R+ 6.1
MO 5 Cleaver (D) D+ 12.0 D+ 8.4 R+ 3.5
MO 6 Graves (R) R+ 4.9 R+ 9.7 R+ 4.9
MO 7 Blunt (R) R+ 14.2 R+ 19.7 R+ 5.4
MO 8 Emerson (R) R+ 10.9 R+ 17.3 R+ 6.5
MO 9 Luetkemeyer (R) R+ 6.6 R+ 11.0 R+ 4.4
MS 1 Childers (D) R+ 9.9 R+ 16.0 R+ 6.1
MS 2 Thompson (D) D+ 10.1 D+ 9.1 R+ 1.0
MS 3 Harper (R) R+ 13.9 R+ 17.5 R+ 3.6
MS 4 Taylor (D) R+ 16.3 R+ 22.0 R+ 5.8
MT AL Rehberg (R) R+ 10.7 R+ 9.3 D+ 1.4
NC 1 Butterfield (D) D+ 8.8 D+ 6.4 R+ 2.4
NC 2 Etheridge (D) R+ 2.5 R+ 4.4 R+ 1.9
NC 3 Jones (R) R+ 15.1 R+ 18.5 R+ 3.4
NC 4 Price (D) D+ 5.8 D+ 5.9 D+ 0.1
NC 5 Foxx (R) R+ 15.4 R+ 17.8 R+ 2.4
NC 6 Coble (R) R+ 17.4 R+ 20.3 R+ 2.9
NC 7 McIntyre (D) R+ 2.8 R+ 7.9 R+ 5.2
NC 8 Kissell (D) R+ 3.0 R+ 4.5 R+ 1.4
NC 9 Myrick (R) R+ 12.4 R+ 13.0 R+ 0.6
NC 10 McHenry (R) R+ 15.1 R+ 19.0 R+ 3.9
NC 11 Shuler (D) R+ 6.8 R+ 8.4 R+ 1.6
NC 12 Watt (D) D+ 11.5 D+ 13.2 D+ 1.6
NC 13 Miller (D) D+ 2.3 D+ 2.4 D+ 0.1
ND AL Pomeroy (D) R+ 13.0 R+ 12.5 D+ 0.5
NE 1 Fortenberry (R) R+ 11.6 R+ 13.0 R+ 1.4
NE 2 Terry (R) R+ 9.1 R+ 9.0 D+ 0.0
NE 3 Smith (R) R+ 23.6 R+ 26.4 R+ 2.8
NH 1 Shea-Porter (D) R+ 0.3 R+ 2.9 R+ 2.6
NH 2 Hodes (D) D+ 2.8 D+ 0.9 R+ 1.9
NJ 1 Andrews (D) D+ 14.2 D+ 9.6 R+ 4.6
NJ 2 Lobiondo (R) D+ 3.8 R+ 1.7 R+ 5.5
NJ 3 Adler (D) D+ 3.6 R+ 2.9 R+ 6.5
NJ 4 Smith (R) R+ 0.7 R+ 7.9 R+ 7.2
NJ 5 Garrett (R) R+ 4.1 R+ 9.5 R+ 5.4
NJ 6 Pallone (D) D+ 11.5 D+ 5.1 R+ 6.4
NJ 7 Lance (R) R+ 0.5 R+ 4.4 R+ 3.9
NJ 8 Pascrell (D) D+ 11.7 D+ 7.6 R+ 4.0
NJ 9 Rothman (D) D+ 13.2 D+ 6.6 R+ 6.6
NJ 10 Payne (D) D+ 34.2 D+ 30.8 R+ 3.3
NJ 11 Frelinghuysen (R) R+ 5.6 R+ 10.0 R+ 4.4
NJ 12 Holt (D) D+ 7.4 D+ 2.6 R+ 4.8
NJ 13 Sires (D) D+ 22.9 D+ 18.7 R+ 4.2
NM 1 Heinrich (D) D+ 2.3 D+ 2.1 R+ 0.2
NM 2 Teague (D) R+ 5.9 R+ 8.2 R+ 2.3
NM 3 Lujan (D) D+ 5.9 D+ 4.4 R+ 1.5
NV 1 Berkley (D) D+ 8.9 D+ 7.8 R+ 1.1
NV 2 Heller (R) R+ 8.2 R+ 7.8 D+ 0.4
NV 3 Titus (D) D+ 1.2 R+ 0.9 R+ 2.1
NY 1 Bishop (D) D+ 3.3 R+ 2.7 R+ 6.0
NY 2 Israel (D) D+ 8.0 D+ 1.6 R+ 6.3
NY 3 King (R) D+ 2.1 R+ 6.2 R+ 8.3
NY 4 McCarthy (D) D+ 9.4 D+ 3.4 R+ 6.0
NY 5 Ackerman (D) D+ 17.6 D+ 10.0 R+ 7.6
NY 6 Meeks (D) D+ 38.1 D+ 33.2 R+ 4.8
NY 7 Crowley (D) D+ 27.7 D+ 23.6 R+ 4.1
NY 8 Nadler (D) D+ 27.8 D+ 19.7 R+ 8.1
NY 9 Weiner (D) D+ 13.8 D+ 2.1 R+ 11.7
NY 10 Towns (D) D+ 40.5 D+ 35.3 R+ 5.3
NY 11 Clarke (D) D+ 39.8 D+ 35.3 R+ 4.5
NY 12 Velazquez (D) D+ 33.5 D+ 30.2 R+ 3.3
NY 13 McMahon (D) D+ 0.8 R+ 6.7 R+ 7.5
NY 14 Maloney (D) D+ 26.3 D+ 23.1 R+ 3.2
NY 15 Rangel (D) D+ 43.0 D+ 38.7 R+ 4.2
NY 16 Serrano (D) D+ 43.6 D+ 38.8 R+ 4.8
NY 17 Engel (D) D+ 20.7 D+ 15.8 R+ 4.9
NY 18 Lowey (D) D+ 10.1 D+ 6.3 R+ 3.8
NY 19 Hall (D) R+ 1.6 R+ 5.2 R+ 3.6
NY 20 (D) R+ 2.6 R+ 4.9 R+ 2.3
NY 21 Tonko (D) D+ 8.8 D+ 4.0 R+ 4.8
NY 22 Hinchey (D) D+ 5.9 D+ 3.7 R+ 2.2
NY 23 McHugh (R) R+ 0.3 R+ 3.4 R+ 3.1
NY 24 Arcuri (D) R+ 0.5 R+ 4.4 R+ 3.9
NY 25 Maffei (D) D+ 3.3 D+ 0.1 R+ 3.2
NY 26 Lee (R) R+ 3.7 R+ 8.3 R+ 4.6
NY 27 Higgins (D) D+ 6.5 D+ 0.9 R+ 5.6
NY 28 Slaughter (D) D+ 14.6 D+ 13.0 R+ 1.7
NY 29 Massa (D) R+ 4.9 R+ 8.0 R+ 3.1
OH 1 Driehaus (D) R+ 0.5 R+ 1.4 R+ 0.9
OH 2 Schmidt (R) R+ 13.2 R+ 15.5 R+ 2.2
OH 3 Turner (R) R+ 2.6 R+ 6.7 R+ 4.1
OH 4 Jordan (R) R+ 13.5 R+ 17.1 R+ 3.6
OH 5 Latta (R) R+ 10.0 R+ 11.2 R+ 1.2
OH 6 Wilson (D) D+ 0.2 R+ 4.7 R+ 4.9
OH 7 Austria (R) R+ 5.8 R+ 9.5 R+ 3.6
OH 8 Boehner (R) R+ 12.5 R+ 16.6 R+ 4.1
OH 9 Kaptur (D) D+ 8.9 D+ 7.0 R+ 1.9
OH 10 Kucinich (D) D+ 8.4 D+ 5.7 R+ 2.7
OH 11 Fudge (D) D+ 32.9 D+ 30.2 R+ 2.7
OH 12 Tiberi (R) R+ 0.8 R+ 2.4 R+ 1.6
OH 13 Sutton (D) D+ 6.6 D+ 3.1 R+ 3.5
OH 14 LaTourette (R) R+ 2.3 R+ 5.2 R+ 2.8
OH 15 Kilroy (D) R+ 0.8 R+ 1.4 R+ 0.6
OH 16 Boccieri (D) R+ 3.7 R+ 6.2 R+ 2.5
OH 17 Ryan (D) D+ 14.3 D+ 9.5 R+ 4.9
OH 18 Space (D) R+ 5.9 R+ 9.0 R+ 3.1
OK 1 Sullivan (R) R+ 12.6 R+ 18.2 R+ 5.6
OK 2 Boren (D) R+ 4.5 R+ 16.2 R+ 11.7
OK 3 Lucas (R) R+ 17.6 R+ 26.2 R+ 8.6
OK 4 Cole (R) R+ 13.1 R+ 20.2 R+ 7.1
OK 5 Fallin (R) R+ 11.8 R+ 15.2 R+ 3.4
OR 1 Wu (D) D+ 5.6 D+ 5.5 R+ 0.1
OR 2 Walden (R) R+ 11.1 R+ 12.3 R+ 1.2
OR 3 Blumenauer (D) D+ 17.5 D+ 16.4 R+ 1.1
OR 4 Defazio (D) R+ 0.1 R+ 0.8 R+ 0.7
OR 5 Schrader (D) D+ 0.7 R+ 1.1 R+ 1.8
PA 1 Brady (D) D+ 36.1 D+ 32.7 R+ 3.3
PA 2 Fattah (D) D+ 39.1 D+ 35.3 R+ 3.9
PA 3 Dahlkemper (D) R+ 1.3 R+ 5.2 R+ 3.9
PA 4 Altmire (D) R+ 2.6 R+ 8.7 R+ 6.2
PA 5 Thompson (R) R+ 9.7 R+ 12.0 R+ 2.3
PA 6 Gerlach (R) D+ 2.2 D+ 1.6 R+ 0.6
PA 7 Sestak (D) D+ 3.8 D+ 1.1 R+ 2.7
PA 8 Murphy (D) D+ 3.3 R+ 0.7 R+ 3.9
PA 9 Shuster (R) R+ 14.9 R+ 19.3 R+ 4.4
PA 10 Carney (D) R+ 7.6 R+ 11.0 R+ 3.3
PA 11 Kanjorski (D) D+ 5.6 D+ 1.6 R+ 4.0
PA 12 Murtha (D) D+ 4.5 R+ 3.4 R+ 8.0
PA 13 Schwartz (D) D+ 8.1 D+ 4.1 R+ 4.0
PA 14 Doyle (D) D+ 21.8 D+ 16.5 R+ 5.3
PA 15 Dent (R) D+ 1.5 R+ 0.4 R+ 1.9
PA 16 Pitts (R) R+ 11.2 R+ 10.2 D+ 1.0
PA 17 Holden (D) R+ 6.6 R+ 8.4 R+ 1.8
PA 18 Murphy (R) R+ 2.0 R+ 8.5 R+ 6.4
PA 19 Platts (R) R+ 12.2 R+ 14.0 R+ 1.8
RI 1 Kennedy (D) D+ 16.4 D+ 11.1 R+ 5.3
RI 2 Langevin (D) D+ 12.6 D+ 6.5 R+ 6.1
SC 1 Brown (R) R+ 9.7 R+ 13.0 R+ 3.3
SC 2 Wilson (R) R+ 9.0 R+ 11.3 R+ 2.3
SC 3 Barrett (R) R+ 13.9 R+ 19.0 R+ 5.1
SC 4 Inglis (R) R+ 14.6 R+ 17.1 R+ 2.5
SC 5 Spratt (D) R+ 5.6 R+ 9.2 R+ 3.6
SC 6 Clyburn (D) D+ 11.3 D+ 9.1 R+ 2.2
SD AL Herseth (D) R+ 10.0 R+ 11.3 R+ 1.4
TN 1 Roe (R) R+ 13.9 R+ 23.4 R+ 9.5
TN 2 Duncan (R) R+ 11.2 R+ 18.7 R+ 7.5
TN 3 Wamp (R) R+ 8.6 R+ 15.8 R+ 7.2
TN 4 Davis (D) R+ 3.3 R+ 15.6 R+ 12.3
TN 5 Cooper (D) D+ 6.0 D+ 0.6 R+ 5.4
TN 6 Gordon (D) R+ 3.8 R+ 15.0 R+ 11.2
TN 7 Blackburn (R) R+ 11.9 R+ 19.8 R+ 8.0
TN 8 Tanner (D) D+ 0.5 R+ 8.5 R+ 9.0
TN 9 Cohen (D) D+ 18.1 D+ 20.2 D+ 2.1
TX 1 Gohmert (R) R+ 16.9 R+ 22.7 R+ 5.8
TX 2 Poe (R) R+ 11.8 R+ 15.2 R+ 3.4
TX 3 Johnson (R) R+ 17.3 R+ 16.0 D+ 1.3
TX 4 Hall (R) R+ 16.8 R+ 23.5 R+ 6.8
TX 5 Hensarling (R) R+ 15.3 R+ 19.0 R+ 3.7
TX 6 Barton (R) R+ 14.8 R+ 16.7 R+ 1.9
TX 7 Culberson (R) R+ 15.3 R+ 15.0 D+ 0.3
TX 8 Brady (R) R+ 19.3 R+ 26.7 R+ 7.4
TX 9 Green (D) D+ 20.7 D+ 19.8 R+ 0.9
TX 10 McCaul (R) R+ 12.9 R+ 12.5 D+ 0.5
TX 11 Conaway (R) R+ 25.3 R+ 30.7 R+ 5.4
TX 12 Granger (R) R+ 14.3 R+ 19.0 R+ 4.7
TX 13 Thornberry (R) R+ 24.8 R+ 31.2 R+ 6.4
TX 14 Paul (R) R+ 14.3 R+ 20.5 R+ 6.3
TX 15 Hinojosa (D) D+ 2.7 D+ 0.8 R+ 1.9
TX 16 Reyes (D) D+ 9.0 D+ 7.5 R+ 1.4
TX 17 Edwards (D) R+ 17.8 R+ 22.5 R+ 4.8
TX 18 Jackson-Lee (D) D+ 23.2 D+ 21.2 R+ 2.0
TX 19 Neugebauer (R) R+ 24.8 R+ 28.5 R+ 3.8
TX 20 Gonzalez (D) D+ 7.7 D+ 5.6 R+ 2.1
TX 21 Smith (R) R+ 16.3 R+ 16.0 D+ 0.3
TX 22 Olson (R) R+ 14.3 R+ 15.0 R+ 0.7
TX 23 Rodriguez (D) R+ 4.0 R+ 6.4 R+ 2.4
TX 24 Marchant (R) R+ 15.3 R+ 14.0 D+ 1.3
TX 25 Doggett (D) D+ 1.7 D+ 3.1 D+ 1.4
TX 26 Burgess (R) R+ 12.3 R+ 15.5 R+ 3.2
TX 27 Ortiz (D) R+ 1.3 R+ 4.4 R+ 3.2
TX 28 Cuellar (D) R+ 0.8 R+ 2.7 R+ 1.9
TX 29 Green (D) D+ 7.7 D+ 5.3 R+ 2.4
TX 30 Johnson (D) D+ 25.7 D+ 24.8 R+ 0.9
TX 31 Carter (R) R+ 16.4 R+ 16.2 D+ 0.2
TX 32 Sessions (R) R+ 10.8 R+ 10.4 D+ 0.3
UT 1 Bishop (R) R+ 21.8 R+ 23.9 R+ 2.1
UT 2 Matheson (D) R+ 17.0 R+ 17.4 R+ 0.4
UT 3 Chaffetz (R) R+ 26.3 R+ 28.3 R+ 1.9
VA 1 Wittman (R) R+ 9.0 R+ 9.7 R+ 0.8
VA 2 Nye (D) R+ 5.8 R+ 7.2 R+ 1.4
VA 3 Scott (D) D+ 18.2 D+ 17.7 R+ 0.6
VA 4 Forbes (R) R+ 4.8 R+ 6.9 R+ 2.1
VA 5 Perriello (D) R+ 5.7 R+ 7.7 R+ 2.0
VA 6 Goodlatte (R) R+ 11.5 R+ 14.3 R+ 2.8
VA 7 Cantor (R) R+ 10.7 R+ 11.3 R+ 0.6
VA 8 Moran (D) D+ 13.6 D+ 13.5 R+ 0.1
VA 9 Boucher (D) R+ 7.4 R+ 13.8 R+ 6.4
VA 10 Wolf (R) R+ 5.4 R+ 4.7 D+ 0.7
VA 11 Connolly (D) R+ 0.8 R+ 0.1 D+ 0.7
VT AL Welch (D) D+ 9.1 D+ 10.8 D+ 1.7
WA 1 Inslee (D) D+ 7.7 D+ 6.5 R+ 1.2
WA 2 Larsen (D) D+ 2.8 D+ 0.9 R+ 1.9
WA 3 Baird (D) D+ 0.2 R+ 2.7 R+ 2.9
WA 4 Hastings (R) R+ 13.2 R+ 15.4 R+ 2.2
WA 5 McMorris (R) R+ 7.0 R+ 9.3 R+ 2.3
WA 6 Dicks (D) D+ 5.7 D+ 2.4 R+ 3.2
WA 7 McDermott (D) D+ 30.3 D+ 29.0 R+ 1.2
WA 8 Reichert (R) D+ 2.5 D+ 0.9 R+ 1.7
WA 9 Smith (D) D+ 5.6 D+ 2.9 R+ 2.7
WI 1 Ryan (R) R+ 2.3 R+ 4.9 R+ 2.6
WI 2 Baldwin (D) D+ 13.4 D+ 12.5 R+ 0.9
WI 3 Kind (D) D+ 2.8 D+ 1.4 R+ 1.4
WI 4 Moore (D) D+ 20.6 D+ 19.2 R+ 1.4
WI 5 Sensenbrenner (R) R+ 12.5 R+ 14.8 R+ 2.3
WI 6 Petri (R) R+ 4.9 R+ 6.7 R+ 1.8
WI 7 Obey (D) D+ 1.8 R+ 0.1 R+ 1.9
WI 8 Kagen (D) R+ 3.9 R+ 4.2 R+ 0.3
WV 1 Mollohan (D) R+ 5.6 R+ 11.5 R+ 5.9
WV 2 Capito (R) R+ 5.1 R+ 10.2 R+ 5.1
WV 3 Rahall (D) D+ 0.5 R+ 9.0 R+ 9.5
WY AL Lummis (R) R+ 19.5 R+ 22.0 R+ 2.5

The formula I used for calculating the Old and New Cook PVIs are as follows:  

Old Cook PVI = ((Bush’s 2000 two-party vote share in congressional district – Bush’s 2004 two-party vote share nationally) + (Bush’s 2004 two-party vote share in congressional district – Bush’s 2004 two-party vote share nationally))/2.  Postive numbers are Republican PVIs and negative numbers are Democratic PVIs (or you could get the same reults using the Democratic candidate’s numbers and then positive numbers would be D PVIs and negative numbers would be R PVIs).

New Cook PVI = ((Bush’s 2004 two-party vote share in congressional district – McCain’s 2008 two-party vote share nationally) + (McCain’s 2008 two-party vote share in congressional district – McCain’s 2008 two-party vote share nationally))/2.

The Cook PVI formula is very flawed, IMHO, in that part of the formula compares how results from a particular district in 2004 with how McCain did nationally in 2008.  Because McCain did much worse nationally than Bush did in 2004, this makes districts look much more Republican than they would be with a truly neutral formula (if the USA as a whole had a PVI of 0.0).  Under the Cook PVI formula, the USA as a whole had a PVI of R+0.8 for 2005-2008 and a PVI of D+2.5 currently.  This is totally screwy and defeats the purpose of the Cook PVI which is to show how much a congressional district is more democratic or republican than the nation as a whole.  To adjust for this flaw in the formula, mentally add D+2.5 to a district to see where it “really” is now, and add D+3.3 to all districts to see how much a district changed as a result of the 2008 election.

SSP Releases Presidential Results for All 435 Congressional Districts

Swing State Project is pleased to announce a final and official tally of the presidential election results in all 435 congressional districts. As you might recall, when we last left off a few weeks ago, we were still six districts shy, with only Nassau County, NY and Tuscaloosa County, AL outstanding. With these last few counties relinquishing their data, we can wrap up those last few districts, making Swing State Project the first outlet anywhere, blogosphere or elsewhere, to provide a full public release of presidential election results by CD… not just of percentages, but a transparent display of the underlying precincts, if you’re interested in delving that deep. If you want to bookmark the summary of the percentages for all districts for future reference, click here.

If you’re looking for additional detail about previously-discussed districts, see waves one, two, three, four, five, and six. For a truly ridiculous level of detail, each state’s database is accessible through our master database.

District Obama # McCain # Other # 2008 % 2004 % 2000 %
AL-06 74,657 243,465 2,625 23.3/75.9 22/78 25/74
AL-07 179,227 67,554 895 72.4/27.3 64/35 66/33
NY-02 164,106 125,978 2,272 56.1/43.1 53/45 57/39
NY-03 149,995 164,682 2,654 47.3/51.9 47/52 52/44
NY-04 171,346 122,166 1,945 58.0/41.4 55/44 59/38
NY-05 128,276 73,143 1,431 63.2/36.1 63/36 67/30

As you can see, AL-06 was one of our roughest districts, in about a three-way tie with AL-04 and TX-13 for worst Obama performance. And while Obama won Nassau County on Long Island by a decent margin, he didn’t improve on Kerry’s numbers by much. In fact, the 2008 numbers in both NY-03 (the Republican part of Long Island, relatively speaking) and NY-05 (a mix of Nassau County’s wealthiest areas and working-class white and Asian parts of Queens) matched the 2004 numbers exactly. The more diverse NY-02 and NY-04 saw larger improvements.

As with the last few waves, our commitment to accuracy compels us to issue a few more minor adjustments as we’ve refined our databases and/or gotten newer numbers. And, for one last time, thanks to jeffmd, Democratic Luntz, californianintexas, Benawu, Benjamin Johnstone-Anderson, and all the other SSP contributors who helped out anonymously… you all put the “crowd” in crowdsourcing.

District Obama # McCain # Other # Updated % What
we’d said
AL-03 119,489 156,075 2,086 43.0/56.2 42.9/56.4
HI-01 152,990 61,116 3,103 70.4/28.1 70.1/28.1
HI-02 172,881 59,450 4,028 73.1/25.2 72.8/25.0
MS-01 134,066 217,671 3,475 37.7/61.3 37.8/62.2
MS-02 196,582 100,211 1,708 65.9/33.6 66.4/33.6
MS-03 130,793 209,255 2,571 38.2/61.1 37.8/62.2
MS-04 93,221 197,460 2,852 31.8/67.3 32.0/68.0
TN-01 75,255 182,499 3,836 28.8/69.8 28.8/69.8
TN-02 104,166 195,146 4,586 34.3/64.2 34.3/64.2
TN-03 103,878 174,372 3,603 36.9/61.9 36.9/61.9
TN-04 92,964 173,892 4,581 34.3/64.1 34.2/64.0
TN-05 166,231 127,795 3,620 55.9/42.9 55.7/43.1
TN-06 112,575 190,364 4,739 36.6/61.9 36.6/61.9
TN-07 121,272 229,068 3,374 34.3/64.8 34.4/64.6
TN-08 112,943 148,050 3,338 42.7/56.0 42.7/56.1
TN-09 198,153 57,993 1,456 76.9/22.5 77.4/22.1

Crowdsourcing Pres-by-CD: Sixth Wave of Results

The waves keep getting smaller and smaller, as we wend our way closer to the conclusion of our massive presidential results-by-congressional district crowdsourcing project. For those of you who are counting, that leaves only six districts that we need to complete (AL-06 and AL-07, NY-02, NY-03, NY-04, and NY-05) in order to be not just the first outlet to make all this information public, but just plain the first outlet, period.

The geography nerds among you might be thinking, hey, that looks like we’re only two counties short of completion: Tuscaloosa County, AL, and Nassau County, NY. (You’re almost right: we also need Coosa County, AL, but it has only 12,000 people so I’m making a “close enough” call on AL-03 until we actually wrangle some data out of them.) Our ground forces in Alabama are already on the case of Tuscaloosa and Coosa Counties, but, to expedite matters, we need to switch on the SSP Batsignal over Gotham: we need an NYC-area correspondent to make the trek out to Mineola and have a date with the Nassau County Board of Elections’ copy machine. If you’re available to take this mission, please e-mail our intrepid publisher, DavidNYC (see the right column) and he’ll tell you what we need.

If you want to see a summary of the whole list of districts, click here. Waves one, two, three, four, and five provide additional detail, and for a truly ridiculous level of detail, each state’s database is accessible through our master database.

District Obama # McCain # Other # 2008 % 2004 % 2000 %
AL-03 117,511 154,408 2,068 42.9/56.4 41/58 47/52
AL-04 58,863 199,858 3,133 22.5/76.3 28/71 37/61
CO-01 222,008 72,573 4,637 74.2/24.3 68/31 61/33
CO-06 202,100 229,715 5,925 46.2/52.5 39/60 37/60
CO-07 168,885 113,873 5,615 58.6/39.5 51/48 50/49
IN-02 153,369 126,801 3,347 54.1/44.7 43/56 45/53
IN-03 123,571 162,183 2,727 42.8/56.2 31/68 33/66
MO-02 172,368 215,175 3,839 44.0/55.0 40/60 39/59
MO-09 144,583 181,339 5,199 43.7/54.8 41/59 42/55
NY-26 148,588 166,890 4,570 46.4/52.2 43/55 44/51
NY-27 156,635 127,249 5,144 54.2/44.0 53/45 53/41
NY-28 184,132 81,445 3,332 68.5/30.3 63/36 60/35

Points of interest in this wave include AL-04, which, to our surprise, plummets past the West Texas districts to grab the dubious distinction of Obama’s worst performance (at 22%). This district used to send a Democrat to Congress until 1996, and even Gore got 37% here… but this is Alabama’s whitest and most rural district, where the southern end of the Appalachians and Birmingham exurbs meet.

Aside from some stagnation in NY-27 (the blue-collar white parts of Buffalo), everything else here is good news: huge swings in both Denver and its conservative suburbs, and even bigger swings in Indiana, where we not just flipped IN-02 (South Bend) but won it pretty convincingly.

As with our previous wave, our resident numbers guru jeffmd has been refining our figures as new data continues to trickle in, so we have another corrections table with 16 revised districts over the flip. Again, nothing major, but we know that many SSP readers are fans of utter and complete accuracy.

District Obama # McCain # Other # Updated % What
we’d said
CO-02 235,090 124,841 6,136 64.2/34.1 66.5/31.9
CT-01 218,794 108,572 4,404 66.0/32.7 66.0/32.7
CT-02 204,220 139,945 5,056 58.5/40.1 59.1/39.5
CT-03 201,741 117,114 3,953 62.5/36.3 62.5/36.3
CT-04 190,996 126,819 2,130 59.7/39.6 59.6/39.7
CT-05 182,021 136,978 4,054 56.3/42.4 56.3/42.4
IL-11 175,648 148,695 5,080 53.3/45.1 53.4/45.1
IL-14 174,341 139,187 4,445 54.8/43.8 55.2/43.5
IL-17 156,671 117,111 4,031 56.4/42.2 56.3/42.3
IL-18 149,524 154,805 5,095 48.3/50.0 49.1/49.2
MI-11 197,857 163,958 6,115 53.8/44.6 53.8/44.6
MI-13 200,387 34,231 1,933 84.7/14.5 82.9/16.2
MI-14 232,473 36,444 2,127 85.8/13.5 84.2/14.9
MI-15 224,505 110,833 5,861 65.8/32.5 66.2/32.1
TX-11 58,326 185,389 1,919 23.8/75.5 23.6/75.4
TX-23 124,995 118,391 1,634 51.0/48.3 50.9/48.1

Crowdsourcing Pres-by-CD: Fifth Wave of Results

The presidential-results-by-congressional-district crowdsourcing project at Swing State Project just keeps rolling along, and we’re really getting close to total completion. We’re adding 31 more districts today, having scored precinct-level data from some of the largest counties still outstanding (most notably, Queens County, NY, and Wayne County, MI). That leaves only 18 districts with problem counties left to go! (Nassau and Erie Counties, we’re lookin’ at you…)

As always, big thanks to all SSP readers who’ve contributed to this project, with extra thanks for this batch to Democratic Luntz and jeffmd, who rocks an Excel pivot table like nobody’s business. If you want to see a handy list of all districts in one place, look here. If you want a fuller picture, waves one, two, three, and four are here. And if you want an absolutely crushing level of detail, just click on our master database and then on a particular state to see each district in all its precinct-level glory.

District Obama # McCain # Other # 2008 % 2004 % 2000 %
CA-11 169,183 139,863 5,495 53.8/44.5 45/54 45/53
CA-14 213,671 72,707 5,883 73.1/24.9 68/30 62/34
CA-15 174,571 75,753 4,837 68.4/29.7 63/36 60/36
CA-16 154,324 63,975 3,585 69.6/28.8 63/36 64/33
CA-18 104,299 68,629 3,141 59.2/39.0 49/50 53/44
CA-19 124,533 141,013 4,990 46.0/52.1 38/61 39/58
CA-20 77,158 50,146 2,257 59.6/38.7 51/48 55/44
CA-21 93,578 125,293 3,591 42.1/56.3 34/65 37/61
CA-23 172,348 85,261 6,312 65.3/32.3 58/40 54/40
CA-24 160,738 151,678 5,916 50.5/47.7 43/56 43/54
IN-06 133,459 151,596 3,933 46.2/52.5 35/64 40/59
MI-11 196,909 163,190 6,075 53.8/44.6 47/53 47/51
MI-12 212,850 108,752 5,626 65.1/33.2 61/39 61/37
MI-13 167,242 32,722 1,763 82.9/16.2 81/19 80/19
MI-14 189,406 33,533 1,906 84.2/14.9 83/17 81/18
MI-15 219,674 106,322 5,680 66.2/32.1 62/38 60/38
NJ-01 198,196 103,992 3,687 64.8/34.0 61/39 63/34
NJ-02 165,983 137,448 3,967 54.0/44.7 49/50 54/43
NJ-04 150,975 169,848 3,914 46.5/52.3 44/56 50/46
NJ-12 198,145 139,367 3,575 58.1/40.9 54/46 56/40
NY-06 185,890 22,302 598 89.0/10.7 84/15 87/11
NY-07 148,242 38,170 943 79.1/20.4 74/25 75/21
NY-09 111,237 88,307 1,533 55.3/43.9 56/44 67/30
NY-12 154,394 23,504 1,283 86.2/13.1 80/19 77/15
NY-14 212,802 56,946 2,402 78.2/20.9 74/25 70/23
OH-06 142,474 150,551 6,268 47.6/50.3 49/51 47/49
OH-13 183,254 136,316 4,640 56.5/42.1 56/44 53/44
OH-16 152,509 160,914 6,355 47.7/50.3 46/54 42/53
OH-17 179,531 104,773 6,011 61.8/36.1 63/37 60/35
TX-15 100,398 66,501 922 59.8/39.6 49/51 54/46
TX-27 97,830 84,366 1,283 53.3/46.0 45/55 50/50

So what are the highlights and lowlights for this installment? As we’ve seen earlier, California just went from dark blue to even bluer, and that seeped all the way down to some of its reliably red districts (CA-24 in Ventura County went narrowly for Obama… which hopefully will convince Elton Gallegly of the many botched retirement attempts to actually get off the pot this time… and we even came close in CA-19, which stitches together the Sierras and the whiter parts of the Central Valley). A lot of that movement may have to do with California’s huge Latino population, fed up with the GOP’s increasing reliance on immigrant-bashing; parallel movement is seen in Texas, where two mostly-Latino districts (TX-15 and TX-27) also show wide swings in the Democratic direction.

Also, as we’ve seen in other districts, Indiana had some of the biggest Democratic swings in the nation, simply by virtue of the Democrats showing up and competing there for once. Check out IN-06. Remember, this is the district represented by Mike Pence, arch-wingnut who just got promoted from leading the RSC to the #3 position in the whole GOP caucus… and now he’s in a district that McCain won by just 6 points.

On the bad side of the ledger, we’re seeing continued declines in some of the blue-collar white-ethnic districts in the NYC area. These districts suffered some of the biggest declines in that nation from Gore to Kerry, and I thought that might be a temporary 9/11 effect since those districts were some of the ones hardest hit. However, we’ve continued to lose ground in NY-09 (the old-school parts of Brookyln and Queens), and are stagnant in NJ-04 (Ocean and Monmouth Counties, where people from NY-09 go to retire). Not that it matters too much; these districts are outweighed by the overall blue trends in these already-blue states. And in NY-09 they still managed to kick out state senator Serphin Maltese to finally flip control of the New York senate; Obama’s performance may have to do more with 2008-specific racism/latent PUMAism than an overall trend.

Also troubling is what’s going on in eastern Ohio, where we lost ground in OH-06 and OH-17. It’s not hard to explain — OH-06 is considered the Appalachian part of Ohio, while OH-17 is centered on Youngstown, a place similar to Pittsburgh’s collar counties where the once-strong union base is dying off or drifting away as the manufacturing sector evaporates. This is more worrisome since Ohio is a swing state where every vote counts, but as this part of the state is hollowing out while the Columbus and Cincinnati areas are starting to move into our column, it’s not a killer.

Finally, I’m making good on my promise of some updates, based on further refining of early-vote or split-precinct data, or finding more data from small counties where we’d previously made a “close enough” judgment. As you’ll see, the numbers haven’t moved that much, with a few exceptions (perhaps most significantly in IL-18, which we originally thought Obama had won by a few thousand votes but turns out he lost by a few hundred; see also improvements in FL-06 and FL-07, SC-01 and SC-06). This will only be of interest to people who are real sticklers for accuracy or who are keeping their own spreadsheets on this subject. (Of course, since we’re talking about Swing State Project here, that probably describes most of our readership!) The updates tables is over the flip…

District Obama # McCain # Other # Updated % What
we’d said
FL-01 112,793 234,185 4,349 32.1/66.7 32.2/66.7
FL-02 163,954 199,591 4,207 44.6/54.3 44.7/54.3
FL-03 169,406 60,062 1,636 73.3/26.0 73.0/26.4
FL-04 143,324 233,446 3,765 37.7/61.4 37.6/61.5
FL-06 174,701 228,651 4,662 42.8/56.0 38.4/60.6
FL-07 183,619 213,831 4,516 45.7/53.2 42.0/57.0
FL-08 189,402 168,842 2,742 52.5/46.8 52.4/46.8
FL-11 178,935 89,793 2,691 65.9/33.1 65.7/33.3
FL-12 163,745 168,399 3,112 48.8/50.2 47.7/51.3
FL-13 178,967 199,216 4,525 46.8/52.1 46.7/52.3
FL-14 169,067 226,967 3,827 42.3/56.8 42.3/56.9
FL-15 186,597 200,229 4,638 47.7/51.2 46.9/52.0
FL-16 175,017 192,431 4,038 47.1/51.8 47.2/51.8
FL-23 194,488 39,578 1,152 82.7/16.8 82.8/16.7
FL-24 189,895 197,541 3,937 48.5/50.5 47.3/51.7
FL-25 127,290 129,940 1,382 49.2/50.3 49.3/50.2
IL-08 167,812 129,030 4,208 55.7/42.9 56.6/42.1
IL-11 175,033 147,758 5,059 53.4/45.1 53.6/44.9
IL-14 168,611 132,838 4,298 55.2/43.5 54.4/44.2
IL-15 143,659 151,477 5,264 47.8/50.4 48.8/49.4
IL-17 149,220 112,197 3,837 56.3/42.3 58.1/40.4
IL-18 143,140 143,551 4,823 49.1/49.2 49.6/48.7
IL-19 139,335 171,883 5,616 44.0/54.3 42.0/56.2
IN-04 142,930 185,843 3,557 43.0/55.9 43.0/55.9
IN-08 140,063 151,570 3,727 47.4/51.3 47.4/51.3
IN-09 154,628 160,248 3,930 48.5/50.3 49.1/49.7
KS-02 134,337 170,635 6,013 43.2/54.9 43.1/54.9
KS-03 187,372 177,814 5,186 50.6/48.0 50.6/48.1
LA-01 78,325 221,781 4,868 25.7/72.7 25.3/73.1
LA-02 137,748 46,205 1,873 74.1/24.9 74.3/24.7
LA-03 101,428 167,046 5,411 37.0/61.0 36.6/61.4
LA-04 108,273 162,198 3,152 39.6/59.3 39.6/59.3
LA-05 106,097 177,277 3,718 37.0/61.8 36.7/62.0
LA-06 132,556 184,422 4,297 41.3/57.4 41.4/57.3
LA-07 105,117 188,576 4,953 35.2/63.1 35.0/63.4
MA-01 195,983 102,450 6,984 64.2/33.5 66.0/34.0
MA-02 178,090 117,272 6,269 59.0/38.9 60.3/39.7
MA-05 175,986 117,710 4,968 58.9/39.4 59.9/40.1
MA-06 192,502 135,956 5,474 57.7/40.7 58.6/41.4
MA-07 189,228 97,123 4,948 65.0/33.3 66.1/33.9
MA-08 202,152 32,445 1,612 85.6/13.7 86.1/13.9
MA-09 188,863 120,436 3,545 60.4/38.5 61.2/38.8
MA-10 196,304 155,992 5,461 54.9/43.6 55.8/44.2
MD-01 147,543 215,918 7,136 39.8/58.3 39.8/58.3
MD-02 178,241 113,929 5,684 59.8/38.3 59.6/38.5
MD-03 192,690 128,593 6,523 58.8/39.2 58.6/39.5
MD-04 270,377 45,014 2,486 85.1/14.2 85.1/14.1
MD-05 233,917 119,020 4,520 65.4/33.3 64.9/33.9
MD-06 139,744 200,475 7,528 40.2/57.7 40.2/57.7
MD-07 234,422 59,183 3,929 78.8/19.9 78.7/20.0
MD-08 232,533 77,730 4,461 73.9/24.7 73.4/25.2
MO-08 101,889 173,128 4,651 36.4/61.9 36.3/62.1
OH-18 115,868 132,972 6,226 45.4/52.1 45.5/52.0
OR-02 154,848 193,002 10,473 43.2/53.9 43.3/53.7
OR-04 201,143 161,079 11,698 53.8/43.1 53.7/43.2
PA-02 298,834 31,584 1,435 90.1/9.5 90.7/8.9
PA-08 192,570 160,695 3,905 53.9/45.0 53.6/45.3
PA-15 179,589 139,396 4,158 55.6/43.1 56.3/42.4
SC-01 146,919 196,389 4,298 42.3/56.5 39.9/58.8
SC-02 159,063 189,949 3,567 45.1/53.9 43.2/55.8
SC-03 103,434 188,316 3,803 35.0/63.7 34.4/64.3
SC-04 119,259 190,113 5,254 37.9/60.4 37.9/60.4
SC-05 144,267 167,072 3,635 45.8/53.0 45.2/53.7
SC-06 189,507 103,057 2,829 64.2/34.9 61.9/37.1
TX-01 81,872 184,963 1,433 30.5/69.0 30.5/68.8
TX-04 93,316 213,565 2,262 30.2/69.1 30.1/68.9
TX-06 114,283 172,535 1,870 39.6/59.8 39.7/59.5
TX-08 74,545 215,377 2,058 25.5/73.8 25.4/73.8
TX-10 150,713 187,496 2,941 44.2/55.0 44.3/54.6
TX-11 58,275 184,814 1,915 23.8/75.4 23.6/75.4
TX-13 53,860 181,541 1,786 22.7/76.5 22.9/76.2
TX-17 82,326 172,822 1,992 32.0/67.2 31.8/67.3
TX-19 65,020 170,969 1,693 27.4/71.9 27.4/71.8
TX-23 124,716 117,817 1,630 51.1/48.3 50.9/48.1
TX-26 137,613 193,132 2,213 41.3/58.0 41.8/57.3
TX-31 124,608 172,570 2,879 41.5/57.5 41.5/57.3

A Look at the Cook Political Report’s Partisan Vote Index (PVI)

Hardly a day – hardly a post – goes by here at the Swing State Project without a reference to the Cook Political Report’s Partisan Vote Index, or PVI for short. In the wake of the 2008 elections, SSP’s pres-by-CD project has spurred a lot of discussion about how the PVI is calculated and why it’s calculated the way it is.

Quite a few people people had a hard time believing my explanation of the math behind the PVI. But you don’t have to take my word for it – this is how the Almanac of American Politics explains things:

Cook Partisan Voting Index. Refers to the Partisan Voting Index (PVI) as used by Charlie Cook, Washington’s foremost political handicapper. The PVI is designed to provide a quick overall assessment of generic partisan strength. For this volume, the PVI includes an average of the 2000 and 2004 presidential elections in the district as the partisan indicator. The PVI value is calculated by a comparison of the district average for the party nominee, compared to the 2004 national value for the party nominee. The calculations are based upon the two-party vote. The national values for 2004 are George W. Bush 51.2% and John Kerry 48.8%. The PVI value indicates a district with a partisan base above the national value for that party’s 2004 presidential nominee. Thus a district with an R+15 is a district that voted 15 percentage points (as an average of its 2000 and 2004 presidential vote) higher for Bush than the national value of 51.2%. Similarly, a district with a D+15 is a district that voted 15 percentage points (as an average of its 2000 and 2004 presidential vote) higher for Kerry than the national value of 48.8%. An X +00 indicates an evenly balanced district. (Emphasis added.)

The boldface sentences confirm my understanding of how PVI works. But why should it be calculated this way? I agree with the majority sentiment that it seems to make more sense to compare 2000 district performance with 2000 nationwide performance, not 2004 nationwide performance. This isn’t as big of a deal with the two Bush elections because they were both so close, but comparing Kerry’s 2004 district numbers with Obama’s nationwide numbers produces some pretty serious gaps. I’d be curious to know what sort of justifications or rationales anyone can come up with for the status quo.

In the meantime, some have suggested computing an “SVI” – a “Swing State Project Voting Index,” comparing 2004 to 2004 and 2008 to 2008. In fact, CalifornianInTexas has already gone ahead and started calculating these numbers. For the most part, these will be more favorable to Dems, as the big Kerry minus Obama splits are removed from the equation.

So, I’m asking the community: Should we use the “SVI”? Should it be in addition to the PVI? Are there any pitfalls if we do so? Any reasons not to? Let’s hear your thoughts!