SSP’s Competitive State Legislature Ratings

Legislative Body Composition
OK-Senate
TN-Senate
PA-House
IN-House
MT-House
ME-Senate
NY-Senate
OR-House
MT-Senate
NV-Senate
WI-Assembly
TX-House
MI-House
IA-House
OH-House
TN-House
DE-House
WI-Senate
AZ-House
AK-Senate
IL-House
24-24
16-16-1
102-101
51-49
50-49-1
18-17
32-30
31-29
26-24
11-10
52-47
79-71
58-52
53-47
53-46
53-46
22-19
18-15
33-27
11-9
67-51

We’re going to try something new here at Swing State Project: a list of competitive state legislature races for 2008. However, we aren’t breaking them down into the tossup/lean/likely framework that you’re familiar with. Unlike Senate and House races, where there is abundant polling and fundraising information to help us make informed decisions, state legislatures are jigsaws made up of hundreds of different races, most of which we know precious little about. Therefore, we’re simply listing the closest legislative bodies, starting with the ones that are tied and working downward based on percentage of seats held by the majority party.

There are a few legislative bodies that are close enough to be on this list, but aren’t included because they’re elected in off-years (Louisiana House, 53 D/49 R/1 I/2 V) or everyone gets elected all together in 2010 (Michigan Senate, 17 D/21 R).

This list makes a few of these legislative bodies look to be at more risk of flipping than they actually are. For instance, the Tennessee Senate isn’t likely to flip back to us this year, as we’re facing the potential loss of Democratic held open seats in GOP-leaning rural areas due to retirement. Conversely, Democrats in the Oregon House are likely to strengthen their position because of Republican retirements in suburban Dem-leaning seats. Indiana Democrats also seem optimistic about their ability to hold the razor-close Indiana House.

Likewise, there are chambers where reality might place them a little higher on the list. Most prognosticators, for instance, would agree that the New York Senate flipping to Democratic control is all but a done deal at this point, what with Majority Leader Joe Bruno already having hit the eject button and several GOP old-timers in strongly Democratic seats running on fumes. Similarly, there’s a lot of optimism about retaking the Wisconsin Assembly.

Also, there is a handful of states where the number of seats needed to flip, and the small number of constituents per seat, make it possible that anything can happen. (Consider the New Hampshire House of Representatives in 2006. The GOP controlled 62% of the seats, making it look safe. The Democrats flipped 90 seats (out of 400… NH has by far the largest state legislature) to take firm control. No one saw that coming, proof that anything can happen at this level.)

Alaska may be a prime example, where Dems only need to flip two seats to take control of the Senate… and with indictments cutting a swath through the Republican caucus in the Senate, the popular Governor now facing a mini-scandal of her own, and potentially big Obama coattails, it may be the year to make it happen. The Senates in both North and South Dakota also need only a few flipped seats to change hands, and, again, with Obama coattails, it’s possible; the same applies to the perpetually-close Montana House.

As stated during last month’s state legislature overview, though, useful links about state legislatures are few and far between in the blogosphere, so we need our readers to help be our eyes and ears. If you have any further insights into any of these races or helpful links, please share in the comments.
WI-08: GOP Internal Poll Shows Close Race

(From the diaries – promoted by James L.)

New GOP internal poll in WI-08, h/t Politico, from Public Opinion Strategies (7/8-7/9, likely voters):

Steve Kagen (D-inc): 46

John Gard (R): 42

(N=400, MoE=±4.9%)

There’s reason for concern in this district; Gard’s a former Wisconsin Assembly Speaker and very narrowly outraised Kagen last quarter. The poll also shows Gard with very high name recognition (88%). McCain leads Obama in the district 46-41.

Kagen, however, has plenty of cash on hand and personal wealth he can dig into if necessary.

SSP currently rates this race as Leans Democratic.

Graphic Anatomy of Victory: Wisconsin (w/maps)

This is the eight in a series of diaries depicting the Democratic victory in this year’s midterm elections. Other diaries in this series can be seen here.

Already covered have been New England, NY, NJ, MD, and DE, PA, OH, IN, and Michigan.

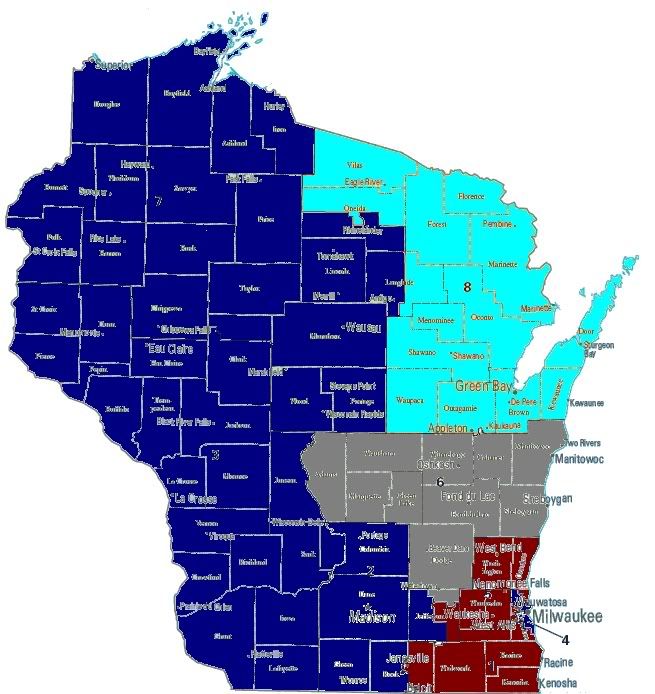
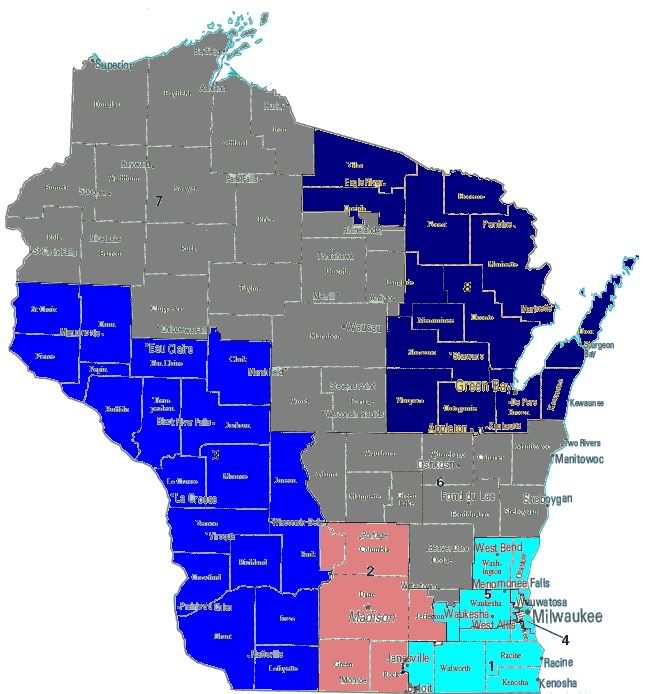
Today’s diary will focus on Wisconsin. As always first up are the seat control maps.

2004

2006

Of the  1,852,619 votes cast in the 2006 US House races in Wisconsin,  1,001,254 votes (54%) were cast for Democratic candidates, while  836,054 votes (45.1%) were cast for Republicans.  Including unopposed races that Democrats had an 8.9% vote total advantage, a 5.1% improvement over 2004.  

2006 vote totals for the the race in the WI-06 are not currently available online, so the numbers above don’t include that district.

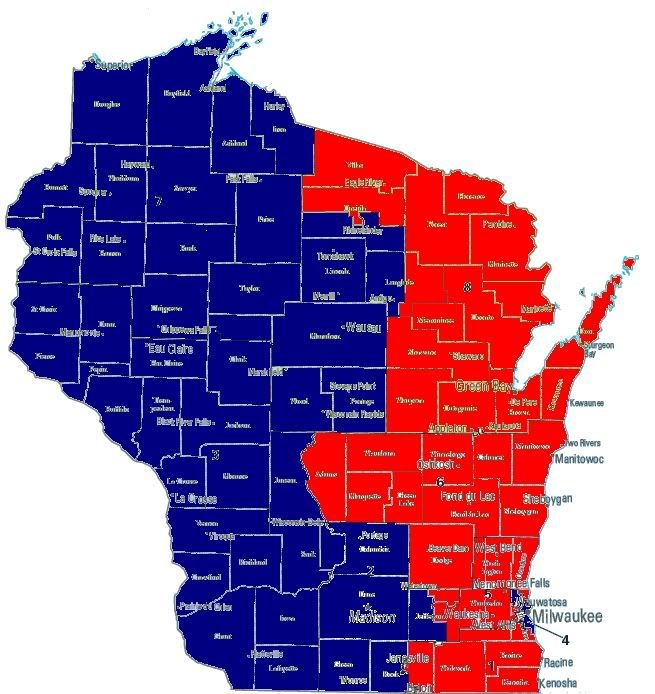
2006 Vote Margins

The deepest blue indicates a Democratic vote share over 60%, medium blue 55-60%, light blue 50-55%, pink 45-50%, medium red 40-45%, deep red 40% or less.

Democrat Steve Kagen won in the open seat in the WI-08 defeating Republican State Assembly Speaker John Gard by 6,608 votes (2.4%).  This represents a 21.4% surge over the 2004 Democratic vote share (29.8%) in this district.  Coming in at over $4 Million , Democrat Steve Kagen spent $1.7 Million of his own money outspending Republican John Gard by over $100,000.

All other races in Wisconsin were won by margins of over 10%.

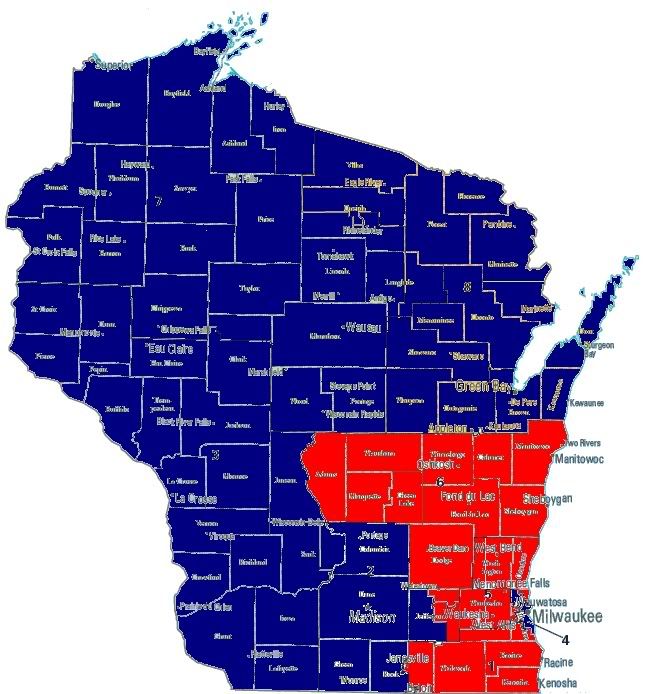
2006 Vote Gains

The deepest blue indicates a Democratic vote gain of over 10%, medium blue 5-10%, light blue 0-5%, pink 0 to-5%, medium red -5 to -10%, deep red -10% or less.

2006 vote totals for the WI-06 where the Republican went unchallenged are unavailble, and the WI-07 is grayed out because there was no 2004 Republican challenger.

The most impressive vote gain was in the WI-08 as was mentioned above. In the WI-02, there was a 0.4% shift towards the Republican, while  Democrats made an 8.4% gain in the WI-02, yielding  much large Democratic margin of victory than in 2004.  In the Milwaukee suburbs, Democrats made 4.8% and 4% gains in the WI-01 and WI-05 respectively.  However, the Republican margin of victory in these districts was over 25% in 2006.

In this series I have created a race tier system that is I will explain in the next few sentences. Tier 0 races are those where the Democratic candidate won by a margin of less than 5%, the presumption being that incumbency grants an advantage of 5-10% that with the fundraising advantage that comes with holding office should be sufficient for these candidates to defend their seats without funding from the party.  The assumption that incumbency gives a 5-10% advantage drives the classification of the pickup categories.  Tier 1 races are those where the incumbent won by less than 5% in 2006, while tier 2 races are those where Republicans won by less than 10%.  It’s really quite simple.

Tier 0

Race   D%       R%        Margin        2006 D Cand.

WI-08  51.2%   48.8%      2.4%          Steve Kagen  

Tier 1

Race      D%      R%     Margin    2006 D Cand.

No races meet the criteria for this tier.

Tier 2

Race      D%      R%     Margin    2006 D Cand.

No races meet the criteria for this tier.

And finally the running totals for the series.

Tier 0 (5)

CT-02, NY-19, NH-1, IN-09, WI-08

Tier 1 (9)

CT-04, NJ-07, NY-25, NY-26, NY-29, OH-2, OH-15, PA-06, MI-07

Tier 2 (4)

OH-01, PA-15, IN-03, MI-09

States Covered

CT, IN, MA, MD,ME, MI, NH, NJ, NY, OH,PA, RI, WI, VT