Analyzing Virginia’s 2009 Gubernatorial Election, Part 2

This is the second part of two posts analyzing Virginia’s 2009 gubernatorial election. The previous part can be found here.

When Democrats nominated State Senator Creigh Deeds, they nominated a rural, moderate Democrat designed to win the small towns and rural regions of western Virginia. In an ideal situation, Mr. Deeds would have carved out a coalition similar to former Governor Mark Warner’s.

Photobucket

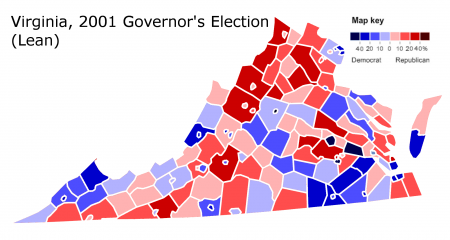
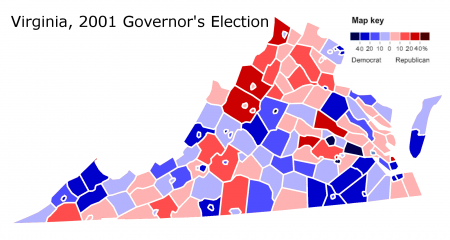
In 2001, Mr. Warner won a 5.13% victory over Attorney General Mark Earley, based largely upon rural support in western Virginia.

Mr. Warner is famous among Democrats for this achievement (remember, this was just two months after 9/11). He went on to become a successful and very popular governor; in 2008, Mr. Warner ran for Senate and won double his opponent’s vote. Since Mr. Warner, no other Democratic candidate has ever built a coalition similar to his.

More below.

Below is Virginia’s political lean during the 2001 gubernatorial election:

Photobucket

These maps indicate the results of a hypothetically tied election, which is useful to determine the political lean of each county (i.e. whether a certain place voted more Democratic or Republican than the state as a whole). For example, last year Indiana voted for President Barack Obama – but relative to the country as a whole, it leaned Republican.

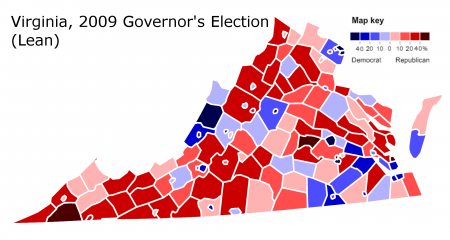
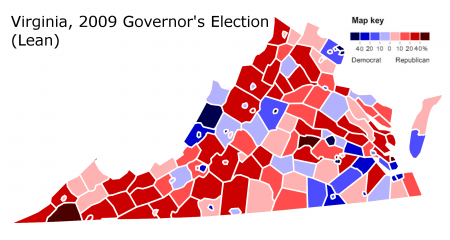
For comparison, here is the correlating map for Creigh Deeds (if Mr. Deeds had tied Mr. McDonnell), which I mapped in my last post:

Photobucket

As the maps indicate, Creigh Deeds failed miserably at recreating the rural Warner coalition. Despite being a rural candidate, Mr. Deeds did far worse in rural western Virginia.

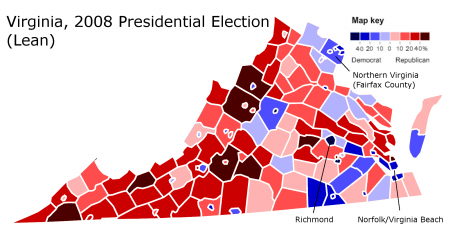
Instead, Mr. Deeds appears to have done best in urban Virginia: Northern Virginia, Richmond, and the Norfolk-Virginia Beach metropolitan area. Rather than repeating Mark Warner’s coalition, the performance of Creigh Deeds appears far closer to that of President Barack Obama’s:

Photobucket

Mr. Obama won through a urban-suburban alliance, compared to the urban-rural alliance of Mr. Warner.

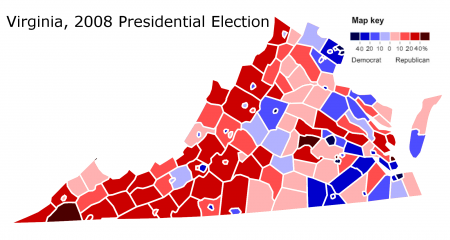
Here is Mr. Obama’s performance without the lean:

Photobucket

To be fair, I would prefer the Obama coalition to the Warner coalition: suburban strength is more lasting than votes built upon dying small towns.

Nevertheless, it is discomfiting to note the extent to which a candidate like Creigh Deeds – a rural, moderate Democrat who distanced himself from Mr. Obama – replicated the president’s performance. For better or for worse, it seems, Democratic candidates will from now on be attached hip-to-hip with Mr. Obama.

(Note: All statistics are derived from http://www.uselectionatlas.org/ ).

–Inoljt, http://mypolitikal.com/
Analyzing Virginia’s 2009 Gubernatorial Election, Part 1

This is the first part of two posts analyzing Virginia’s 2009 gubernatorial election. The second part can be found here.

Photobucket

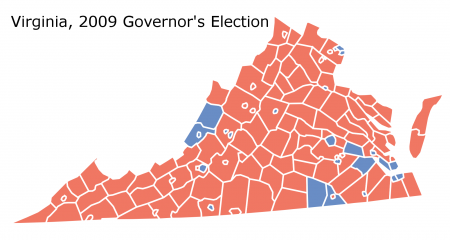
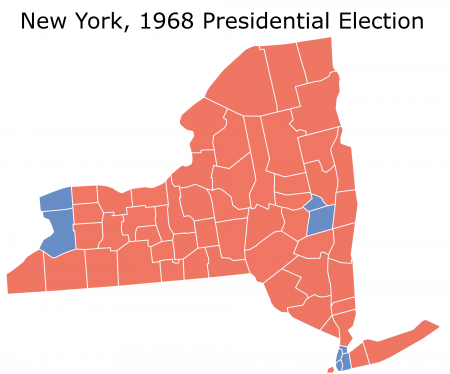
A normal observer might see the above map and naturally conclude that the Democratic candidate lost a landslide election. This is not always the case. In the 1968 presidential election, for instance, the state of New York looked like this:

Photobucket

Although it does not look like it, Democratic candidate Hubert Humphrey won the state: 49.76% to 44.30%.

In November 2009, however, State Senator Creigh Deeds did in fact receive a thorough pummeling from Attorney General Bob McDonnell. An unappealing candidate running in a tough national climate, Mr. Deeds lost the race 41.25% to 58.61%.

More below.

Creigh Deeds only won two types of counties: his home district and Democratic strongholds. The former include the two blue counties along the state’s eastern border. The latter are populated by two Democratic constituencies: firstly, blacks in Virginia’s 3rd congressional district and secondly, wealthy suburbanites south of Washington (Virginia’s 8th congressional district).

Surprisingly (and disturbingly) Mr. Deeds lost Fairfax County, the key to recent Democratic success in Virginia. Rich, diverse, and heavily populated – Northern Virginia suburban voters were largely responsible for Democratic victories by Governor Tim Kaine, Senator Jim Webb and President Barack Obama.

Mr. McDonnell’s victory in Fairfax indicates one of two things. Either the Democratic Party has not entrenched itself in NoVa – or it is moving back to the Republicans. The latter possibility is highly worrisome and not simply confined to Virginia.

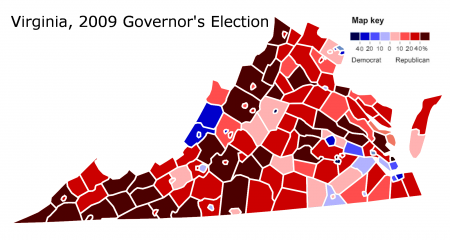
There is little more that the above map indicates – one cannot tell much from a map that just shows red counties. Differentiating the mass of red reveals more:

Photobucket

This image maps the results based on degree of support. It shows a substantial east-west divide hidden in the first map. Western Virginia voted Republican with far more intensity; eastern Virginia tended to be more moderate in its support of Mr. McDonnell.

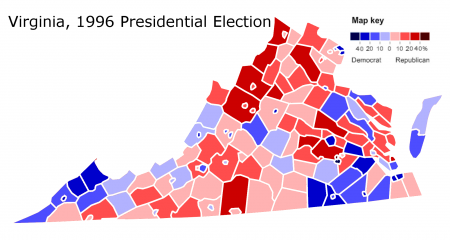
Notice how intensely Republican the western panhandle is voting. These voters – poor, white, rural Appalachian folk – used to vote Democratic based on economic appeals. This trend subsisted even in fairly recent times: John Kerry won a couple counties; Senator Jim Webb took three. Former president Bill Clinton did even better (he lost the state by 1.96%):

Photobucket

Creigh Deeds, a moderate politician representing an Appalachian district, was supposed to appeal to the rural voters populating western Virginia; as the map makes evident, he failed to do so (outside his home districts). I suspect Barack Obama  may have something to do with this; his poor performance amongst Appalachian voters may be affecting Democratic candidates everywhere. Given the many Democratic politicians elected from Appalachia, this – if true – would definitely be a bad thing for Democrats.

Finally, it is possible to map the results if Mr. Deeds had tied Mr. McDonnell:

Photobucket

This indicates the relative Democratic or Republican lean of each county – a county may vote Republican but still lean Democratic compared to the overall result, and vice versa. Massachusetts, for example, voted Republican in Ronald Reagan’s 1984 landslide – but nobody would accuse it of being a Republican state. It went red, but relative to the rest of the nation was more Democratic.

The next section will compare this map with similar images derived from previous Democratic coalitions.

(Note: All statistics are derived from http://www.uselectionatlas.org/).

–Inoljt, http://mypolitikal.com/