By: Inoljt, http://mypolitikal.com/
On November 4, 2008 Senator Barack Obama was elected president, winning a substantial margin over Republican candidate John McCain. In the popular vote, Mr. Obama won 52.9% of the electorate to Mr. McCain’s 45.7%; he thus took a 7.2% margin.
Mr. Obama, however, did not do so well with white, non-Hispanic voters. According to exit polls, the newly elected president lost whites by double-digits; taking 43% of the white vote to Mr. McCain’s 55% support.
This is not anything new; for decades now, the Democratic Party has been losing the white vote. Indeed, the last time a Democratic presidential candidate actually won whites was in 1964, when Texan Lyndon Johnson delivered a landslide pummeling to Senator Barry Goldwater.
Ever since then Democrats have been in a bad way with whites:
More below.
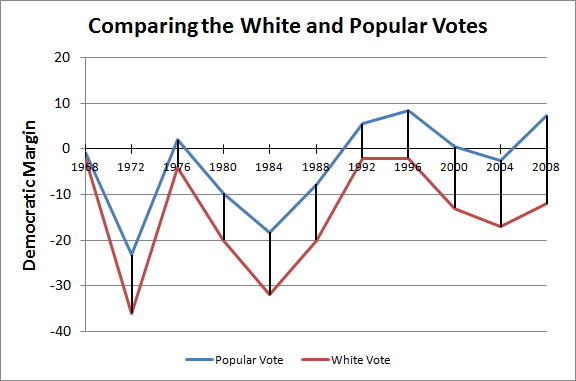
This graph compares the Democratic share of the white vote (as found by exit polls) to their share of the total vote. The top line indicates the former; the bottom indicates the latter. The three Democrats who did relatively well with whites were Democratic candidates Hubert Humphrey, Jimmy Carter, and Bill Clinton.
As the graph shows, the white vote generally follows the popular vote (not a surprise, given that it composes the majority of the popular vote). Nevertheless the gap between the two has been steadily widening; in the past three elections, Democrats lost whites by double-digits yet still remained competitive in the general election.
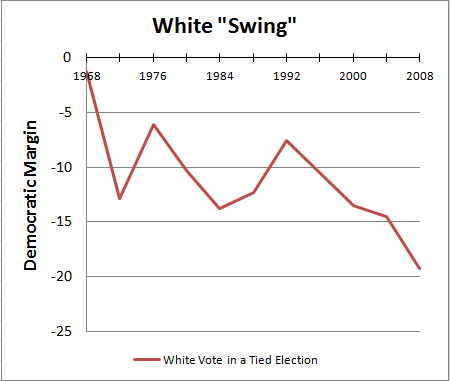
This trend can be more accurately pictured by graphing the relative “swing” of the white vote compared to the overall election:
This measurement indicates how the white electorate would have voted if an election had been tied; it is more useful than looking at the absolute vote. A candidate who lost the white vote by 40%, for instance, would generally be said to have done poorly with whites. If, however, we found out that the candidate had done even worse with the general electorate – say, losing by 45% – one could very well say that he or she did relatively well with whites.
In the last presidential election, for instance, Mr. Obama lost whites by twelve points, according to exit polls. However, Mr. Obama also won the overall electorate by seven points. Whites were therefore nineteen points more Republican than the average voter – as the graph indicates. In a hypothetically tied election, they would have voted Republican by nineteen percentage points (or a Democratic margin of negative nineteen points, according to the graph.)
This graph paints a slightly different picture of Democratic performances amongst whites. The adjustment makes Mr. Clinton and Mr. Obama look less impressive (Mr. Obama, especially), while making Mr. Humphrey look really good. To be fair, the 2008 election probably constitutes more of an outlier than the start of a trend for Democrats, given Mr. Obama’s unique strength amongst minorities. Expect the white “swing” to return to a more Kerryesque point in 2016.
Finally, one must note the degree to which the white vote is influenced by patterns in the South. Mr. Obama took less than 30% of the white vote in seven states: Alabama, Georgia, Louisiana, Mississippi, Oklahoma, South Carolina, and Texas. This low degree of white support is not unusual for Democrats. One-sided, racialized voting patterns in this region undoubtedly skew the overall white vote to be more Republican than would otherwise be the case.
P.S. For those interested, here is a table of the white vote over time, according to exit polls.

