June Elections Calendar

May was manna from heaven for elections junkies, with some truly exciting primary and special elections to watch. June is shaping up to be a pretty respectable sequel. We’ve identified as many noteworthy races as we can think of in the following chart, but if there’s anything we’re missing, please let us know in the comments!

Get ready to shake some action.

P.S. SSP’s complete primary calendar is available here.

CA-Gov, CA-Sen: Whitman, Fiorina Lead Primary, Trail in General

Greenberg Quinlan Rosner/American Viewpoint for the Los Angeles Times and University of Southern California (5/19-26, likely voters for primary, registered voters for general, 3/20-23 in parentheses):

Carly Fiorina (R): 38 (25)

Tom Campbell (R): 23 (29)

Chuck DeVore (R): 16 (9)

(MoE: ±4.5%)

Barbara Boxer (D-inc): 44

Carly Fiorina (R): 38

Barbara Boxer (D-inc): 38

Tom Campbell (R): 45

Barbara Boxer (D-inc): 46

Chuck DeVore (R): 36

(MoE: ±2.6%)

Meg Whitman (R): 53 (60)

Steve Poizner (R): 29 (20)

(MoE: ±4.5%)

Jerry Brown (D): 44 (41)

Meg Whitman (R): 38 (44)

Jerry Brown (D): 45 (53)

Steve Poizner (R): 31 (22)

(MoE: ±2.6%)

Here’s one more poll confirming the last-minute surge for Carly Fiorina in the GOP Senate primary, which seems to have advertising disparities at its root: trailing by 4 in the late March LA Times/USC poll, she’s now up by 15. The previous poll only tested “Generic Republican” in the primary, and today’s results show why that was kind of silly, given the very different candidate profiles: Tom Campbell beats Barbara Boxer while Fiorina loses (I don’t think any other poll has had such a Campbell/Fiorina disparity in the general, though, and PPP went the opposite direction the other week, where Fiorina performed the best against Boxer).

On the gubernatorial side, this poll is remarkably right in line with other recent polls showing Meg Whitman’s big lead in the primary (50-29 Pollster average today) and Jerry Brown’s smaller lead over Whitman in November (46-39 Pollster average today).

SSP Daily Digest: 5/31 (Morning Edition)

Even the mailman takes off today. But not SSP….

  • AR-Sen: Mitch Berry, the son of retiring Dem Rep. Marion Berry, is stepping up his fight against Bill Halter’s purported war on common sense. Berry’s PAC, Arkansans For Common Sense, just filed a $150,000 media buy against Halter, bringing their total expenditures in this race to nearly $350K. (J)
  • NV-Sen: Salon notes that hard-charging teabagger Sharron Angle has been handing out her own newspaper-style pamphlet at campaign events, titled “The Angle Examiner.” Underneath eye-grabbing headlines like “Reid Waterboarding the Economy” are photos of Angle in various action poses, including one in which she’s firing her .44 Magnum, which she calls her “Dirty Harry Hand Cannon.” Salon editorializes that “the breathless tone of its writing, and the very un-slick design, makes it seem like one more piece of evidence that Angle may not be quite ready for prime time.”
  • Ready or not, Angle is getting some big help in the closing days of her insurgent campaign. The Club for Growth filed a half-million dollar expenditure report with the FEC, the bulk of which is being spent on direct mail and attack ads hitting front-runner Sue Lowden. At the same time, the Tea Party Express has upped their media buys supporting Angle by another $50K. (J)

  • AZ-Gov: Get a load of this tyranny. GOP Gov. Jan Brewer says that she “has removed” state AG Terry Goddard, a Democrat running against her this fall, from defending the state against possible litigation by the federal Department of Justice surrounding the state’s “papers please” immigration law. Apparently, Brewer thinks that Goddard is “colluding” with the DoJ after learning that he met with DoJ lawyers shortly before they met with the governor’s legal advisors. This is a routine practice for Justice Department attorneys when considering legal action against a state, but Brewer will have none of it. Goddard, for his part, insists that he will be “definitely defending the state” in any challenges to the law. (J)
  • NY-Gov: Ex-Rep. Rick Lazio scored the Conservative Party’s endorsement, but he didn’t exactly do it in fine fashion. Chairman Mike Long pushed the party convention a week ahead of the GOP confab, in the hopes of pressuring the Republicans to nominate Lazio instead of recent ex-Dem Steve Levy. But this move ruffled quite a few feathers, it seems, and supporters of Levy and ultra-creepbag Carl Paladino conspired to also put Erie County Conservative chair Ralph Lorigo on the ballot as well. This means that if Lorigo sees it through, Lazio could face a contested primary for the Conservative line. That would mean two different primaries for two different parties with two different sets of opponents for Lazio at the same time! I also have to wonder whether Long will also face backlash over his continued meddling in NY-23 as well. Ah, the Republicans: They never miss an opportunity to miss an opportunity.
  • CA-36: Not taking any chances, Dem Rep. Jane Harman is out with an incendiary ad against her primary opponent, activist Marcy Winograd. The ad, which began airing on local cable stations and FIOS last Thursday, hits Winograd for wanting to “kill the defense budget” and to “destroy Israel.”  Kudos to the Politico’s Alex Isenstadt for inquiring about the size of the ad buy, but shame on the Harman campaign for declining to provide details. (J)
  • CA-42: Teabagging accountant Phil Liberatore pumped another $375K of his own cash into his race against GOP Rep. Gary Miller. Liberatore has now spent half a million trying to unseat Miller, who has spent “only” $337K. There are also a couple of Some Dudes in this race. The primary is June 8th.
  • FL-10: Even though the House ethics office cleared Bill Young in the PMA lobbying scandal back in February, a criminal investigation is apparently underway at the Justice Department. (You may recall that several lawmakers were accused of steering defense-related earmarks to PMA clients, in exchange for campaign donations.) Dem Charlie Justice seems to be overplaying his hand here (if he even has one), calling for Young to resign from office.
  • GA-09: Sure, anyone can file a lawsuit, but banks aren’t Orly Taitz, and they usually only sue debtors when they mean it. So it’s a bit startling to see that a local bank is suing Tom Graves, the leading candidate in the GA-09 runoff, to recover an unpaid $2.25 million business loan. They’re also accusing him of fraudulently transferring some property in order to frustrate the bank’s collection efforts. This sounds pretty serious, and could be a real game-changer. The second round of this special election is on June 8th, where Graves, a former state rep., faces Lee Hawkins, a former state senator. (Graves led 35-23 in the first round.)
  • ID-01: Walt Minnick just rolled out a list of 100 key supporters across his district, including a bunch of prominent Republican donors and elected officials, like some county commissioners and the former head of the National Cattleman’s Beef Association. Whoo-eee!
  • IL-10: Biden alert! The VPOTUS will do a fundraiser for Dan Seals on June 21st in Chicago.
  • NC-08: It’s always the sign of a successful campaign when the candidate starts threatening to sue members of his own party for defamation. That’s what SSP fave Tim D’Annunzio is doing, claiming that the state GOP chair is spreading lies about him. Oh, and he wants $5 million. God speed, little Timmy!
  • NY-01: Bill Clinton will be doing a $2,400-a-head fundraiser for Rep. Tim Bishop in Manhattan this Thursday, while Henry Kissinger will be doing the same for Republican Chris Cox. (Cox is the grandson of Richard Nixon, who of course was BFF with Kissinger back in the day.) P.S. Note to CQ-Roll Call: There is no “furor” about this dumb Sestak job non-story.
  • SC-02: GOP Rep. Joe Wilson raised an unbelievable amount of cash after his infamous State of the Union outburst, and he’s spending at an equally prodigious clip, too. Wilson’s pre-primary fundraising report, filed with the FEC, indicates that his campaign brought in $190,000 in a six-week period following the end of March, but he also spent over $450,000 out of his war chest, leaving him with under $1.9 million cash-on-hand. All told, Wilson has spent a whopping $2 million on his re-election campaign already, despite not facing any primary opposition. (J)
  • UT-02: Rep. Jim Matheson scored the backing of the 18,000-strong Utah Education Association teachers union. It so happens that his primary opponent, Claudia Wright, has been a teacher for 30 years.
  • NRCC: A good observation by Steve Benen, who points out that the NRCC has recently begun lowballing expectations. While Republicans had for months been acting as though they were sure to retake the House, NRCC recruitment chair Kevin McCarthy has reduced his oddly specific takeover from 45 to 37 – just short of what the GOP would need for the majority. Benen wonders if the NRCC is playing a deep game here, trying to goad supporters into giving their all, lest they become complacent. But in the wake of PA-12 and other embarrassments in primaries, maybe the Republicans really have dialed back their hopes a bit.
  • HI-01: Ed Case Drops Out

    I guess Ed Case doesn’t believe the DCCC’s polling was handed down on tablets at Mount Sinai either:

    Former Rep. Ed Case (D-Hawaii) announced Sunday he won’t pursue the Democratic nomination to face Rep. Charles Djou (R-Hawaii), which improves his party’s chances of retaking the seat it lost in the recent special election.

    “We’ve taken apart the results and analyzed our options every which way,” Case wrote in an email to supporters. “If it all lined up it’d be an easy decision, but it doesn’t.” …

    “My heart tells me to stay in this fight, but my head says this has become the wrong fight. So today I’m withdrawing my candidacy for the U. S. House of Representatives from Hawaii’s great first district,” he wrote.

    Case thanked his supporters and said he will continue to look for opportunities to serve.

    Case’s abrupt exit leaves Colleen Hanabusa as the sole Democratic flagbearer against freshly-minted GOP Rep. Charles Djou. At the very least, we’ll all be spared his antics in a Democratic primary, but I suppose the possibility remains that another Democrat may seek to enter the race now that Case’s exit has cleared up some more oxygen in the room.

    UPDATE: Let the Great Healing begin:

    Case made the announcement during his remarks at the state Democratic convention at the Hilton Hawaiian Village in Waikiki. State Senate President Colleen Hanabusa, his main rival in the primary, joined him on stage and presented Case with a lei. …

    “I thought it was the right thing to do, at the right time, for the right reasons,” he said. “That’s really what it came down to.”

    U.S. Sen. Daniel K. Inouye, (D-Hawaii), who had endorsed Hanabusa and resisted pressure from national Democrats to abandon her in favor of Case, who many in Washington believed was more electable, told delegates that he was deeply moved by Case’s gesture.

    “He showed that he was a Democrat,” Inouye said.

    Rasmussen Reports, You Decide, Vol. 19

    AL-Gov (5/25, likely voters, 3/29 in parens):

    Artur Davis (D): 33 (33)

    Bradley Byrne (R): 47 (50)

    Artur Davis (D): 39 (35)

    Tim James (R): 45 (49)

    Artur Davis (D): 40 (44)

    Roy Moore (R): 43 (40)

    Artur Davis (D): 33

    Robert Bentley (R): 46

    Ron Sparks (D): 32 (33)

    Bradley Byrne (R): 45 (43)

    Ron Sparks (D): 37 (34)

    Tim James (R): 42 (38)

    Ron Sparks (D): 40 (40)

    Roy Moore (R): 38 (35)

    Ron Sparks (D): 31

    Robert Bentley (R): 44

    (MoE: ±4.5%)

    AR-Gov (5/19, likely voters):

    Mike Beebe (D-inc): 53

    Jim Keet (R): 38

    (MoE: ±4.5%)

    CA-Gov (5/24, likely voters, 4/19 in parens):

    Jerry Brown (D): 45 (44)

    Meg Whitman (R): 41 (38)

    Jerry Brown (D): 43 (50)

    Steve Poizner (R): 42 (32)

    (MoE: ±4.5%)

    GA-Gov (5/20, likely voters, 4/22 in parens):

    Roy Barnes (D): 39 (43)

    John Oxendine (R): 43 (45)

    Roy Barnes (D): 40 (39)

    Nathan Deal (R): 47 (46)

    Roy Barnes (D): 39 (41)

    Karen Handel (R): 42 (42)

    Roy Barnes (D): 42 (42)

    Eric Johnson (R): 38 (37)

    Thurbert Baker (D): 29 (34)

    John Oxendine (R): 50 (44)

    Thurbert Baker (D): 30 (31)

    Nathan Deal (R): 47 (47)

    Thurbert Baker (D): 32 (36)

    Karen Handel (R): 43 (44)

    Thurbert Baker (D): 30 (35)

    Eric Johnson (R): 42 (38)

    (MoE: ±4.5%)

    GA-Sen (5/20, likely voters, 4/22 in parens):

    Michael Thurmond (D): 30 (35)

    Johnny Isakson (R): 57 (51)

    (MoE: ±4.5%)

    MN-Gov (5/24, likely voters, 3/10 in parens):

    Mark Dayton (D): 35 (38)

    Tom Emmer (R): 37 (35)

    Tom Horner (I): 12 (7)

    Margaret Anderson Kelliher (D): 36 (34)

    Tom Emmer (R): 38 (37)

    Tom Horner (I): 11 (10)

    Matt Entenza (D): 34 (28)

    Tom Emmer (R): 37 (37)

    Tom Horner (I): 12 (8)

    (MoE: ±4.5%)

    ND-Sen (5/18-19, likely voters, 4/20 in parens):

    Tracy Potter (D): 23 (24)

    John Hoeven (R): 72 (69)

    (MoE: ±4.5%)

    NM-Gov (5/25, likely voters, 3/24 in parens):

    Diane Denish (D): 43 (51)

    Susana Martinez (R): 42 (32)

    Diane Denish (D): 47 (52)

    Pete Domenici Jr. (R): 30 (35)

    Diane Denish (D): 45 (45)

    Allen Weh (R): 39 (35)

    Diane Denish (D): 45 (52)

    Janice Arnold-Jones (R): 31 (30)

    Diane Denish (D): 47 (43)

    Doug Turner (R): 31 (34)

    (MoE: ±4.5%)

    OR-Sen (5/24, likely voters):

    Ron Wyden (D-inc): 51

    Jim Huffman (R): 38

    (MoE: ±4.5%)

    OR-Gov (5/24, likely voters, 4/26 in parens):

    John Kitzhaber (D): 44 (41)

    Chris Dudley (R): 45 (41)

    (MoE: ±4.5%)

    WA-Sen (5/26, likely voters, 5/4 in parens):

    Patty Murray (D-inc): 48 (48)

    Dino Rossi (R): 47 (46)

    Patty Murray (D-inc): 50 (52)

    Don Benton (R): 35 (38)

    Patty Murray (D-inc): 47 (51)

    Clint Didier (R): 37 (36)

    Patty Murray (D-inc): 47 (49)

    Paul Akers (R): 32 (35)

    (MoE: ±4.5%)

    WI-Gov (5/25, likely voters, 4/20 in parens):

    Tom Barrett (D): 41 (44)

    Scott Walker (R): 48 (46)

    Tom Barrett (D): 42 (46)

    Mark Neumann (R): 44 (46)

    (MoE: ±4.5%)

    WI-Sen (5/25, likely voters, 4/20 in parens):

    Russ Feingold (D-inc): 46

    Ron Johnson (R): 44

    Russ Feingold (D-inc): 47

    Dave Westlake (R): 38

    (MoE: ±4.5%)

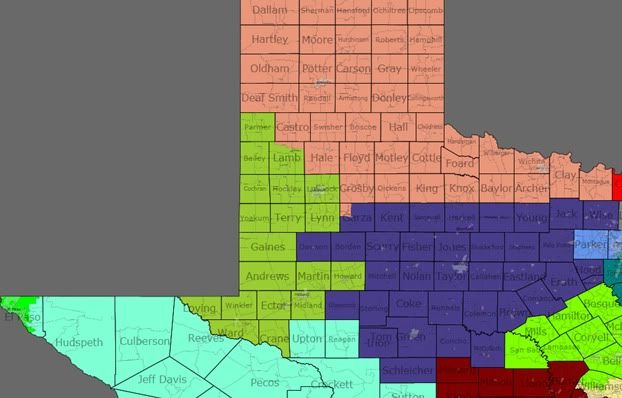
    What if the 2003 Texas redistricting had never happened?

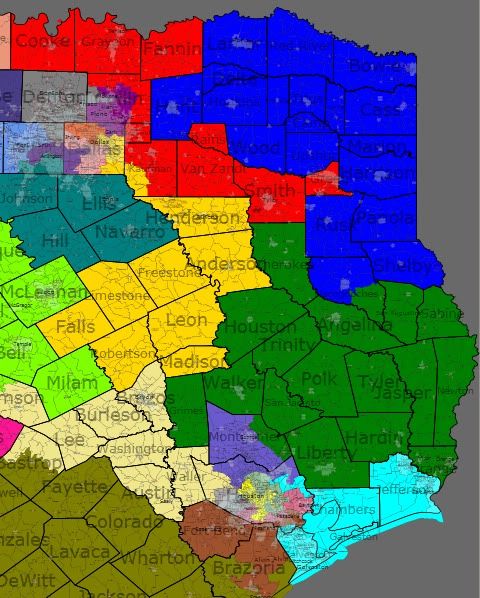
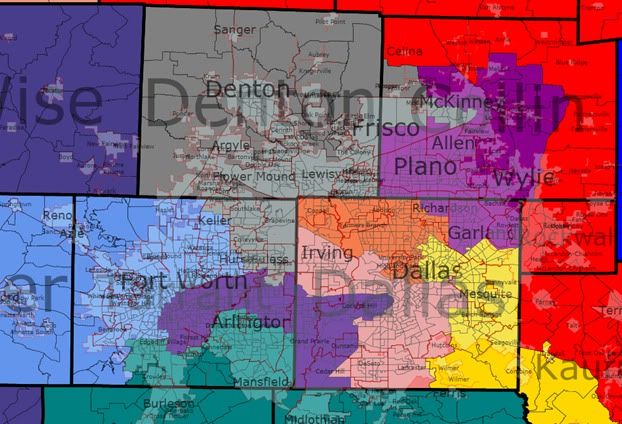
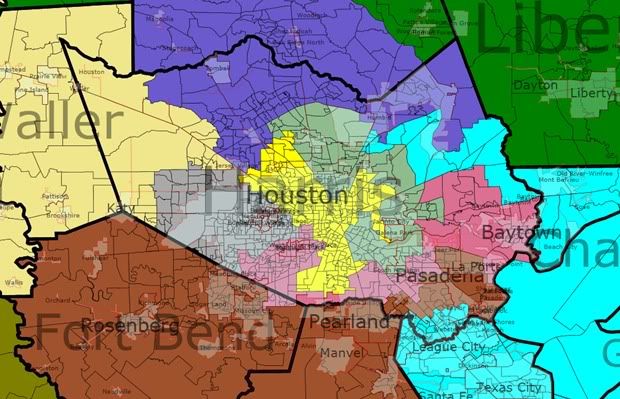
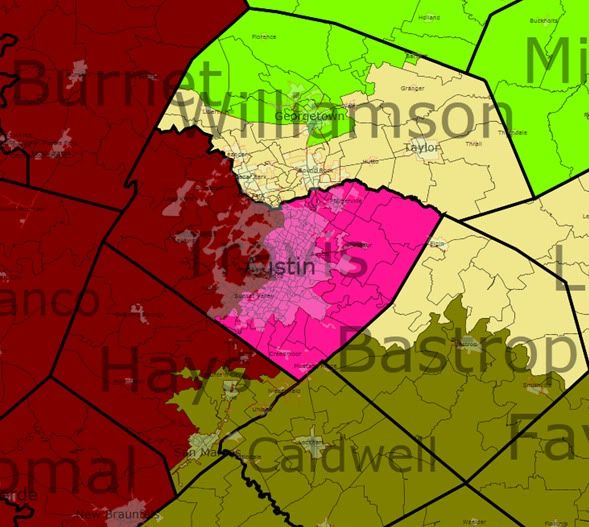
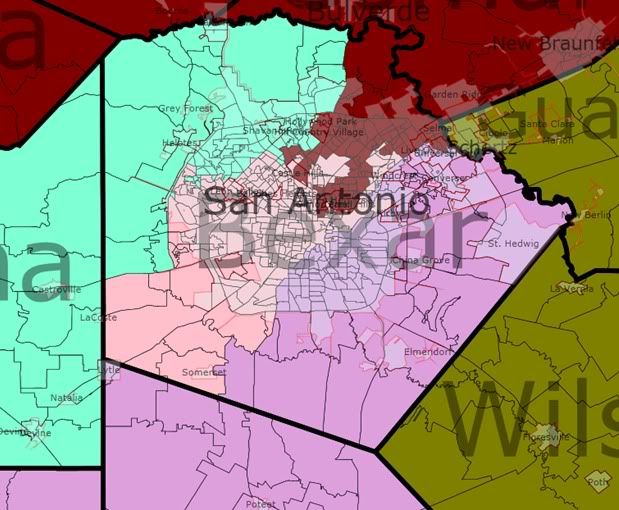
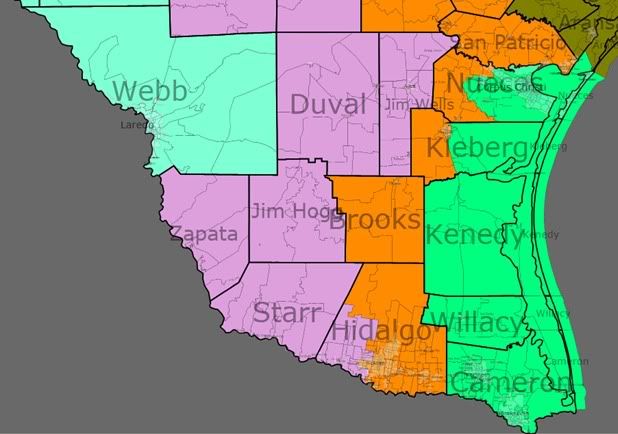
    This diary takes a look at what might have happened if the 2003 Texas redistricting had never occurred. I compared the 2000 demographics and presidential results for the map used in the 2002 elections with the 2008 demographics and presidential results under the same lines. I used Dave’s App to do this, with the Test Data setting to get the political data, but the regular voting district map (without the Test Data setting) to get the correct demographic estimates. I also looked at the shifts for the districts during this time period and elaborated a bit on what might have occurred had this map remained in place for the rest of the decade. Please vote in the survey at the end as well. Thanks and enjoy!

    Statewide Map
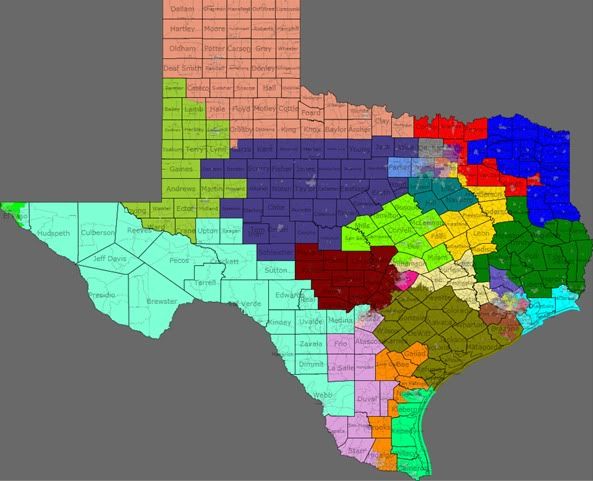
    Photobucket

    East Texas

    Photobucket

    District 1 (Blue); Northeast Texas-Texarkana, Paris, Greenville, Nacogdoches, Marshall

    2002 winner and winning percentage: Max Sandlin (D), 56%

    % white % black % Hispanic % Asian Total district population
    2000 population 75 16 7 0 651,619
    2008 population (est.) 72 15 11 1 683,417
    Change from 2000 to 2008 -3 -1 +4 +1 +31,798
    2000 presidential results 2008 presidential results Partisan swing from 2000 to 2008
    64% Bush-36% Gore 69% McCain-30% Obama +5% Republican, -6% Democratic

    District 2 (Green): East Texas-Lufkin, Orange, Huntsville, Liberty

    2002 winner and winning percentage: Jim Turner (D), 61%

    % white % black % Hispanic % Asian Total district population
    2000 population 76 14 9 0 651,619
    2008 population (est.) 73 13 12 1 683,417
    Change from 2000 to 2008 -3 -1 +3 +1 +37,712
    2000 presidential results 2008 presidential results Partisan swing from 2000 to 2008
    63% Bush-37% Gore 70% McCain-29% Obama +7% Republican, -8% Democratic

    District 4 (Red): North and East Texas-Longview, Tyler, Sherman

    2002 winner and winning percentage: Ralph Hall (D), 58%

    % white % black % Hispanic % Asian Total district population
    2000 population 77 12 9 1 651,620
    2008 population (est.) 72 11 14 1 773,426
    Change from 2000 to 2008 -5 -1 +5 0 +121,806
    2000 presidential results 2008 presidential results Partisan swing from 2000 to 2008
    70% Bush-30% Gore 70% McCain-29% Obama 0% Republican, -1% Democratic

    District 9 (Light Blue): East Texas and Harris County-Beaumont, Port Arthur, Galveston, Texas City

    2002 winner and winning percentage: Nick Lampson (D), 59%

    % white % black % Hispanic % Asian Total district population
    2000 population 60 21 14 3 651,619
    2008 population (est.) 56 21 19 3 675,944
    Change from 2000 to 2008 -4 0 +5 0 +24,325
    2000 presidential results 2008 presidential results Partisan swing from 2000 to 2008
    55% Bush-45% Gore 56% McCain-43% Obama +1% Republican, -2% Democratic

    Dallas/Fort Worth Area

    Photobucket

    District 3 (Purple):Collin County and northern Dallas County-Richardson, Garland, Plano, McKinney

    2002 winner and winning percentage: Sam Johnson (R), 74%

    % white % black % Hispanic % Asian Total district population
    2000 population 70 7 14 7 651,620
    2008 population (est.) 61 9 18 10 898,778
    Change from 2000 to 2008 -9 +2 +4 +3 +247,158
    2000 presidential results 2008 presidential results Partisan swing from 2000 to 2008
    72% Bush-28% Gore 60% McCain-39% Obama -12% Republican, +11% Democratic

    District 5 (Yellow): Dallas County and Central/East Texas-Dallas, Mesquite, Palestine, Athens

    2002 winner and winning percentage: Jeb Hensarling (R), 58%

    % white % black % Hispanic % Asian Total district population
    2000 population 63 16 18 2 651,620
    2008 population (est.) 56 17 23 2 677,043
    Change from 2000 to 2008 -7 +1 +5 0 +25,423
    2000 presidential results 2008 presidential results Partisan swing from 2000 to 2008
    62% Bush-38% Gore 57% McCain-42% Obama -5% Republican, +4% Democratic

    District 6 (Dark Teal): Tarrant County and Dallas/Fort Worth suburbs and exurbs: Arlington, Ennis, Cleburne, Corsicana

    2002 winner and winning percentage: Joe Barton (R), 70%

    % white % black % Hispanic % Asian Total district population
    2000 population 72 10 14 3 651,620
    2008 population (est.) 67 11 18 3 748,734
    Change from 2000 to 2008 -5 +1 +4 0 +97,114
    2000 presidential results 2008 presidential results Partisan swing from 2000 to 2008
    67% Bush-33% Gore 61% McCain-38% Obama -6% Republican, +5% Democratic

    District 12 (Periwinkle): Tarrant and Parker Counties-Weatherford, Fort Worth, Keller

    2002 winner and winning percentage: Kay Granger (R), 92%

    % white % black % Hispanic % Asian Total district population
    2000 population 71 5 20 2 651,619
    2008 population (est.) 64 5 26 3 788,643
    Change from 2000 to 2008 -7 0 +6 +1 +137,024
    2000 presidential results 2008 presidential results Partisan swing from 2000 to 2008
    67% Bush-33% Gore 65% McCain-34% Obama -2% Republican, +1% Democratic

    District 24 (Dark Purple): Dallas and Tarrant Counties-Fort Worth, Arlington, Dallas, Duncanville

    2002 winner and winning percentage: Martin Frost (D), 65%

    % white % black % Hispanic % Asian Total district population
    2000 population 35 22 38 3 651,619
    2008 population (est.) 28 22 45 4 836,571
    Change from 2000 to 2008 -7 0 +7 +1 +184,952
    2000 presidential results 2008 presidential results Partisan swing from 2000 to 2008
    46% Bush-54% Gore 36% McCain-63% Obama -10% Republican, +9% Democratic

    District 26 (Dark Gray): Denton, Tarrant, and Collin Counties-Denton, Lewisville, Flower Mound, McKinney

    2002 winner and winning percentage: Michael Burgess (R), 75%

    % white % black % Hispanic % Asian Total district population
    2000 population 78 5 11 4 651,619
    2008 population (est.) 70 7 16 6 897,454
    Change from 2000 to 2008 -8 +2 +5 +2 +245,835
    2000 presidential results 2008 presidential results Partisan swing from 2000 to 2008
    73% Bush-27% Gore 63% McCain-36% Obama -10% Republican, +9% Democratic

    District 30 (Salmon): Dallas County: Dallas, Irving

    2002 winner and winning percentage: Eddie Bernice Johnson (D), 74%

    % white % black % Hispanic % Asian Total district population
    2000 population 25 41 31 2 651,620
    2008 population (est.) 19 39 39 2 726,340
    Change from 2000 to 2008 -6 -2 +8 0 +74,720
    2000 presidential results 2008 presidential results Partisan swing from 2000 to 2008
    31% Bush-69% Gore 21% McCain-78% Obama -10% Republican, +9% Democratic

    District 32 (Burnt Orange): Dallas County-Dallas, Farmer’s Branch, University/Highland Park, Irving

    2002 winner and winning percentage: Pete Sessions (R), 68%

    % white % black % Hispanic % Asian Total district population
    2000 population 55 9 27 6 651,619
    2008 population (est.) 44 9 38 7 703,588
    Change from 2000 to 2008 -11 0 +11 +1 +51,969
    2000 presidential results 2008 presidential results Partisan swing from 2000 to 2008
    65% Bush-35% Gore 53% McCain-46% Obama -12% Republican, +13% Democratic

    Houston Area

    Photobucket

    District 7 (Gray): Harris County-western Houston, the Villages

    2002 winner and winning percentage: John Culberson (R), 89%

    % white % black % Hispanic % Asian Total district population
    2000 population 50 11 26 11 651,620
    2008 population (est.) 43 11 32 12 746,517
    Change from 2000 to 2008 -7 0 +6 +1 +94,897
    2000 presidential results 2008 presidential results Partisan swing from 2000 to 2008
    68% Bush-32% Gore 55% McCain-44% Obama -13% Republican, +12% Democratic

    District 8 (Dark Lavender): Harris and Montgomery Counties-Jersey Village, Humble, Conroe

    2002 winner and winning percentage: Kevin Brady (R), 93%

    % white % black % Hispanic % Asian Total district population
    2000 population 77 5 13 3 651,619
    2008 population (est.) 71 6 18 4 846,293
    Change from 2000 to 2008 -6 +1 +5 +1 +194,674
    2000 presidential results 2008 presidential results Partisan swing from 2000 to 2008
    78% Bush-22% Gore 71% McCain-28% Obama -7% Republican, +6% Democratic

    District 18 (Banana Yellow): Harris County-Houston

    2002 winner and winning percentage: Sheila Jackson-Lee (D), 77%

    % white % black % Hispanic % Asian Total district population
    2000 population 21 42 33 3 651,620
    2008 population (est.) 18 41 38 3 779,948
    Change from 2000 to 2008 -3 -1 +5 0 +128,328
    2000 presidential results 2008 presidential results Partisan swing from 2000 to 2008
    26% Bush-74% Gore 22% McCain-77% Obama -4% Republican, +3% Democratic

    District 22 (Brown): Fort Bend, Brazoria, and Harris Counties-Rosenberg, Sugarland, Pearland, Pasadena

    2002 winner and winning percentage: Tom DeLay (R), 63%

    % white % black % Hispanic % Asian Total district population
    2000 population 60 10 20 8 651,619
    2008 population (est.) 52 12 23 12 866,297
    Change from 2000 to 2008 -8 +2 +3 +4 +214,678
    2000 presidential results 2008 presidential results Partisan swing from 2000 to 2008
    68% Bush-32% Gore 59% McCain-40% Obama -9% Republican, +8% Democratic

    District 25 (Dark Pink): Fort Bend and Harris Counties-Houston, Belaire, University Place, South Houston, Baytown

    2002 winner and winning percentage: Chris Bell (D), 55%

    % white % black % Hispanic % Asian Total district population
    2000 population 37 23 34 5 651,619
    2008 population (est.) 32 22 40 5 683,417
    Change from 2000 to 2008 -5 -1 +6 0 +156,401
    2000 presidential results 2008 presidential results Partisan swing from 2000 to 2008
    48% Bush-52% Gore 41% McCain-59% Obama -7% Republican, +7% Democratic

    District 29 (Grayish Green): Harris County-Houston, Jacinto City, Galena Park, South Houston

    2002 winner and winning percentage: Gene Green (D), 95%

    % white % black % Hispanic % Asian Total district population
    2000 population 20 15 62 2 651,620
    2008 population (est.) 16 13 68 2 825,305
    Change from 2000 to 2008 -4 -2 +6 0 +173,685
    2000 presidential results 2008 presidential results Partisan swing from 2000 to 2008
    39% Bush-61% Gore 31% McCain-69% Obama -8% Republican, +8% Democratic

    Central Texas

    Photobucket

    District 10 (Magenta): Travis County-Austin

    2002 winner and winning percentage: Lloyd Doggett (D), 84%

    % white % black % Hispanic % Asian Total district population
    2000 population 50 11 33 4 651,619
    2008 population (est.) 45 10 38 5 809,987
    Change from 2000 to 2008 -5 -1 +5 +1 +158,368
    2000 presidential results 2008 presidential results Partisan swing from 2000 to 2008
    47% Bush-53% Gore 28% McCain-70% Obama -19% Republican, +17% Democratic

    District 11 (Lime Green): Central Texas-Waco, Georgetown, Temple, Killeen

    2002 winner and winning percentage: Chet Edwards (D), 52%

    % white % black % Hispanic % Asian Total district population
    2000 population 64 15 16 2 651,620
    2008 population (est.) 61 15 20 2 742,620
    Change from 2000 to 2008 -3 0 +4 0 +91,000
    2000 presidential results 2008 presidential results Partisan swing from 2000 to 2008
    67% Bush-33% Gore 61% McCain-38% Obama -6% Republican, +5% Democratic

    District 14 (Bronze): Texas Hill Country and Texas Coastline-Victoria, San Marcos, Calhoun, Seguin

    2002 winner and winning percentage: Ron Paul (R), 68%

    % white % black % Hispanic % Asian Total district population
    2000 population 58 8 32 1 651,620
    2008 population (est.) 54 8 35 1 751,893
    Change from 2000 to 2008 -4 0 +3 0 +100,273
    2000 presidential results 2008 presidential results Partisan swing from 2000 to 2008
    66% Bush-34% Gore 62% McCain-37% Obama -4% Republican, +3% Democratic

    District 21 (Maroon): Central/West Texas-San Antonio, Austin, New Braunfels

    2002 winner and winning percentage: Lamar Smith (R), 73%

    % white % black % Hispanic % Asian Total district population
    2000 population 77 2 17 2 651,619
    2008 population (est.) 74 2 20 3 779,551
    Change from 2000 to 2008 -3 0 +3 +1 +127,932
    2000 presidential results 2008 presidential results Partisan swing from 2000 to 2008
    73% Bush-27% Gore 62% McCain-37% Obama -11% Republican, +10% Democratic

    District 31 (Beige): Central Texas and Houston suburbs/exurbs: Round Rock, Bryan, Sealy, Katy

    2002 winner and winning percentage: John Carter (R), 69%

    % white % black % Hispanic % Asian Total district population
    2000 population 69 9 17 3 651,620
    2008 population (est.) 64 9 21 4 780,639
    Change from 2000 to 2008 -5 0 +4 +1 +129,019
    2000 presidential results 2008 presidential results Partisan swing from 2000 to 2008
    72% Bush-28% Gore 60% McCain-38% Obama -12% Republican, +10% Democratic

    West Texas

    Photobucket

    District 13 (Tan): West Texas-Wichita Falls, Amarillo

    2002 winner and winning percentage: Mac Thornberry (R), 79%

    % white % black % Hispanic % Asian Total district population
    2000 population 70 6 22 1 651,619
    2008 population (est.) 65 6 26 1 654,677
    Change from 2000 to 2008 -5 0 +4 0 +3,058
    2000 presidential results 2008 presidential results Partisan swing from 2000 to 2008
    75% Bush-25% Gore 76% McCain-23% Obama +1% Republican, -2% Democratic

    District 16 (Bright Green): El Paso County: El Paso

    2002 winner and winning percentage: Silvestre Reyes (D), unopposed

    % white % black % Hispanic % Asian Total district population
    2000 population 17 3 78 1 651,619
    2008 population (est.) 14 3 81 1 683,417
    Change from 2000 to 2008 -3 0 +3 0 +59,428
    2000 presidential results 2008 presidential results Partisan swing from 2000 to 2008
    41% Bush-59% Gore 33% McCain-66% Obama -8% Republican, +7% Democratic

    District 17 (Iris): West Texas: Abilene, San Angelo

    2002 winner and winning percentage: Charlie Stenholm (D), 51%

    % white % black % Hispanic % Asian Total district population
    2000 population 75 4 20 1 651,619
    2008 population (est.) 71 4 23 1 683,417
    Change from 2000 to 2008 -4 0 +3 0 +16,986
    2000 presidential results 2008 presidential results Partisan swing from 2000 to 2008
    72% Bush-28% Gore 75% McCain-24% Obama +3% Republican, -4% Democratic

    District 19 (Pea Green): West Texas-Lubbock, Big Spring, Midland, Odessa

    2002 winner and winning percentage: Larry Combest (R), 92%

    2003 special election winner and winning percentage: Randy Neugebauer (R), 51%

    % white % black % Hispanic % Asian Total district population
    2000 population 58 6 34 1 651,619
    2008 population (est.) 53 6 39 1 689,654
    Change from 2000 to 2008 -5 0 +5 0 +38,035
    2000 presidential results 2008 presidential results Partisan swing from 2000 to 2008
    76% Bush-24% Gore 73% McCain-27% Obama -3% Republican, +3% Democratic

    San Antonio and South Texas

    Photobucket

    Photobucket

    District 15 (Tangerine): South Texas- McAllen, Kingsville

    2002 winner and winning percentage: Ruben Hinojosa (D), unopposed

    % white % black % Hispanic % Asian Total district population
    2000 population 17 3 78 1 651,619
    2008 population (est.) 14 3 81 1 711,047
    Change from 2000 to 2008 -3 0 +3 0 +59,428
    2000 presidential results 2008 presidential results Partisan swing from 2000 to 2008
    41% Bush-59% Gore 33% McCain-66% Obama -8% Republican, +7% Democratic

    District 20 (Light Pink): Bexar County-San Antonio

    2002 winner and winning percentage: Charlie Gonzalez, unopposed

    % white % black % Hispanic % Asian Total district population
    2000 population 24 5 68 1 651,619
    2008 population (est.) 21 5 71 2 776,861
    Change from 2000 to 2008 -3 0 +3 +1 +125,242
    2000 presidential results 2008 presidential results Partisan swing from 2000 to 2008
    43% Bush-57% Gore 36% McCain-63% Obama -7% Republican, +6% Democratic

    District 23 (Light Blue): West and South Texas: El Paso, Eagle Pass, Laredo, San Antonio

    2002 winner and winning percentage: Henry Bonilla (R), 52%

    % white % black % Hispanic % Asian Total district population
    2000 population 30 1 67 1 651,619
    2008 population (est.) 27 1 69 1 728,212
    Change from 2000 to 2008 -3 0 +2 0 +76,593
    2000 presidential results 2008 presidential results Partisan swing from 2000 to 2008
    59% Bush-41% Gore 50% McCain-49% Obama -9% Republican, +8% Democratic

    District 27 (Spring Green): South Texas-Corpus Christi, Harlingen, Brownsville

    2002 winner and winning percentage: Solomon Ortiz, 61%

    % white % black % Hispanic % Asian Total district population
    2000 population 25 2 72 1 651,619
    2008 population (est.) 21 2 75 1 717,846
    Change from 2000 to 2008 -4 0 +3 0 +66,227
    2000 presidential results 2008 presidential results Partisan swing from 2000 to 2008
    49% Bush-51% Gore 43% McCain-56% Obama -6% Republican, +5% Democratic

    District 28 (Rose): South Texas and Bexar County: San Antonio, McAllen

    2002 winner and winning percentage: Ciro Rodriguez (D), 71%

    % white % black % Hispanic % Asian Total district population
    2000 population 21 8 70 1 651,620
    2008 population (est.) 19 7 72 1 761,316
    Change from 2000 to 2008 -2 -1 +2 0 +109,696
    2000 presidential results 2008 presidential results Partisan swing from 2000 to 2008
    41% Bush-59% Gore 36% McCain-63% Obama -5% Republican, +4% Democratic

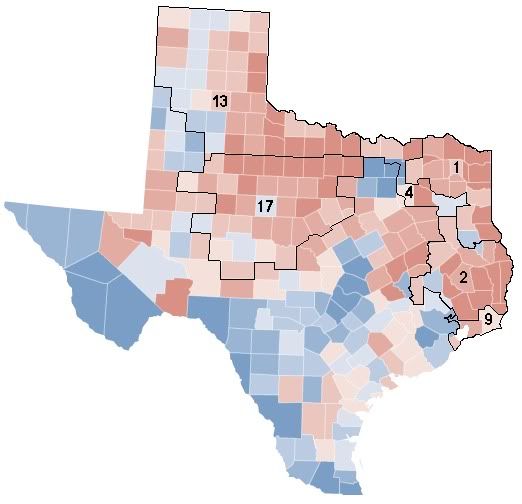
    So what would have happened in the past three elections had this map stayed in place for the rest of the decade? Often people assume that the Anglo Democratic incumbents who were targeted would have been reelected had the redistricting not occurred. This is definitely true in the case of Martin Frost, Lloyd Doggett, and Chris Bell, whose already Democratic and urban districts have shifted even more to the left since 2000. But the other Anglo Democrats largely came from more rural, Republican-leaning areas, and their districts all went for Bush in 2000. This list includes Max Sandlin, Jim Turner, Ralph Hall, Nick Lampson, Chet Edwards, and Charles Stenholm. Now let’s look at a county map of Texas showing the change between 2000 and 2008, with the congressional districts where Gore outperformed Obama superimposed over the map.
    Photobucket

    Despite a roughly 4% move towards the Democrats statewide between 2000 and 2008, there were 6 congressional districts where Obama  actually did worse than Gore: TX-01 (Max Sandlin (D)), TX-02 (Jim Turner (D)), TX-04 (Ralph Hall (D)), TX-09 (Nick Lampson (D)), TX-13 (Mac Thornberry (R)), and TX-17 (Charlie Stenholm (D)). Besides TX-13, all of these districts elected Democrats in 2002. In addition, all of the Anglo Democrats elected in districts that Bush won in 2000 saw their districts become more Republican over time, with one exception. TX-11 in Central Texas would have become notably more Democratic during this time period, and  its representative, Chet Edwards, is the only one of these men still in office as a Democrat.

    However, I am not convinced that the marked rightward shift would have occurred inevitably had the boundaries not changed in the 2003 redistricting. Many residents in these districts were trending Republican at the presidential level, but felt comfortable continuing to vote for Democrats at the congressional level. But in 2004, the redrawn districts included areas that had previously been represented by Republicans or by other targeted Democratic members, meaning the advantage of incumbency was greatly diminished. This led to the defeat, party switching, or retirement of all the legislators listed above, but I believe, also contributed to these areas becoming more Republican at the presidential level in 2004 and 2008. Without the option to vote for a familiar incumbent Democrat for Congress further down the ballot, voters felt less inclined to vote for a Democrat at any level, including President. Had the 2003 redistricting not occurred, I believe not only that several of these lawmakers might still be in office, but Obama may have even performed better in these districts in 2008.

    Other than the representatives just discussed, I believe that all of the other Democratic and Republican incumbents would still be in office right now, with the possible exceptions of John Culberson (R, 7th) and Henry Bonilla (R, 23rd), whose districts would have become much more competitive by the end of the decade. But I think this analysis shows that in the long-term, Texas is turning blue, and it is only a matter of time before the shifts to the Democrats in the Houston area, the Dallas/Forth Worth Area, and Central Texas finally push Texas into the Democratic column.

    By what margin will Bob Shamansky win?

    View Results

    Loading ... Loading ...

    NV-Sen: Lowden Fading in Primary, General

    Mason-Dixon for the Las Vegas Review-Journal (5/24-26, likely voters, 5/10-11 in parens):

    Sue Lowden (R): 30 (30)

    Sharron Angle (R): 29 (25)

    Danny Tarkanian (R): 23 (22)

    Other: 7 (5)

    None: 3 (n/a)

    Undecided: 8 (18)

    (MoE: ±4%)

    Get a load of that trend line for ex-Assemblywoman Sharron Angle, who was mostly a footnote in this race until Lowden started to implode with her poultry obsession. Still, I have to wonder if Lowden and Angle will go nuclear on each other in the remaining week and a half, potentially giving ex-SoS candidate Danny Tarkanian a chance to pull an Alice Kryzan-style victory.

    Meanwhile, here are the general election numbers (4/13-14 in parens, 4/5-7 in brackets, 2/22-24 in italicized brackets):

    Harry Reid (D-inc): 39 (37)

    Sue Lowden (R): 42 (47)

    Other: 3 (5)

    None: 6 (3)

    Undecided: 10 (8)

    Harry Reid (D-inc): 42 [42]

    Sharron Angle (R): 39 [44]

    Other: 5 [n/a]

    None: 4 [n/a]

    Undecided: 10 [14]

    Harry Reid (D-inc): 41 [39]

    Danny Tarkanian (R): 42 [39]

    Other: 4 [11]

    None: 3 [n/a]

    Undecided: 10 [11]

    (MoE: ±4%)

    The trend lines are an absolute mess. It seems that the LVRJ has not exactly been consistent in including the three major Republicans against Reid in each round of their polling. They haven’t tested Angle in a general election poll since February, and only went with Lowden in their mid-April poll.

    Still, it does show that Reid may have a ghost of a chance, particularly against Angle, who seems like a treasure trove for opposition researchers. But whether it’s Angle or Lowden, his best hope may be to push as many voters as possible into the “none of the above” camp — which, as you know, is an actual ballot choice in Nevada.

    SSP Daily Digest: 5/28 (Afternoon Edition)

    CA-Sen: For a brief shining moment there, Tom Campbell had some good news: in the April 1-May 19 reporting period, Campbell actually outraised Carly Fiorina from outside donors. Campbell pulled in $990K while Fiorina got $909K. Fiorina’s response? She wrote herself another seven-figure check.

    FL-Sen: Charlie Crist’s 7-word-long Google ad attacking Jeff Greene (almost haiku-like in its simplicity: “What has Jeff Greene done? Experience matters.”) prompted a 300-word press release from the Greene camp landing some solid hits on Crist.

    KY-Sen: In terms of rocking the political boat, this probably isn’t as eye-opening as his comments about the Civil Rights Act or the NAFTA Superhighway, but it’s one more weird, sketchy act by Rand Paul: in 1999, he created a whole new certifying body for ophthalmologists, the National Board of Ophthalmology, in order to compete with the establishment American Board of Ophthalmology. The NBO has looser certification requirements than the ABO.

    NH-Sen (pdf): Republican pollster Magellan has been really active lately in GOP primaries where they don’t have any skin in the game; they’re back to looking at the New Hampshire Senate race. They find the real race here between Kelly Ayotte, at 38, and Bill Binnie, at 29. Ovide Lamontagne is lagging at 9, with Jim Bender at 4.

    OH-Sen, OH-Gov (pdf): The Ohio Poll, conducted by the University of Cincinnati, is out today with pleasant results for Democrats (perhaps doubly so, considering they have a reputation for producing GOP-leaning results). They find Dem Lee Fisher with a one-point lead over GOPer Rob Portman in the Senate race, 47-46. They also find incumbent Dem Ted Strickland looking OK in the gubernatorial race, leading John Kasich 49-44 (and sporting a surprisingly high 55/35 approval, suggesting that whatever he’s been doing lately has been working).

    FL-Gov: Ad wars are reaching a fever pitch in the GOP primary in the Florida gubernatorial race; Rick Scott placed a sixth major media buy for another $2.9 million, taking his total to $10.9 million. We’ve also found out more about that mystery group that’s planning to spend nearly a million hitting Scott (primarily on the issue of the fraud charges against his company): it’s the Alliance for America’s Future. While it’s not clear what their interest in Bill McCollum is, the group is headed by Mary Cheney (daughter of Dick).

    HI-Gov: After many months of operating in running-but-not-running limbo, Honolulu mayor Mufi Hannemann made it official yesterday: he’ll run in the Democratic gubernatorial primary against ex-Rep. Neil Abercrombie.

    NM-Gov: Former state GOP chair Allen Weh, who’s turned into the main GOP primary opposition to Susana Martinez by virtue of his money, just loaned himself another $600K for the home stretch, on top of $1 million he’s already contributed. Lt. Gov. Diane Denish is unopposed in the Dem primary, but watching Martinez catch up to her in polls of the general, has launched into a fundraising frenzy as of late; she’s raised $464K from donors in the last three weeks.

    SC-Gov (pdf): Two different polls are out in South Carolina: one, from Insider Advantage, continues the trend of giving an advantage to Nikki Haley (and the survey period was May 25, after the current imbroglio broke). Haley is at 31, Andre Bauer at 21, Gresham Barrett at 14, and Henry McMaster at 13. On the Dem side, Vince Sheheen leads at 26, with Jim Rex at 17 and Robert Ford at 12. SCIndex didn’t look at the primaries, but had some rather heartening numbers for November: Generic Republican leads Generic Dem only 46-44 in the gubernatorial race, while in the Senate race, Jim DeMint leads Democratic challenge Vic Rawl only 50-43.

    IN-03: Mitch Daniels made it official today, setting the date for the special election to replace resigned Mark Souder on Nov. 2, at the same time as the general election. (So the special election’s winner will only serve during the House’s lame duck session.) The state GOP will pick its candidates for both elections at a June 12 caucus; presumably, they’ll choose the same person for both.

    MO-08: Where’s the New York Times when you need them? Rep. Jo Ann Emerson just lied big-time about her Dem opponent Tommy Sowers’ military record, saying that her opposition to DADT repeal was based on talking to actual commanders, as opposed to Sowers, who “never commanded anybody.” Um, yeah… except for that platoon of combat engineers that Sowers led in Kosovo.

    MS-01: Wow, even Mississippi Dems are now taking a page from the Gray Davis playbook. A Dem 527 called “Citizens for Security and Strength” is hitting presumed Republican frontrunner state Sen. Alan Nunnelee prior to the primary as a “hypocrite on taxes.” Apparently they too are sensing some late-game momentum by Henry Ross, a teabagger whom they’d much rather Travis Childers face in the general than financially-flush establishment figure Nunnelee, and would like to facilitate a Ross victory (or at least a runoff).

    NC-08: Thinking that Barack Obama is a Kenyan secret Muslim? Check. Wanting to repeal the 17th Amendment? Great! Thinking that there’s a 1,000-foot-high pyramid in Greenland? Sorry, that’s a fridge too far even for the teabaggers of North Carolina. Six leaders among the local Tea Partiers publicly switched their allegiances to Harold Johnson in the runoff in the 8th, following revelations of just how off-the-rails their one-time fave Tim d’Annunzio is.

    NY-23: Determined to relive the NY-23 special election over and over again, the Concerned Women of America are sticking with their endorsement of Doug Hoffman, who seems on track to pick up the Conservative Party line while the GOP line goes elsewhere (like Matt Doheny, most likely).

    Votes: The repeal of Don’t Ask Don’t Tell cleared the House by a 234-194 margin yesterday, with 5 GOPers voting yes and 26 Dems voting no. The GOP ‘ayes’ were Judy Biggert, Joe Cao, Charles Djou (in his first week of work), Ron Paul, and Ileana Ros-Lehtinen. Dem no votes were — no surprise — mostly vulnerable members in culturally conservative areas: Berry, Bishop (GA), Boucher, Bright, Carney, Childers, Costello, Critz, Davis (TN), Donnelly, Edwards (TX), Etheridge, Green (TX), Lipinski, Marshall, McIntyre, Ortiz,  Peterson, Pomeroy, Rahall, Ross, Shuler, Skelton, Spratt, Tanner, and Taylor.

    Polltopia: Somebody must have slipped some Red Bull into Nate Silver’s Ovaltine lately, as he’s just landed his third hard hit on Rasmussen in as many days. Today, it’s their Wisconsin Senate race poll showing the unknown Ron Johnson competitive (and known by 68% of likely voters) that’s drawing Nate’s ire.