StochasticDemocracy: Post mortem- most accurate House predictions

This is a diary by Stochastic Democracy, evaluating our final forecasts for the 2010 House of Representative Elections and comparing our predictions to those of other forecasters. Cross-posted at DKos, where you can find the pretty version of the post– SSP doesn’t buy all the HTML code. EDIT: Okay, DKos doesn’t buy it either, check out the StochasticDemocracy frontpage for the good style.DailyKos post.

While there are still a couple of uncalled districts out there, enough returns have come in to start looking at the results and how the model did:

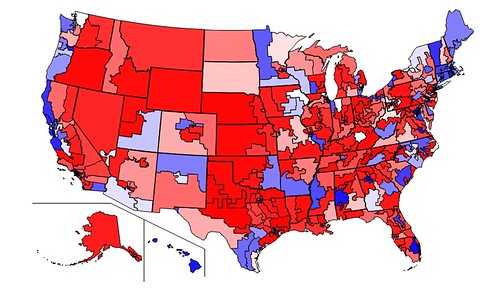
2010VoteMap

Behold our new Congress, based on provisional returns, colored according to Democratic Vote-Share. Compare with map on side-bar that shows our projections. 2010SwingMap

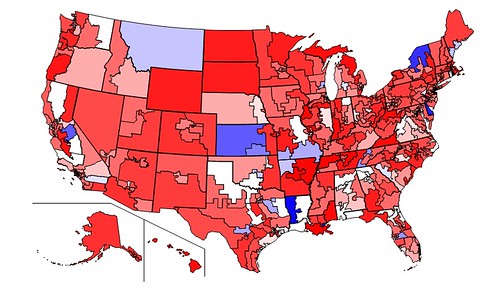
Swing in vote from 2008 to 2010. Red indicates districts where Republicans did better then last year, Blue indicates districts where Democratic standing improved, and White indicates no change. 

 Please click here to see a comparison of various predictions by John Sides of the Monkey Cage:

Stochastic Democracy predicted that Democrats would obtain 197 seats in the House of Representatives, 5 more than the currently projected outcome. This was the third most accurate forecast, 5 seats more accurate than FiveThirtyEight, and the most accurate one that also provided district-by-district vote estimates.

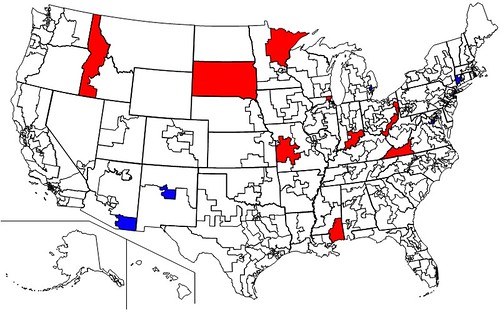
Called

Red indicates the 10 districts that Democrats were predicted to win but did not, Blue indicates 5 districts Republicans were predicted to win but did not. White indicates the 418 correctly called districts, with 2 districts still uncalled (NY-25 (Maffei) and CA-20 (Costa).

Note that Dan Maffei currently looks likely to lose, which would add another miss to our tally, while Costa will almost certainly hang on, as projected by us.

While this method of grading makes our site look good, it’s not a very informative one due to two reasons:

1) Everyone could get a majority of seats right- not very hard to forecasts the outcome of elections in Manhattan or rural Nebraska. A map that gets 30 districts wrong, like Pollster.com seems to have done, would still  be mostly white, despite a pretty underwhelming performance.

2) The record number of competitive districts this year. If you have a bunch of 50-50 districts, it’s basically a matter of luck how many of them you get right. That’s why sites like 538.com and us are doing probabilistic forecasts: We’re giving both candidates credit for having a shot to win the district for their side. Therefore, a much better way to evaluate forecasters is to look at how well they managed to predict vote-share district by district.

District by district, our model seems to have over-estimated Republican vote-share by about half a point. This is because the regression model appears to have inappropriately applied a uniform national swing to heavily Democratic urban districts- in downtown Chicago or New York, Democrats always win about 80-20, no matter what happens in the rest of the country, really. If we restrict ourselves to the 357 districts where the result was between 25 and 75%,  the bias effectively disappears (4 hundredths of a percent toward the Republicans).

Mean absolute error was 3.2 points, while median absolute error was 2.6 points. This goes down to 2.8 and 2.5 respectively for the 25-75% districts.

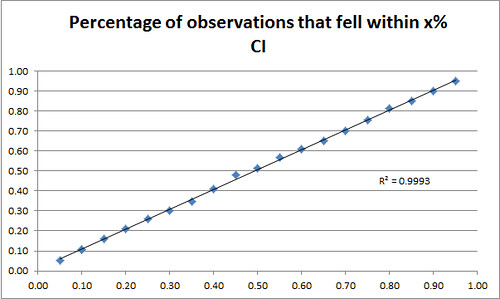
But we provided full probability distributions as well as vote estimates for each candidate. It seems that our stated standard errors were quite accurate: 94.7% of results fell within our 95% confidence intervals. More generally:

CIGraph

5.2% of results came within our 5% confidence interval, 10.6% in our 10% interval, etc.

In other words, our standard errors were well calibrated. Not only were we not wrong very often, but we were able to predict precisely how wrong we would be. That’s really amazing and can’t be stressed much enough: While most models really agree roughly on the mean of most predictions, they disagree heavily on how that should be converted to a percentage chance of winning. Nate Silver essentially had a very, very wide variance around his projections, so that he gave even candidates who were solidly ahead only a 70% or 80% chance of winning. We got the win percentage exactly right- about 95% of the candidates who we projected to have a 95% chance to win won, and the same is true for any other percentage.

We don’t have easily assessible data yet for the forecasts of FiveThirtyEight or Electoral-Vote, the only other forecasters we’re aware of who provided district level forecasts, and so we can’t yet replicate this analysis to see how our performance compares. On the other hand, Andrew Gelman, a renowned statistics professor at Columbia University, has looked at FiveThirtyEight’s forecasts and found that Nate’s confidence intervals were too wide:

So, yes, Nate’s forecasts do seem underconfident! There were 37 races where he gave the Republican candidate between 60% and 90% chance of winning, and the Republicans snagged all 37. Apparently he could’ve tightened up his predictions a lot.

We don’t think that looking at win-percentages solely is a fair measure, since most races are not close at all and race outcomes are not necessarily independent. Gelman agrees:

But . . . before jumping on Nate here, I’d suggest some caution. As we all know, district-by-district outcomes are highly correlated. And if you suppose that the national swing as forecast was off by 3 percentage points in either direction, you get something close to calibration.

Some other notes of interest:

Stochastic Democracy’s House forecasts were really a blend of two almost independent models: 1) A fundamentals-based regression model that took into account Incumbency, past election results, Income, Cook Ratings, and the Generic ballot adjusted for House Effects. And 2) A Bayesian state-space model that filtered polls, taking house effects, design effects, and potential industry bias into account.

The poll model shows that Democrats should have gotten 205 seats, while the regression model forecasted 186 seats. Paradoxically however, the poll model outperformed the Regression model in 52% of the individual races where polling was available.

Yet for races where polling and the fundamentals differed considerably, ID-1 (Minnick), AL-2 (Bright), MS-4 (Taylor), VA-9 (Boucher) etc (And CT-5 (Murphy) on the Dem side), the regression was considerably more accurate. There are a couple of theories as to why that could be, and it’s definitely something we’ll be looking at in the next couple of days.

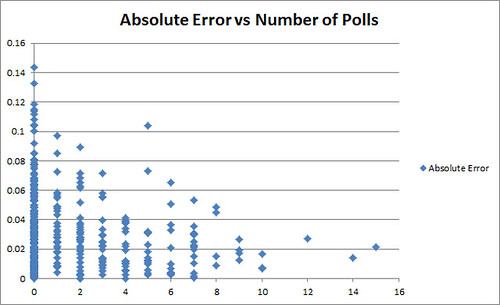
PollsvErr

Absolute Error of our forecast in a district vs the Number of Polls in the District


One potential concern is if there is sufficient race-to-race correlation, then well-calibrated confidence intervals could in fact mean badly calibrated confidence intervals. See Gelman. More on this later.

Another graph:

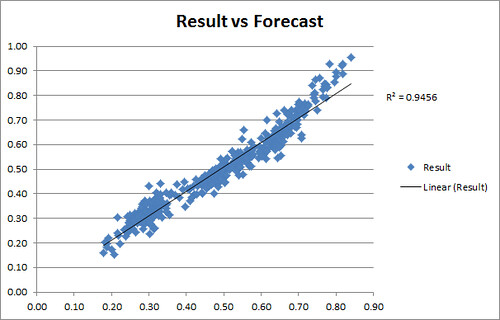
rsquared

Our final race forecasts graphed against election results. For comparison, FiveThirtyEight and Pollster’s R^2  seemed to have been .73 and  .55 respectively.

AZ03: Crunching the PPP poll.

***cross-posted at DailyKos***

If you haven’t seen it yet, yesterday DailyKos presented a poll that was conducted for us by Public Policy Polling, a North Carolina-based Democratic polling firm. Despite it’s affiliation with the Democrats, PPP doesn’t have a big noticeable House effect though.

The poll’s results were an absolute shocker: (relatively conservative) Democrat Jon Hulburd leads the former Vice President’s son Ben Quayle 46-44 in the district that is still held by retiring Republican Representative John Shadegg, one of the most conservative Republicans in the House, in a district that has a Cook PVI of R+9- that means that in the last few election cycles it voted on average 9 points more Republican than the nation as a whole.

John McCain, who admittedly stems from Arizona, won 57% of the vote there, Bush got 54% in 2000 and 58% in 2004.  

Another note: The huge paragraph breaks are intentional. They don’t look very aesthetically pleasing, but I think that without them the numerical density of the diary would pretty much kill every reader.

In such a bad cycle as 2010, where the general consensus is that Democrats are going to lose about 50 House seats, you’d expect a Democrat to be down at least by 15-20 points here- if not more.

So understandably lots of people questioned the validity of the poll. I’m going to dig a bit into the raw data, that’s provided for all joint DailyKos/PPP polls. A big hurrah to transparency!

Still, unless you like to see a lot of numbers, you can just skip to the conclusion, in the main part of the diary (and it will be long, I guess) I describe how I got there.

Basically, the analysis will have three steps:

1) We will look at several crosstabs that PPP/DailyKos didn’t provide in their tables in the release.

2) We will look at where Hulburd and Quayle fall short of the potential ceiling for Democrats and Republicans respectively in the district.

3) We will take a sophisticated look at undecided voters and how they might break down.

Raw Polling Data  and the Question Key.

Okay, the first thing we can use this for is to provide a couple of crosstabs that PPP/DailyKos didn’t release.

They’re not very surprising: Across the board, Hulburd does a better job holding on to voters for other Democratic candidates/people who approve of Democratic politicians than Quayle does with Republicans.

Hulburd wins 91-7 among the people who vote for Terry Goddard, Quayle wins 79-10 among Gov. Brewer’s supporters. Gubernatorial undecideds break 32-10 for Hulburd.

Hulburd wins Rodney Glassman’s supporters by an almost identical 90-7 margin, Quayle wins Sen. McCain’s supporters, but only by a 72-19 margin. The support that Senator McCain still has left among moderates who don’t rubberstamp all Republicans is not transferring to Quayle.

Senatorial Undecided voters break for Quayle 36-29- fueled by some people who don’t back McCain but most other Republicans- I guess some JD Hayworth supporters are still out there.

Not very surprisingly, Hulburd wins people who see him favorably, 88-8, and loses people who don’t like him 85-11. People who are still undecided about him go for Quayle by a 55-30 margin- maybe Hulburd has some room to grow here as people make up their minds about him and Quayle.

Quayle wins people who like him by a whooping 97-2 margin. That is mostly because almost no one likes him, and if you do, you’re such a hardcore supporter that you certainly will vote for him too. He loses people who view him unfavorably 8-85, and is saved by the fact that people who don’t have an opinion on him go for him 54-11.

I’m somewhat hoping that these are low-information voters who haven’t read much about the race and just went by the Party name provided: The Republicans are strong here, so their brand isn’t as much in the gutter here as elsewhere. As media coverage will ramp up in the last two weeks, hopefully some of these will learn about Quayle’s scandals.

I’m skipping how the people who view Brewer/McCain/Goddard/Glassman/Kyl favorably/unfavorably/not at all break down, because it is totally unremarkable: People who like Democrats vote for Hulburd, people who like Republicans vote for Quayle, people who don’t have a clue vote for Quayle by a lesser margin. If you’re interested though, ask in the comments, I have the data lying around.

Now, as for Obama… Obama’s image in this district is terrible, with his approval at 38% and his disapproval at 55%.

It’s no big surprise that Hulburd managed to shore up all supporters of President Obama, he wins them 95-2: That’s a better predictor than even how people view him or Quayle!

Hulburd also manages to win over 13% of people who disapprove of Obama, a (in today’s times) relatively huge amount of cross-over. Quayle gets 75% here. Among the few people who are still undecided on how they view Obama, Hulburd wins 57-19. I guess that if in such a red district you don’t hate Obama you’re pretty much a Democrat-leaning guy.

Not very surprisingly, Hulburd wins people who disapprove of the broadly popular SB-1070 90-7, because this mostly comes down to Liberals and Hispanics. He manages to win over almost a quarter of people who LIKE the law though, losing them only 22-67. This is what keeps him alive here, as 59% of voters like the law, just 34% don’t.

It’s no big surprise that Hulburd came out in favor of the law- we might not like it, but if he came out against it, he’d probably be down by 6-7 points despite of Quayle’s weaknesses.

On a related note, this is also why Raul Grijalva seems to be in a bit of trouble. If you call for a boycott of your own constituents because of a law that is supported by a majority of voters, that will not play very well with anyone, really.

Summary: Hulburd is competitive because he does much better with otherwise Republican-leaning people than Quayle does with Democrat-leaning people, and because he supports SB-1070, which enables him to win over a good chunk of the 59% of people who support it too.

Okay, great. But this was not really in-depth analysis so far.

The next step is looking at the potential that Democrats and Republicans have in the district, and where Hulburd and Quayle fall short of it.

I did this already for my first analysis of a PPP/Kos poll, and I was pretty satisfied with the interpretative value it provided.

The potential for Democrats and Republicans is defined as follows:

People who support at least one of Hulburd, Glassman, Goddard, or Obama in 2008, or who identify themselves as Democrats are among the reachable voters for Democratic candidates. A perfect Democratic candidate without weaknesses running against a flawed Republican could win them all. Roughly 58% of voters in the district belong to the this category, which could be termed the Democratic Persuadable Voter Universe (DPVU.. okay, I love appreviations).

People who support at least one of Quayle, McCain, Brewer, McCain in 2008 or who identify themselves as Republicans are in the RPVU universe (Republican Persuadable.. okay, you know the drill). That works out to a bit less than 70% of voters in this district.

Or, put another way, 30% of voters usually vote a straight Democratic ticket, 42% of voters usually vote a straight Republican ticket, and 28% of voters are swing voters who can be persuaded by both parties.

What are the characteristics of the people who are open to Democrats, but don’t support Hulburd, and what are the characteristics of the people who are open to Republicans, but don’t support Quayle?

Let’s clarify first that the latter group is much bigger than the former. Quayle reaches only about 62% of the many voters who might have supported a good Republican candidate, Hulburd gets almost 80% of his potential supporters.

Now let’s look at the potential Dems who don’t support Hulburd.

They support Brewer over Goddard, 55-35, McCain over Glassman, 57-36, dislike Hulburd 17-26, like Quayle 58-20, Brewer 61-27, McCain 57-34, Kyl 51-23, dislike Goddard 32-53, Glassman 12-27, and Obama by a whooping 16-74 margin.  They like SB-1070 69-19 BUT they only supported McCain over Obama by a 48-40 margin.

10% of them are liberal, 41% moderate, 49% Conservative, 61% female, 31% of them still identify as Democrats, 47% as Republicans, and 22% as Independents. 79% are White, 16% are Hispanic and 5% something else. Age breakdown is pretty irrelevant because largely similar to everyone else.

Okay, I think we can put these people into a three groups.

About 55% of them are Republicans or Republican-leaning Independents who happened to like one of Glassman, Goddard or Obama in 2008.

About 25% of them are Democrats or Democratic-leaning Independents who are now in the Obama disapproval camp, but still support some statewide Democrats like Glassman or Goddard. They don’t like Hulburd, or are still undecided on the race (Remember, we’re talking about ‘NOT SUPPORTING HULBURD’-Dems, not about ‘SUPPORTING QUAYLE’-Dems. The Undecided Dems are in here, too).

The last 20% are liberal or moderatish liberal Democrats who still like Obama, and statewide Democrats, dislike SB 1070 and are generally party-line Democrats, but still don’t support Hulburd.

These are the people he can’t afford to lose- he doesn’t have to get to his ceiling of 58%, but these last 20% of people Hulburd HAS to convince.

He should also try to firm up at least a bit of support among the Dems who have soured on Obama. If he does that, he’ll get closer to the 50% mark.

Okay, let’s do the same thing for the Republican-leaning group that doesn’t support Quayle: A much larger group.

They back Goddard over Brewer, but just barely, 48-43, and McCain over Glassman, by a huge margin, 61-30.

Here we already see a key difference: The Democrats who don’t support Hulburd soured on the WHOLE ticket, voting for Brewer and McCain.

The Republicans who don’t like Quayle draw a line there, but still are relatively open to people like McCain and to a lesser extent Brewer, suggesting that they don’t want to vote for very conservative wingnuts, but are open to supporting moderate and potentially sane conservative (Kyl) Republicans.

They like Hulburd, who’s a quite conservative Democrat, by a 45-8 margin. And they fucking HATE Quayle, with 7% viewing him favorably, and 76% unfavorably. Contrast that 7-76 rating with Hulburd’s 17-26 rating among his own defectors. Quayle’s defectors hate him, Hulburd’s defectors are merely ‘Meh’ about him.

They’re split on Brewer, giving her a 42-47 rating, and Kyl, who gets a 42-44 rating from them, but like McCain, 58-31. They also like Goddard, 53-32, and are not sure about Glassman, giving him a 20-19 rating.

Even though they don’t support Quayle and like many more moderate Democrats like Goddard and Hulburd, they’re not too fond of Obama though, who gets a 40-48 rating from them. Also, they back the SD-1070 bill, though to a lesser extent than the electorate as a whole, 53-34.

They voted for McCain in 2008, giving him 57% of their votes to Obama’s 31%.

10% are liberal, 57% moderate, and 34% Conservative, 56% female, 24% Democrats, 57% Republicans (!) and 19% Independent. 80% are White, 14% Hispanic, 6% Other, age breakdown is unremarkable once again.

So… essentially we have similar groups here, but the breakdown is a bit different. And we have one new group.

30% are essentially Democrats who happen to like a Republican (mostly McCain) but generally vote party-line on most cases.

About 40% are Republicans who generally support the party line, like Kyl and Brewer and SD-1070, but are disgusted by Quayle and therefore don’t support him. These are the people who like Brewer and Kyl and McCain, but not Quayle.

About 15% are moderates who generally support the middle-of-the-road candidate everywhere. They supported McCain in 2008, still love him, but they also like Goddard and back him over Brewer. They’re not really down on Glassman, but would never back him over McCain. They don’t like Obama, but they do like Hulburd, who’s running as a moderate Democrat supporting SB 1070, which they also like, and against an inept wingnut like Quayle.

And about 15% are Democrats who have soured on Obama, and vote much like the moderates.

All of these people have one thing in common: They hate Dan Quayle, which is why he’ll have a very hard time winning them over. He’ll get some of them because a lot of these people still don’t want a Democratic Congress and will- disgusted- still back him, but not that many.

Here’s an interesting statistic:

Looking at all moderate AND liberal Republicans, who make up about 18% of the sample, Quayle wins just by a measly 48-42 margin. That means that almost half of the moderate Republicans have abandoned him, that is huge.

As a comparison, looking at all moderate and conservative Democrats, a subsample that’s about the same size as the moderate and liberal Republicans, Hulburd wins 84-10. If the candidates were equally appealing, these numbers should be roughly the same. There you can see the huge difference between the candidate’s qualities.

Summary: While Hulburd still has some work to do with winning over some Democrat-leaning voters who still hold out on him, especially those who still like the other Democrats on the ticket, the main point here is just how unpopular Quayle is. Lots of conservative Independents and moderate Republicans and even conservative Republicans who usually are very open to Republican candidates have left his campaign. Some of them are already on board with the Hulburd campaign, some are still out there and thinking about their choice.

Okay, the last thing we’ll do is look at the Undecided voters. For that we need an advanced tool, a so-called Logistic Regression.

The short story is, without going into the math details, we’re looking at the voters who already have decided, and try to discern WHY they voted that way. We do that by looking at the other responses they gave in the poll. If they disapprove of Obama, voted for McCain, and are Conservative Republicans, who support Brewer over Goddard, we can be pretty sure that they will support Quayle: And we can quantify that and give them a certain probability that they will support Candidate A or B.

The result of this is some output that probably few of you would understand, so I’m not going to copy it here. If you want to see it, leave a message in the comments and I’m going to post it there.

The model has an adj. r² of .81 though, for the stats guys, which means that it explains 81% of the variance in the dependent variable (If the voter supports the Democrat).

Okay, the results here are not as good. The model projects that Hulburd will draw only 42% of the remaining undecided voters, with 58% going to Quayle. The main reason for that is that there are many people like #648 among the Undecided voters: She’s a white, conservative Republican aged 65+, voted for McCain and still likes him. She dislikes Obama, likes SB1070, and she doesn’t like Goddard- she doesn’t like Gov. Brewer either though. That’s why she’s undecided on the Gubernatorial race while she’s voting for McCain. She doesn’t like Quayle, and has no opinion yet on Hulburd.

The model assigns her a 76% chance that she finally will come home and vote for Quayle though, voting party line over her personal feelings.

For others the choice goes the other way. #644 has a similar profile: She, too, is a female senior white Conservative who dislikes Quayle and likes SB1070. But, she likes Hulburd too, while #648 was just undecided on him. And, she’s different on the gubernatorial race. While #648 disliked both Goddard and Brewer, she likes them both- still, she’s voting for Brewer. OTOH, she’s not as warm towards McCain anymore, having no opinion about him and still being undecided on the Senate race.

For her, the model thinks, her high opinion of Hulburd and her dislike of Quayle could make a difference, so the model gives her a 75% chance of voting for Hulburd and 25% for Quayle.

Still, among all undecided voters, on average 58% will break for Quayle and 42% for Hulburd. That almost erases Hulburd’s lead. Allocating the undecided voters results in a result of 50.1% for Hulburd to 49.9% for Quayle.


Summary: The demographics and responses of the remaining undecided voters suggest that Ben Quayle will gain the majority of their votes, 58-42. Allocating the undecideds that way results in a essentially tied race, 50.1-49.9% in favor of Hulburd.

Conclusion: The results of the PPP poll look pretty reasonable. Voters of all colors dislike Quayle and many of them follow this up by voting for Hulburd. Almost half of moderate Republicans vote for Hulburd, as do many voters who favor the SB-1070 bill. Hulburd’s conservative profile makes him a viable alternative for Republicans and conservative Independents who dislike Quayle, while he still holds the liberal part of his base together. Hulburd wins over many Conservatives and Republicans, while Quayle gets almost no cross-over support. That makes Hulburd competitive in this race where the fundamentals favor Quayle: 42% of voters here usually vote straight-ballot GOP– compared to 30% who do the same for the Democrats. But Hulburd wins over most swing voters.

The upside for Quayle in this poll is that the Undecided voters in this poll largely favor him, I project 58% of undecided voters to break for Quayle and 42% for Hulburd. This makes the AZ-03 election an absolutely tied race, with outprojecting the undecideds 50.1% voting for Hulburd and 49.9% for Quayle.

This race should come down to a couple of thousand votes, unless Quayle succeeds in making an argument that GOP voters and Conservatives should somehow forget their feelings for him in the ballot box.
A Quick Rundown of Orange County (and a quick note at the end)

This article by the New York Times highlights what we here on the ground already knew: The political winds are turning against the Republicans here. I already detailed this with my two previous diaries, but i want to add another part: the state of the local races here two very competitive Assembly districts.

Recently, Art Pedroza of the Orange Juice Blog recently wrote a scathing criticism of the leadership and the workings of the OC Democratic Party. While i disagree with him on certain issues, he makes a strong point by saying:

Make no mistake about it- the Republican Party of Orange County is the enemy.  They hate Mexicans.  They hate homosexuals.  They hate the poor.  They are corrupt, for the most part.  Stop kissing up to these people!

Now on to the locally contested races:

AD-68

Challengers: Phu Ngyuen (D) vs Allan Mansoor (R)

Registration: 40.1% Rep./32.7% Dem./21.9% Ind

Analysis: Located in the South-west part of OC, this district is extremely diverse with Hispanic enclave Stanton to the north, down to famed Little Saigon and the ethnically diverse meltingpot known as Costa Mesa. Democrat Phu Ngyuen is running a strong campaign against Costa Mesa Mayor Allan Mansoor, who is known for his Joe Arapaio-like bullying of immigrants. Ngyuen was recruited by the Dems for his strong ties to the Vietnamese community, a very competitive voting group and has the backing of the entire OC Democratic Party leaders. According to the Secretary of State, Ngyuen has $136,604 CoH while Mansoor is at a jaw-dropping $8,617! However, this race is still favorable to Mansoor due to his stature in Costa Mesa and the generally pro-Republican lean of 2010. Still, if Ngyuen can pull within single digits, that’s a win in itself.

Rating: Leans Republican

AD-70

Challengers: Melissa Fox (D) vs Don Wagner (R)

Registration: 42.3% Rep./30% Dem./23% Ind

Analysis: This race is gonna be one to watch on election day. Attorney Melissa Fox is up against Don Wagner, a member of the Coastal Community College District and a vocal social conservative. This district is open after Chuck DeVore’s pathetic attempt to beat Carly Fiorina in the Republican Senate race. Fox has been hitting the ground hard, running a stellar grassroots campaign and recently won the Democracy for America’s Allstar Grassroots campaign. However her fundraising is small, having raised only around $27,000 and having an anemic $7,747. But Wagner manages to beat (or stump below?) that, having raised $163,208 he is now at an amazing….$425. Yes, four-hundred and twenty-five dollars. But to be fair, he did face a very crowded Republican Primary, where he was the underdog against favorite Steven Choi, an Irvine Councilman. The folks at Orange Juice and the Liberal OC have been relentlessly going after Wagner since the campaign’s started. It amazes me that even though this district, with its large Republican registration, not only voted for Obama (51-47) but against! Prop 8 (50-50 narrowly) and yet they keep giving us Chuck DeVore-style religious wacko’s like Wagner. Nevertheless, my heart says this race is a Tossup but my mind tells me its another Leans R, but i’m letting my heart win for today.

Rating: Tossup

For those who are interested, here’s some links:

http://cal-access.ss.ca.gov/Ca… — Secretary of State’s Website for Campaign Funds

http://orangejuiceblog.com — In my opinion, the best place for knowledge on OC politics. Some posters have libertarian tendencies (such as Art Pedroza) while others are solid progressives (like Vern Nelson), but its still a very telling website to learn more on OC Politics.

http://votemelissafox.com — Melissa Fox, Democratic Nominee for AD-70

http://votephu.com — Phu Ngyuen, Democratic Nominee for AD-68

(Note: Wednesday is my first day of school (go juniors!), so my presence on SSP will be limited. But i’ll be back as much as i can to catch up on any delicious cat fud that may appear and of course i’ll stay for the November elections, so this may be my final (diary) post for a while. =)

(Note 2: This post was intended to focus on all local OC races, but i only picked AD-68 and AD-70 because of the competitiveness and visibility it has gotten.)

Analyzing Orange County: Why America’s Most Conservative County is Trending Blue (part 2/2)

For part 2, i stick to mainly text (sorry, no pretty graphics this time) to describe in detail how the Democratic trends in Orange County coincide with the overall social views on LGBT rights and Abortion.

While John McCain narrowly won Orange County, a so called bastion of conservatism (In fact, other than the Central Valley and parts of North Country, Orange County is indeed the only Republican turf left in the LA Area), support for Propositions 8 and 4 (A measure making underage pregnant women have to get permission seeking an Abortion) were higher at 58 and 55%, respectively. Why the stark difference between the two? Well, if you think it has to do with self-identified Republican voters, you’re half right, follow me below the fold.

While its a certainty that some Republicans and Independents crossed over to vote for Barack Obama, they were also instrumental in passing Props 4 and 8. But another extremely significant voting group helped as well: Hispanics. I was going to make a map (like the one with presidential results earlier) showing support/opposition to these ballot initatives, but its very easy to tell where support came from. Cities like Santa Ana, a “sanctuary” city home to a large (if not, massive) Hispanic population, voted overwhelmingly for not only Obama, but for Props 4 and 8.

First, let’s look at the so called “Blue” cities, that voted for Obama but for 4 and 8, the Yes/No results show how strongly the vote was for/against using the whole county as a baseline average:

Santa Ana:

Obama/McCain: 66/32

%Hispanic: 78%

Y/N Prop 4: 62/38 (+7 YES)

Y/N Prop 8: 62/38 (+4 YES)

Anaheim:

Obama/McCain: 51/47

%Hispanic: 48%

Y/N Prop 4: 59/41 (+4 YES)

Y/N Prop 8: 61/39 (+3 YES)

Buena Park:

Obama/McCain: 52/46

%Hispanic: 35%

Y/N Prop 4: 61/39 (+6 YES)

Y/N Prop 8: 62/38 (+4 YES)

These three cities were essential for President Obama’s near-victory here, but they weren’t the only surprises on election day. Next, i look at cities that voted for John McCain, but voted against or narrowly for these propositions.

Huntington Beach:

Obama/McCain: 45/53

Y/N Prop 4: 49/51 (-6 NO)

Y/N Prop 8: 53/47 (-5 YES)

Newport Beach:

Obama/McCain: 40/58

Y/N Prop 4: 47/53 (-8 NO)

Y/N Prop 8: 51/49 (-7 YES)

Dana Point:

Obama/McCain: 47/51

Y/N: 49/51 (-6 NO)

Y/N: 51/49 (-7 YES)

Newport Beach is strongly Republican, over 50% of its registered voters are Republicans, yet it opposed Proposition 4 (thus affirming a Pro-Choice stance) and barely supported Prop 8, all-the-while giving an 18-point victory to John McCain, while Huntington and Dana Point show similar, yet slightly more favorable results on both.

What does this all mean? Well, while Hispanics are generally pro-Democratic, notice extremely carefully that they aren’t pro-Liberal, and their Catholic views on Abortion and gay rights are in line with typical social conservatives. But, there is also a “country club” force in Orange County, the fiscal hawks who are in total agreement with the Tea Partiers, but are increasingly disillusioned with the Christian-right faction of the Republican Party. To sum it up: don’t just look on the surface to find your electoral answers for these voters, you have to dig further. It’s going to be interesting what the electorate will look like come 2012.

Analyzing Orange County: Why America’s Most Conservative County is Trending Blue (part 1/2)

(Note: This is a two-part diary on analysis of Orange County, i am writing up analysis of the effect of Prop 8 tomorrow. I apologize if it seems too long, but this is from a perspective of an OC resident. Comments and criticisms are welcomed.)

In 2008, Barack Obama accomplished something no other Democrat statewide could do: Keep Orange County within single digits (47-50%). While everyone knew he would win California (maybe not by the double-digit margin he did it by), no one including many OC Democrats here would imagine him being on the cusp of a symbolic victory: Winning in territory the media calls “America’s most conservative county”, the home of Richard Nixon and the center of Conservatism in California.

Well, how did he do it? Well, much like the so-called “Obama Wave” swamped the entire country, it also hit ground here in Orange County, taking the top three populated cities (Santa Ana, Anaheim and Irvine) and making large inroads in normally-conservative areas. President Obama wasn’t the only major change to Orange County politics, the controversional ballot measure known as Proposition 8 also broke-down boundaries, and you wouldn’t believe which cities voted for (or narrowly against) and against it, but first let’s take a look at each cities performance for the 2008 Presidential election (08′ only):

City PVI % ’08 Notes
(Orange County) R+4 47/50 Whole county.
Aliso Viejo D+1 53/45 Incorporated after 2000 Census
Anaheim R+1 51/47 Minority-majority; Second-largest city
Brea R+10 42/56
Buena Park D+1 53/44 Large Asian and Latino populations.
Costa Mesa EVEN 52/46
Cypress R+5 47/51
Dana Point R+5 47/51
Fountain Valley R+9 43/55
Fullerton R+3 48.6/49.8 College town; Minority-majority
Garden Grove R+5 48/51 Minority-majority; Large Vietnamese population
Huntington Beach R+6 46/52 Libertarian-leaning
Irvine D+5 57/41 College town
La Habra R+3 49/48.6 Minority-majority
La Palma R+3 48.4/49
Laguna Beach D+11 63/35 Well known for large LGBT community
Laguna Hills R+7 45/53
Laguna Niguel R+6 46/52
Laguna Woods EVEN 52/46 Extremely high percentage of Senior citizens
Lake Forest R+7 46/53 Large evangelical presence; Added communities after 2000 census
Los Alamitos* R+4 49/50
Mission Viejo R+8 44/54
Newport Beach R+12 40/58 Libertarian-leaning
Orange R+7 45/53
Placentia R+9 43/55 Large Hispanic population
Rancho Santa Margartia R+9 43/55
San Clemente R+10 42/56 Home of Ronald Reagan
San Juan Capistrano R+10 42/56
Santa Ana D+14 66/32 Largest city; Hispanic-majority; Most Democratic
Seal Beach R+5 48/51
Stanton D+2 54/44 Minority-majority
Tustin EVEN 52/46
Villa Park R+25 27/71 Most Republican; Least populated city
Westminster R+10 42/56 Large Vietnamese population, home to Little Saigon
Yorba Linda R+18 32/66 Birthplace of Richard Nixon

*Number 12 on the map, wasn’t added to the list.

If your one who prefers visuals (and tolerates crappy novice-style use of paint :P), then look below:

Angry face

This result shows that Obama made a large impact on Hispanic voters (OC was very Pro-Clinton during the primaries, as well as Hispanics), winning the heavily hispanic cities of Santa Ana, Buena Park, Stanton and Anaheim. He also made inroads with more conservative areas in the south, losing Huntington Beach by only 6 points (46-52) while it has a majority GOP registration edge, and Lake Forest by a similar margin (46-53), known for its strong evangelical presence such as the Saddleback Church and its pastor Rick Warren. Obama also gained huge support amongst young voters, handily carring Irvine (home to UC Irvine), and narrowly (48.6-49.4) losing Fullerton (home to Cal State Fullerton). From here, we’re going through a city-by-city analysis of how it votes, demographics and whether its going to be competitive in the elections to come:

(Note: I will detail the important cities to look for below, so not all 34 cities will be listed below.)

Aliso Viejo:

Population: 46,123

Analysis: Nestled in the fast-growing area of South Orange County, Aliso Viejo (the youngest city as of 2001) is an example of a city that is trending Democratic. Not only did it vote for Obama by a comfortable 6 point margin, it was one of only 4 cities here in Orange County that voted AGAINST Proposition 8 (48.5-51.5) and the second-strongest showing against the measure, Laguna Beach being the strongest. It is the stereotypical “Country club” Republican city, fiscally conservative on most issues (Also voting against the state’s High speed rail initative, which passed) but fairly moderate-to-liberal on social issues, voting against Propositon 4 which sought to restrict contraceptives to minors unless a parent has consent. If any Democrat statewide seriously plans to turn Orange County blue, winning Aliso Viejo is a must.

Anaheim:

Population: 353,643

Analysis: The second largest city in the county and the main entertainment hub, home to Disneyland. Anaheim is a city that is easily classified by geography. Most of Anaheim is fairly urban and very Hispanic, mainly around the Downtown area. But to the East, lies a whole different kind of Anaheim: the community of Anaheim Hills. Already hearing the name, and you’re correct to guess that its a more wealthy, upscale area far different than its neighbor to the west. Home to mansions and a getaway for celebrities, Anaheim Hills is strongly GOP turf, fiscally and socially conservative but more so on the fiscal side. For someone to want to turn Orange County blue, they would need to keep their margins down in Anaheim Hills and fairly high in the rest of Anaheim.

Brea:

Population: 40,377

Analysis: This one is personal since this is where i live, but its also the most descriptive as well. Surrounded by large cities (Fullerton, Chino Hills and Diamond Bar), Brea is a sanctuary to escape from the bigger more urban cities in and around LA County. Politically, however Brea is strongly conservative, especially socially. There is a large and very influential Mormon presence here (There’s two LDS places of worship here alone!) along with large Catholic, and Baptist faiths. To the south is the even-more conservative city of Yorba Linda, who uses the city of Brea’s Police since they don’t have their own department. However there is a steadily growing Hispanic population, mainly from neighboring La Habra and cities near Brea in LA County, but like with Mormons they are socially-conservative as well, so its a double-edged sword. No Democrat will win here, but cracking 40% here is an accomplishment in its own.

Buena Park:

Population: 84,141

Analysis: It shares similarities with its neighbor Anaheim in that: Both have large Hispanic populations, and both are known for its amusement parks (Knott’s Berry Farm for Buena Park). Yet Buena Park is slightly more Democratic due to its large Asian population (most likely from nearby Cerritos in L.A County) and its higher turnout rates than Anaheim. Buena Park is a must win city, and getting around 55% would be enough for a squeaker county-wide.

Costa Mesa:

Population: 117,178

Analysis: Surrounded by larger cities, Costa Mesa is a popular city to live in due to its close proximity to Huntington/Newport Beach, and close to UC Irvine. But Costa Mesa has made the news for declaring itself a “Rule of Law” city, taking a hard line against illegal immigration. The person most responsible for bringing it up for a vote? The Mayor, Allan Mansoor, who is also running for the State Assembly (Gee, see how that all works out?) in 2010. Despite this, Costa Mesa is trending Democratic because of its large Latino population, along with people from nearby Irvine moving to Costa Mesa. Another must-win to turn the OC Blue.

Fullerton:

Population: 106,335

Analysis: Home to Cal State Fullerton (the largest in the state by enrollment), Fullerton is a fast-growing suburb of Los Angeles and an overall enjoyable city. Gaining a larger Latino population due to its close proximity to Whittier and South Los Angeles, makes Fullerton a swing city for elections to come.

Garden Grove:

Population: 174,715

Analysis: Garden Grove is home to a very large Vietnamese population, much like nearby Westminster is as well. In terms of voter registration, Republicans edge Democrats by around 3,000 voters but gave John McCain a solid 52%. The reason being because Garden Grove is very conservative on social issues, and viewed Obama as too liberal for them. Along with their generally anti-communist views, Garden Grove is also home to a small, but noticable Latino population, mainly from nearby Santa Ana.

Huntington Beach:

Population: About 200,000

Analysis: A well-known tourist destination for those looking for great surfing, Huntington Beach symbolizes a “Live free and Die” mentality, and its voting record is one to notice carefully. Voting for McCain 52-46% while subsequently voting against Prop 4 by 3 points and narrowly voting for Prop 8 by 2 points. If this trend continues, Huntington Beach will be poison for social conservatives.

Irvine:

Population: 212,184

Analysis: Irvine is a city that is rapidly turning Democratic, due to the extremely large influence the University of California, Irvine campus has on the city. In fact, all of the precincts in and around UC Irvine went around 80% for Obama. The city council has a Democratic majority, along with the Mayor, and has implemented many progressive policies. Democrats, Republicans and Decline to State voters all have around 30,000 voters each, meaning Irvine is a solid tossup for elections to come, but give it a Democratic edge due to its large youth voters.

Laguna Beach:

Population: 23,727

Analysis: Laguna Beach is the major LGBT scene in Orange County, and was one of the first cities to sponsor a resolution opposing Proposition 8, so its no surprise that Obama carried Laguna Beach by a landslide. Laguna Beach is the second most Democratic city in Orange County, and will likely overpower Santa Ana as #1 in the near future. Any Democratic candidate can easily win here.

Lake Forest:

Population: 78,720

Analysis: Home to the Saddleback Church and its pastor, Rick Warren, Lake Forest is situated within Southern Orange County and is close to the cities of Mission Viejo and Irvine. Despite its reputation as being home to major evangelical groups, Obama did surprisingly well, keeping his loss within single digits. Could he win here in 2012? It depends on a number of factors, but it can’t be ruled out.

Santa Ana:

Population: 355,662

Analysis: Santa Ana is ground zero for Democrats, its strongest (being the most populated city in the county) and safest city politically. Home to an extremely large (almost 80%) Hispanic population, Democrats routinely poll in the high 60’s and all of the currently elected officials (State Senate/Assembly/Congress) have Santa Ana as their major base.

United States Senate (Chart and Open Virginia)

Cross-posted at Election Inspection under elliotka and at Daily Kos under NMLib

Ok, for a bit of a break in the primary action, it’s time to start looking at some Senate races. Basically, what I’m going to do is do a ranking system much like Charlie Cook does, only I will also be giving a fairly detailed analysis of each race, also the races which would normally be classified as “likely” for incumbent parties, I’m going to label as Possible Darkhorse Races. Finally, I’m going to do this list in multiple posts, as to be more thorough with each race. I will not be giving an analysis of any incumbent races which I see as being completely uncompetitive, just because there’s no reason for it.

(Formating note: races with an incumbent running for re-election will have that incumbent followed by the state in parenthesis, and vice-versa for open seat contests)

Solid Democratic (Pick-up)

  • Virginia (Warner)

Solid Democratic (Retention)

  • Kerry (Massachusetts)
  • Durbin (Illinois)
  • Baucus (Montana)
  • Johnson (South Dakota)
  • Levin (Michigan)
  • Lautenberg (New Jersey)
  • Harkin (Iowa)
  • Biden (Delaware)
  • Reed (Rhode Island)
  • Pryor (Arkansas)
  • Rockefeller (West Virginia)

Leans Democratic (Pick-up)

  • New Mexico (Domenici)
  • Sununu (New Hampshire)

Leans Democratic (Retention)

  • Landrieu (Lousiana)

Toss-up

  • Colorado (Allard)
  • Coleman (Minnesota)

Leans Republican (Retention)

  • Smith (Oregon)
  • Collins (Maine)

Solid Republican (Retention)

  • Graham (South Carolina)
  • McConnell (Kentucky)
  • Enzi (Wyoming-A)
  • Barrasso (Wyoming-B)
  • Sessions (Alabama)
  • Roberts (Kansas)
  • Cochran (Mississippi-A)
  • Chambliss (Georgia)
  • Alexander (Tennessee)

Possible Darkhorse Races (Republicans)

  • Idaho (Craig)
  • Wicker (Mississippi-B)
  • Dole (North Carolina)
  • Stevens (Alaska)*
  • Nebraska (Hagel)
  • Cornyn (Texas)
  • Inhofe (Oklahoma)

I’m going to try to break these posts into looking at each category separately. And so we’ll start with the single Solid Democratic pick-up seat:

Virginia

  • Status: Open Seat
  • Ranking: Solid Democratic (Pick-up)

Democrat running: Mark Warner (former governor)

  • Money raised Quarter 4: $2.7 million
  • Cash on Hand as of 2007: $2.9 million

Republican running: Jim Gilmore

  • Money raised Quarter 4: $343,000
  • Cash on Hand as of 2007: $183,000

Polling from Virginia

  • Rasmussen (Released January 3) Warner 53% Gilmore 38%
  • Survey USA (Released November 5) Warner 57% Gilmore 35%

Analysis: This is probably going to be the most lop-sided victory by the challenging party in the entire season. What’s really ironic is that this race could’ve been a lot more competitive had the Republicans rallied behind Northern Virginia Congressman Tom Davis, who not only had a base of support in Democratic-leaning Northern Virginia, but could actually fundraise effectively. Instead the Republicans rallied behind decidedly unpopular former governor Jim Gilmore (who was forced to drop out of the presidential race because of, you guessed it, lack of funds). The only possible way to describe Gilmore is with what Senate2008Guru has said “Jim Gilmore… hahahahahahahahaha”  The real irony of this particular race is that Mark Warner was also considering a presidential run this time around, but one of the more interesting rumors I’ve heard is that he decided against running because many of the donors who would’ve given to his campaign had already pledged themselves to Barack Obama (this hasn’t generated bad blood though, since Warner is, behind the scenes, rooting for Obama). So what we are left with is a race with a top-tier Democratic candidate who could’ve easily run a fifty-state strategy against an third-tier candidate who no one knows or likes. You can see why I rank this race Solid Democratic.

Next time: New Mexico and New Hampshire (and possibly Louisiana)

Analysis: How well did Minnesota Candidates Spend Money?

(Great, great stuff. – promoted by James L.)

Cross-posted from MN Campaign Report and Big Orange at DavidNYC’s request – hope it’s up to snuff!

The National Journal (subscription req’d) recently dug into disbursement records for Congressional and Senate candidates in the 2006 election to answer an interesting question:  How much did a given candidate spend on each vote he or she eventually received?  Alternately, how efficiently did candidates spend their hard-earned warchests?

As noted, this is an interesting question, especially when it comes to Minnesota.  The 2006 U.S. Senate race between Hennepin County Attorney Amy Klobuchar and Sixth District Congressman Mark Kennedy saw nearly $20 million in candidate committee disbursements, and the race between Michele Bachmann and Patty Wetterling to succeed Kennedy in his Congressional seat was quite expensive as well. 

But there’s something missing from the National Journal’s analysis.  Even in an underfunded position, a certain number of voters are always going to vote a certain way – what’s usually known as “the base”.  The Republican base was never going to vote for Amy Klobuchar in statistically significant numbers, nor was the DFL base going to defect in droves to the Kennedy banner.  It’s the votes beyond the base – the marginal votes earned – that might yield more insightful data.

Likewise, there’s a margin in terms of dollars spent.  Even marginally competitive candidates are going to raise and spend at least a certain level of money – it’s what they raise and spend beyond that level that we can focus on as a measure of their effectiveness.

This Marginal Dollars per Marginal Positive Outcome has been used by Baseball Prospectus in analyzing clubs’ efficiency in spending – high-revenue teams like the Yankees, Red Sox, Cubs, and Dodgers pay dearly for each win above what a team of rookies, each paid the league minimum, would achieve.

Enough baseball – more political statistics!

Some definitions:

  • Net Disb:  Net Disbursements from the candidate’s primary campaign committee, courtesy of FEC.gov
  • dBP:  District Base Percentage.  This is a somewhat fudged figure, based on convention wisdom about the political dynamics in each district and statewide.  It accounts for a slight DFL tilt statewide, conservative tilts in the Second and Sixth Congressional Districts, a heavy tilt toward the DFL in the Fifth, and a generally even balance in the First.
  • dTV:  District Total Votes.  Total number of votes cast in this race for competitive major-party candidates.  Fifth District candidate Tammy Lee counted in this analysis, as did John Binkowski in the Sixth, but Robert Fitzgerald and others did not.
  • Bvotes:  Base votes.  Candidate’s vote total times their base percentage – again somewhat fudged due to conventional wisdom.
  • Mvotes:  Marginal votes.  Total votes minus base votes – this is an attempt to represent votes the candidate earned over the course of the campaign beyond those that would vote for a carrot with the right letter after its name.
  • Mdisb:  Marginal Disbursements.  This is another somewhat fudged figure.  In the several competitive congressional races in Minnesota, I defined the minimum spending level as that of Alan Fine, Republican candidate in the Fifth District, who raised and spent a shade under $200,000.  For the Senate race, I defined “competitive funding” as a cool $3,000,000 – in an inexpensive media market, three million should provide at least a modicum of competitiveness in a statewide federal race.  If anyone has a better figure for this, I’m all ears.
  • mD/mV:Marginal Dollars Spent per Marginal Vote Earned – the mother lode.

Caveats:  There are several fudge points in this analysis, including the base percentages and disbursement levels.  I hope they’re generally accurate.  This analysis also does not account for larger political events and trends, including hurricanes, wars, and ineptitude leading to popular dissatisfaction.  Nor does it account for independent expenditures by political parties and outside organizations, the effects of which are difficult to quantify.

Nevertheless, in the aftermath of 2006, this analysis may further clarify who spent money well and who did not.

The chart above reveals some interesting trends.  Many of the mD/mV numbers make sense – Mark Kennedy spent a lot of money on each vote he earned, because he didn’t get many beyond his base.  Tim Walz, in defeating entrenched incumbent Gil Gutknecht, spent his smaller warchest efficiently.  Although Keith Ellison had a natural advantage in a DFL-friendly district, it turns out that he spent a fairly high dollar amount for each vote beyond the hardcore DFL vote, and Tammy Lee spent efficiently, if only to achieve a 25% finish.  And fittingly, the Sixth District race saw two candidates spending massive amounts of money for each vote beyond their bases.

Given the final outcome, it appears that this was an extremely inefficient race on which to spend money.