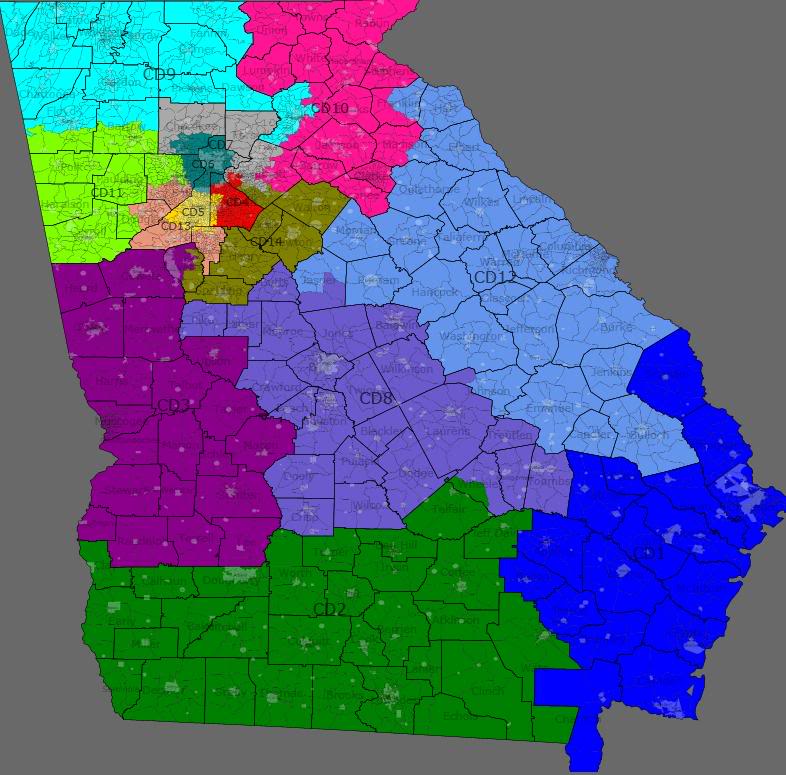
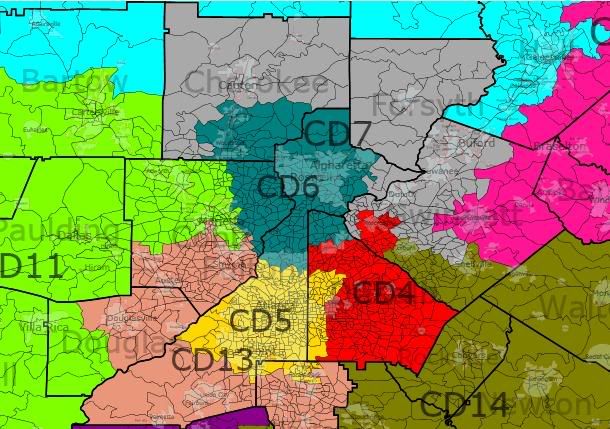
This is the second of my Georgia maps. I've already done a Democratic gerrymander. In this edition, I tried to think like a Georgia Republican (but failed because I'm not that damn crazy or evil). With the fate of the VRA seemingly in doubt, I went ahead and discounted it, using only the requirements of contiguousness and equal population and political realities in shaping the districts (because there's no way the Republicans could get a 14-0 Georgia delegation short of epic measures).
My “goals” for this round were:
- To protect John Linder, who's Gwinnett-based district is rapidly diversifying from black, Hispanic, and Asian growth and taking on some liberal whites as well, as seen in long-term trends toward our side.
- To ensure the long term (at least to the next round of redistricting) sustainability of the other Republican districts.
- To make the new district a Republican district.
- To try to eliminate as many Democrats as possible.
- To try to avoid primary battles within the Republican Party.
- To make the districts look as nice as possible.
I think I achieved these goals with the following districts:

Metro Atlanta:
The major non-Atlanta regional population centers (Athens, Augusta, Columbus, Macon, and Savannah) all get a district to themselves and their surrounding areas, intact, without sharing with another major city.
1st District (Jack Kingston [R] vs. John Barrow [D]) BLUE
New Demographics: % white | % black | % Native American | % Asian | % Hispanic | % Other
Old Demographics: % white | % black | % Native American | % Asian | % Hispanic | % Other
Old District: 72.6% white | 22.7% black | .3% Native American | .9% Asian | 4.1% Hispanic | .2% other
The first of the Republican pickups comes in coastal Georgia. Chatham County (Savannah) is made whole, putting Jack Kingston and John Barrow in the same district. Kingston has a decided advantage here. Of the seventeen counties in the new district, Barrow represents only three, one of which is a major thorn in his side. He loses his secondary base in the Augusta area and picks up several rural/exurban, white, and VERY Republican counties. Kingston, on the other hand, has much of his old district intact. Barrow has struggled before in a far more minority, far more Democratic district. His ability to survive here is very much in doubt. His only saving grace would be his fundraising prowress.
2nd District (Sanford Bishop [D]) GREEN
New Demographics: % white | % black | % Native American | % Asian | % Hispanic | % Other
Old Demographics: % white | % black | % Native American | % Asian | % Hispanic | % Other
Old District: 51.4% white | 44.8% black | .3% Native American | .6% Asian | 3.5% Hispanic | .1% other
With the 2nd, I essentially pushed the district over, cutting Bishop off from his secondary base in the Columbus area and instead moving the district east, taking up large swarths of white, Republican, rural areas.
3rd District (Lynn Westmoreland [R]) PLUM
New Demographics: % white | % black | % Native American | % Asian | % Hispanic | % Other
Old Demographics: % white | % black | % Native American | % Asian | % Hispanic | % Other
Old District: 72.6% white | 22.7% black | .3% Native American | .9% Asian | 4.1% Hispanic | .2% other
4th District (Hank Johnson [D]) RED
New Demographics: % white | % black | % Native American | % Asian | % Hispanic | % Other
Old Demographics: % white | % black | % Native American | % Asian | % Hispanic | % Other
Old District: 35.8% white | 53.5% black | .4% Native American | 4.3% Asian | 8.5% Hispanic | 0% other
5th District (John Lewis [D]) YELLOW
New Demographics: % white | % black | % Native American | % Asian | % Hispanic | % Other
Old Demographics: % white | % black | % Native American | % Asian | % Hispanic | % Other
Old District: 37% white | 56.1% black | .2% Native American | 2.2% Asian | 6.1% Hispanic | 0% other
6th District (Tom Price [R]) TEAL
New Demographics: % white | % black | % Native American | % Asian | % Hispanic | % Other
Old Demographics: % white | % black | % Native American | % Asian | % Hispanic | % Other
Old District: 85.6% white | 7% black | .2% Native American | 4% Asian | 4.5% Hispanic | .1% other
The loss of parts of North Fulton and Cherokee to sure up Linder next door and the fact that some parts of the district are shaky (North DeKalb and Sandy Springs) necesitated moving the 6th down into the white, Republican parts of Atlanta on the northside. Short of something major, Price should be okay
7th District (John Linder [R]) GRAY
New Demographics: % white | % black | % Native American | % Asian | % Hispanic | % Other
Old Demographics: % white | % black | % Native American | % Asian | % Hispanic | % Other
Old District: 72.6% white | 22.7% black | .3% Native American | .9% Asian | 4.1% Hispanic | .2% other
8th District (Jim Martin [D]) PERIWINKLE
New Demographics: % white | % black | % Native American | % Asian | % Hispanic | % Other
Old Demographics: % white | % black | % Native American | % Asian | % Hispanic | % Other
Old District: 72.6% white | 22.7% black | .3% Native American | .9% Asian | 4.1% Hispanic | .2% other
9th District (Open [R-held]) CYAN
New Demographics: % white | % black | % Native American | % Asian | % Hispanic | % Other
Old Demographics: 84% white | 4% black | 0% Native American | 0% Asian | 9% Hispanic | 0% Other
Old District: 82.5% white | 13.7% black | .3% Native American | 1.2% Asian | 2.6% Hispanic | .1% other
In the four maps I've made for Georgia, I always have trouble with the Nineth because we don't yet know who's going to be the Congressman. The map I made tries to put the all of the potential candiates into the district (sans State Rep. Bobby Reese, who entered after I made this map and who doesn't lIVe in the current district anyways). The new district has the same general shape but sheds all of Forsyth, Lumpkin, Union, White Counties, as well as about 45% of Hall County (done to keep the Tenth from getting too mishapen. In return, it gains all of Chattooga County, the parts of Gordon County originally in the Eleventh, and the Northern parts of Bartow and Floyd Counties. In sum, it becomes more rural.
10th District (Paul Broun [R]) HOT PINK
New Demographics: % white | % black | % Native American | % Asian | % Hispanic | % Other
Old Demographics: % white | % black | % Native American | % Asian | % Hispanic | % Other
Old District: 72.6% white | 22.7% black | .3% Native American | .9% Asian | 4.1% Hispanic | .2% other
11th District (Phil Gingrey [R]) ACID GREEN
New Demographics: % white | % black | % Native American | % Asian | % Hispanic | % Other
Old Demographics: % white | % black | % Native American | % Asian | % Hispanic | % Other
Old District: 72.6% white | 22.7% black | .3% Native American | .9% Asian | 4.1% Hispanic | .2% other
12th District (NEW SEAT) POWDER BLUE
New Demographics: % white | % black | % Native American | % Asian | % Hispanic | % Other
Old Demographics: % white | % black | % Native American | % Asian | % Hispanic | % Other
Old District: 72.6% white | 22.7% black | .3% Native American | .9% Asian | 4.1% Hispanic | .2% other
13th District (David Scott [D]) SALMON
New Demographics: % white | % black | % Native American | % Asian | % Hispanic | % Other
Old Demographics: % white | % black | % Native American | % Asian | % Hispanic | % Other
Old District: 72.6% white | 22.7% black | .3% Native American | .9% Asian | 4.1% Hispanic | .2% other
14th District (NEW SEAT) OLIVE
New Demographics: % white | % black | % Native American | % Asian | % Hispanic | % Other
Old Demographics: % white | % black | % Native American | % Asian | % Hispanic | % Other
Old District: 72.6% white | 22.7% black | .3% Native American | .9% Asian | 4.1% Hispanic | .2% other
I think a lesson to take from this is that ostensible communities of interest and clean lines making geometric districts can really fuck us over and an unwillingness to cross political and geographic boundaries can really kill us.