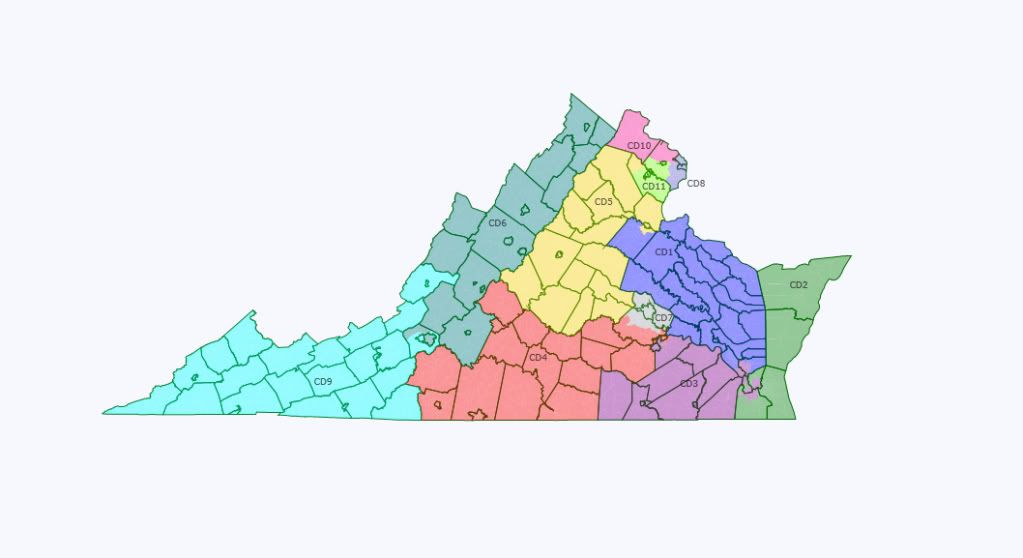
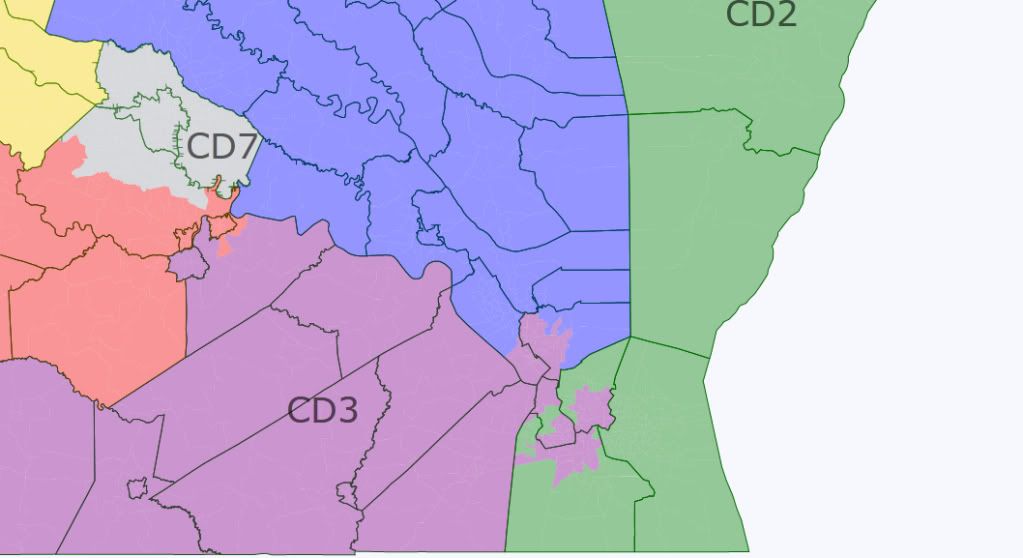
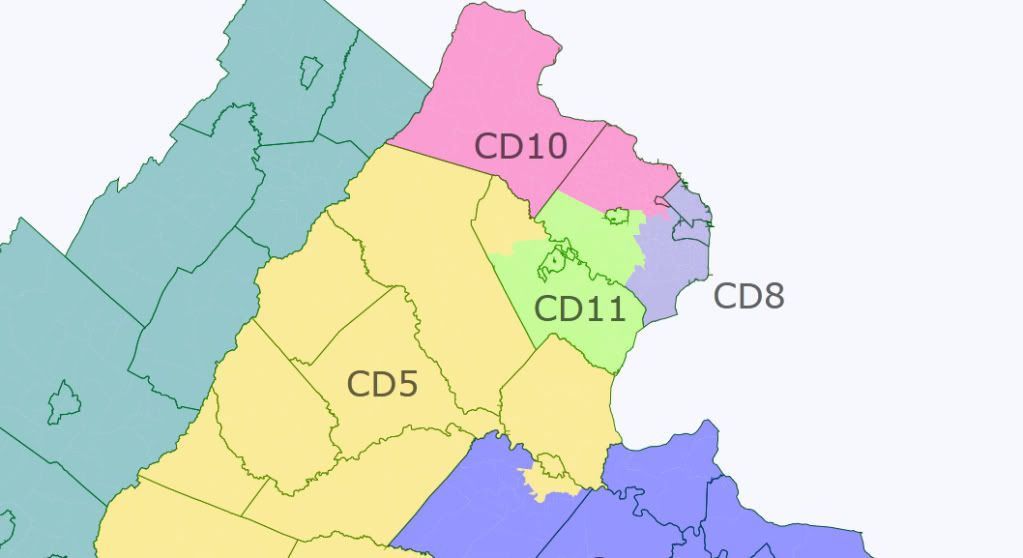
Here is my spin on Virginia with the 2010 Census and political data in Dave’s App. Because of Democratic control of the Senate and Republican control of everything else, a court-drawn map is a reasonable possibility in Virginia. I attempted to prioritize the same goals a court would. These goals were:
1. Preserve a majority-black voter district
2. Avoid county splitting
3. Keep each district limited to one region of the state
4. Compactness
District 1: Tidewater
Incumbent: Rob Wittman (R)
Population: 726,817
Two-Party Partisan Performance:
New District: 45.5% Obama, 43.4% Democratic
Old District: 48.4% Obama, 44.8% Democratic
Racial/Ethnic Demographics:
71.3% White
18.8% Black
04.6% Hispanic
02.2% Asian
This district takes a portion of the northern peninsula in the Hampton Roads area, the rest of the Tidewater area to the north, and ultra-conservative Hanover County north of Richmond. It becomes less Democratic and safely Republican.
District 2: Hampton Roads
Incumbent: Scott Rigell (R), Randy Forbes (R)
Population: 727,545
Two-Party Partisan Performance:
New District: 49.1% Obama, 46.8% Democratic
Old District: 52.4% Obama, 49.1% Democratic
Racial/Ethnic Demographics:
66.3% White
19.1% Black
06.3% Hispanic
04.9% Asian
The district takes in all of Virginia Beach and the Delmarva Peninsula plus the whiter portions of Chesapeake, Portsmouth, and Norfolk. The district becomes slightly more Republican. It would be tough, but not impossible, for a Democrat to win here. Randy Forbes and Scott Rigell both live in the district, but because this contains much more of Rigell’s territory, I think he’d have the edge.
District 3: Hampton Roads (VRA District)
Incumbent: Bobby Scott (D)
Population: 726,624
Two-Party Partisan Performance:
New District: 69.2% Obama, 65.1% Democratic
Old District: 75.7% Obama, 71.3% Democratic
Racial/Ethnic Demographics:
38.3% White
53.2% Black
04.0% Hispanic
01.8% Asian
This district becomes much more compact, leaving the Richmond area. It is still has a majority of black voters, though that majority is a few percentage points smaller. This district is very safe for Democrats.
District 4: Southside
Incumbent: Robert Hurt (R)
Population: 727,567
Two-Party Partisan Performance:
New District: 42.2% Obama, 43.2% Democratic
Old District: 51.0% Obama, 49.0% Democratic
Racial/Ethnic Demographics:
68.0% White
28.0% Black
03.0% Hispanic
01.1% Asian
This district shifts west, taking in Virginia’s Southside region. It becomes much more Republican and is probably unwinnable for Democrats.
District 5: Piedmont
Incumbent: None
Population: 728,108
Two-Party Partisan Performance:
New District: 49.7% Obama, 46.2% Democratic
Old District: 48.5% Obama, 47.3% Democratic
Racial/Ethnic Demographics:
73.6% White
14.4% Black
06.2% Hispanic
03.0% Asian
This district shifts north, still containing Charlottesvile but trading Southside for Virginia wine country and portions of the Northern Virginia exurbs. It becomes slightly more Democratic and is winnable with the right candidate. Eric Cantor would probably run here, since it contains a fair amount of his old turf.
District 6: Shenandoah Valley
Incumbent: Bob Goodlatte
Population: 728,381
Two-Party Partisan Performance:
New District: 42.4% Obama, 40.5% Democratic
Old District: 41.9% Obama, 57.9% Democratic
Racial/Ethnic Demographics:
83.9% White
07.9% Black
05.1% Hispanic
01.2% Asian
This is still a Shenandoah Valley district and very, very Republican.
District 7: Richmond
Incumbent: Eric Cantor (R)
Population: 726,869
Two-Party Partisan Performance:
New District: 61.8% Obama, 57.0% Democratic
Old District: 46.6% Obama, 42.1% Democratic
Racial/Ethnic Demographics:
54.0% White
32.7% Black
06.4% Hispanic
04.5% Asian
This district has undergone a huge change, going from a safe Republican to safe Democratic seat. Eric Cantor would stand little chance of victory here. Sen. Donald McEachin and Del. Jennifer McClellan would be the likely Democratic candidates.
District 8: Northern Virginia
Incumbent: Jim Moran (D)
Population: 727,201
Partisan Performance:
New District: 68.2% Obama*, 54.9% Democratic
Old District: 69.3% Obama*, 57.9% Democratic
Racial/Ethnic Demographics:
52.4% White
14.1% Black
18.9% Hispanic
11.3% Asian
This district contains all of Arlington County and Alexandria City, plus other close-in suburbs in Fairfax County. It becomse slightly less Democratic, but remains safe.
*Note that President Obama’s performance is slightly understated due to an error in the data.
District 9: Southwest Virginia
Incumbent: Morgan Griffith (R)
Population: 728,247
Partisan Performance:
New District: 40.1% Obama, 43.2% Democratic
Old District: 40.3% Obama, 43.7% Democratic
Racial/Ethnic Demographics:
92.2% White
03.4% Black
01.8% Hispanic
01.3% Asian
This district contains Southwest Virginia. Its partisan makeup is unchanged and post-Rick Boucher is probably unwinnable for Democrats.
District 10: Northern Virginia
Incumbent: Frank Wolf (R)
Population: 726,837
Two-Party Partisan Performance:
New District: 54.7% Obama*, 53.6% Democratic
Old District: 50.2% Obama*, 47.2% Democratic
Racial/Ethnic Demographics:
62.8% White
06.0% Black
12.6% Hispanic
16.9% Asian
This district shrinks dramatically, dropping its territory outside Northern Virginia. It contains Loudoun County, the City of Falls Church, and northern Fairfax County. The district becomes significantly more Democratic, which might actually encourage a credible challenger to run against Frank Wolf. My guess would be state Sen. Mark Herring.
*Note that due data errors, this President Obama performed about 2 percentage points better than it appears.
District 11: Northern Virginia
Incumbent: Gerry Connolly (D)
Population: 726,807
Two-Party Partisan Performance:
New District: 57.6% Obama, 51.1% Democratic
Old District: 56.6% Obama, 52.3% Democratic
Racial/Ethnic Demographics:
51.8% White
13.9% Black
17.9% Hispanic
12.6% Asian
This district takes in the remainder of Fairfax County and all of Fairfax City, Mannassas, Manassas Park, and Prince William County. The partisan composition doesn’t change much. Since Conolly survived 2010, I have to beleive he’ll be fine in the future.
This map would probably produce 5 Democrats and 6 Republicans.


I found the idea behind your version of VA-03 to have particular potential for maps where only one majority-black district gets drawn in the southeast.
Overall, the thing that remains striking to me about all of our maps is that the greater Tidewater/Chesapeake/Hampton Roads area really ought to be dropping a district; which generally seems to be reappearing in north central Virginia.
There is another map just a thread or two below. I like your 9th district better as it continues up the moutains as opposed to going eastward. Just a perference of my own. CD4 is close to being as is CD3 a “southside VA” seat.
I like that.
You are giving Connolly a more difficult district in exchange for a sure thing in Richmond. I would be happy with this, but I suspect the incumbents wouldn’t be.
What I am pretty sure of is that the Republicans overreached downstate by trying to pack all of the Democrats into the 3rd district. If the Democrats agree to retain that pattern, then they will pretty clearly want to be aggressive with the adjacent districts in future elections.
It’s what I would have done to the Perriello district if he had been reelected. Take away his southern territory, which is getting more Republican, and trade it for northern territory, which is getting more Democratic.
It is another possibility for how a court would draw the map.
However, I don’t really like the way NoVA is drawn on this map. Fairfax County+Fairfax City+Falls Church+Arlington+Alexandria have almost exactly enough population for two districts within them, so it seems to me the most logical thing to do would be to put two districts entirely within those areas. Also, I like keeping the exurban counties of Loudoun and Prince William in their own districts. From a community-of-interest standpoint, I don’t really like drawing the 10th from the far exurban parts of Loudoun county all the way to the Arlington county border. I think you were trying to minimize county-splits, though, in which case your map of NoVA would work best.
Here’s my VA map intended as something a court might draw.
The Norfolk area districts are almost identical to yours down to having majority-black VA3 pick up Petersburg. Instead of having one district for Richmond and its close suburbs I had VA4 take it along with its southern suburbs and exurbs. It’s about D+5. VA7 ended up a little screwy going from the Richmond city limit all the way to the northern border, but I wanted to get all of the Roanoke area into VA6 which prevented it from taking those 2 counties at the north end of VA7.
I split the DC area north-south-east with VA10 taking Loudoun and Fairfax generally north of I-66 and VA11 taking most of Prince William. VA10 is listed as dead-even but I think it’s actually about D+3: a number of precincts in that area that have no voting data listed and it shows Loudoun by itself as going to McCain by about 4 points when in fact Obama won it by about 8.
Rough PVIs based only on 2008: VA1 R+4, VA2 R+7, VA3 D+15, VA4 D+5, VA5 R+6, VA6 R+11, VA7 R+8, VA8 D+13, VA9 R+13, VA10 D+3?, VA11 D+3.
I don’t think for a second that Republicans will stall and allow the courts to draw the district lines. Not only would it impact Forbes and Rigell obviously, yet it would also likely put Goodlatte and Griffith in the same district. Not to mention, any court drawn map would make Cantor weak and Wolfe, weaker than weak. It would impact more Republicans than even the Virginia GOP would want.
Dems could push for and receive a new African-American majority district in Richmond. If they present it as a protection plan for Hurt, Cantor, and Wittman, then I think Republicans would have no choice, but to go along with them on it.