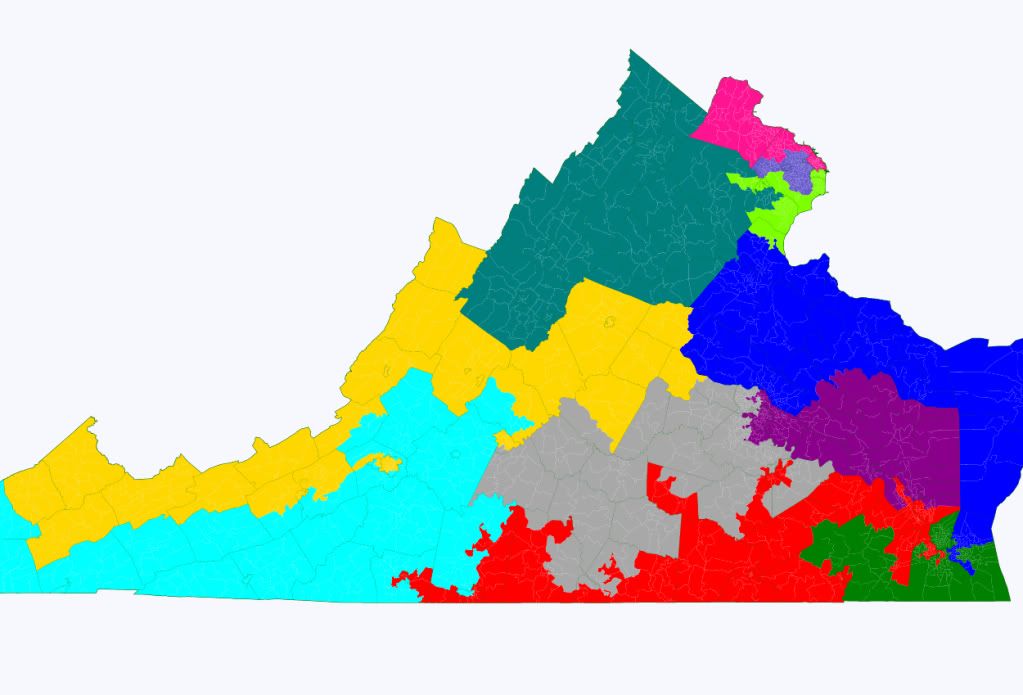
I set out the other day to create a safe 6D, 5R map of Virginia, and found that in fact it’s quite easy to do better.


Going through the districts in order of partisan lean.
Solid D
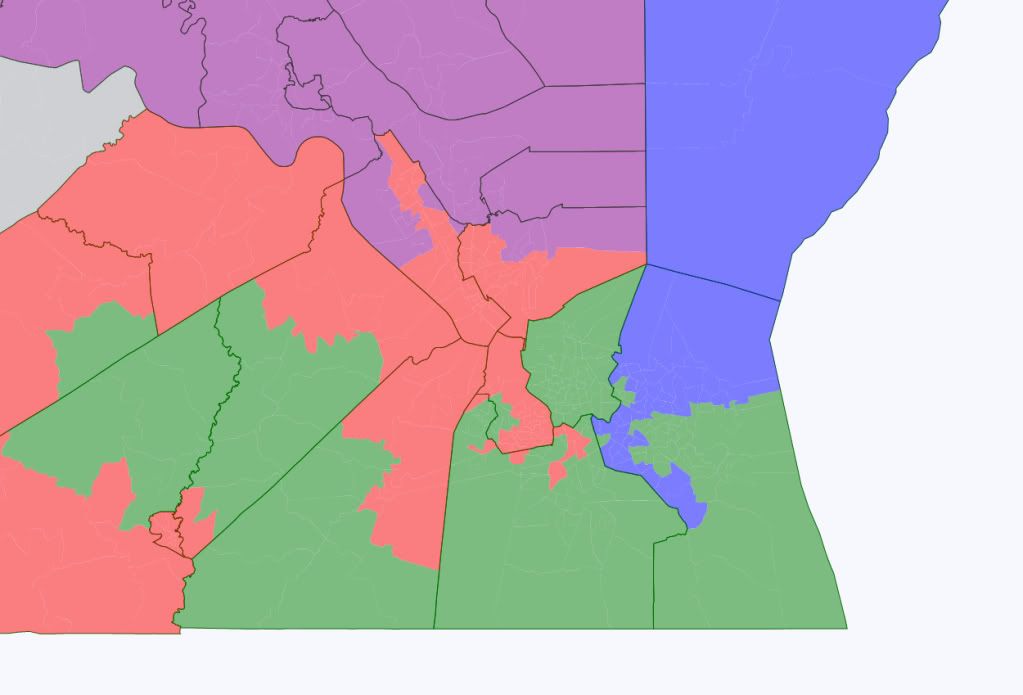
VA-4:
Red district in Southside, Hampton Roads
52% Black, 39% White
67.8% Obama, 63% Democrat
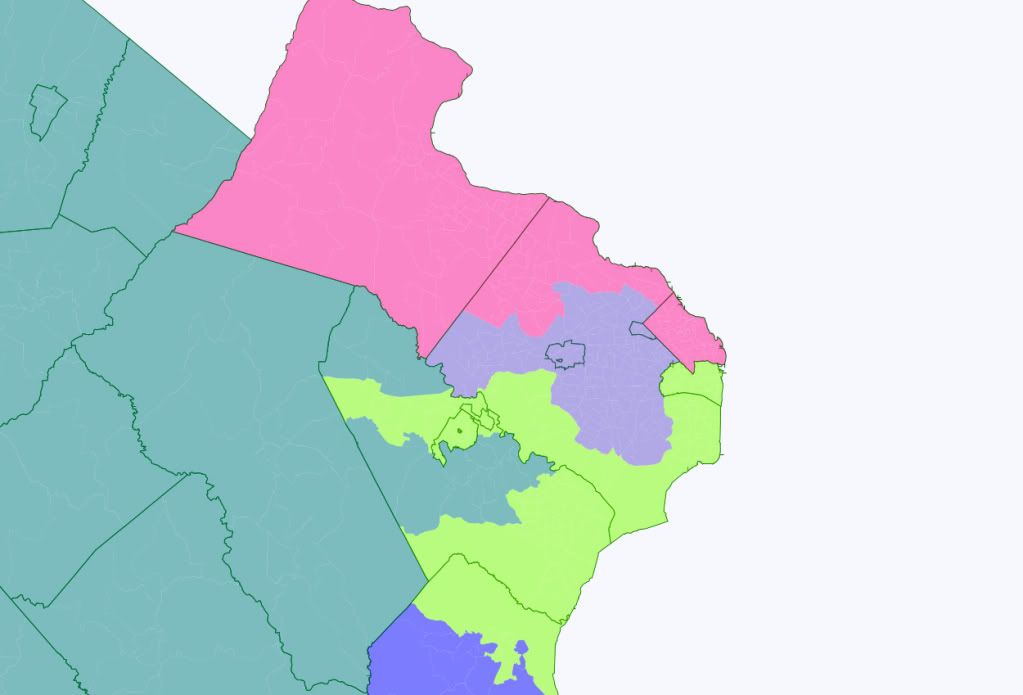
VA-11:
Greenish district in NOVA
48% White, 20% Black, 21% Latino
63% Obama, 57% Democrat
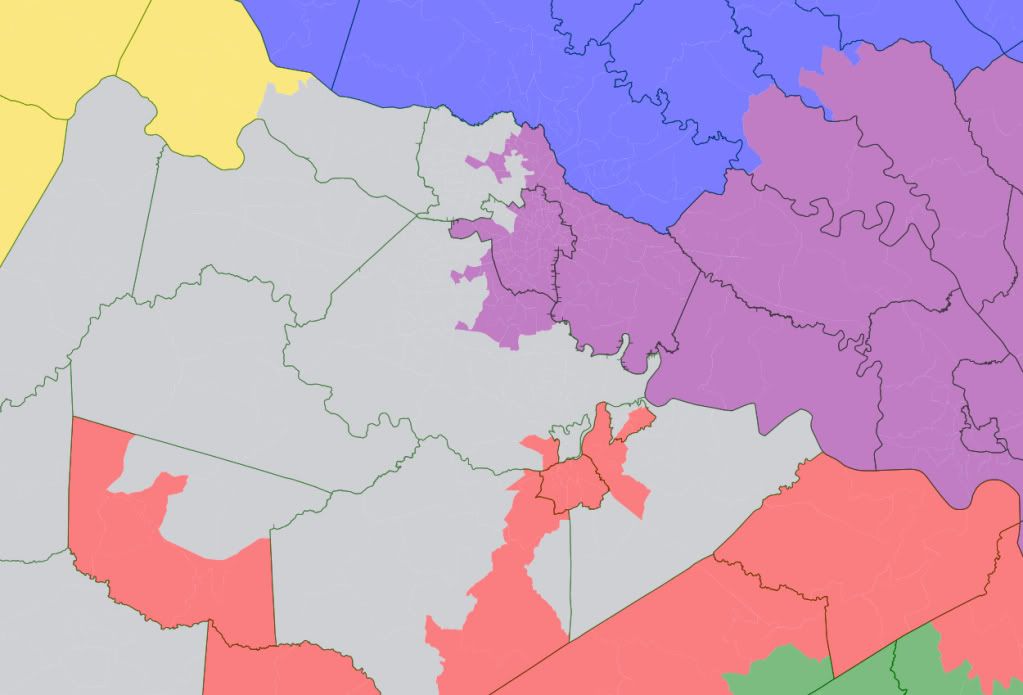
VA-3:
Purple district based in Richmond
53% White, 35% Black
62.2% Obama, 58.5% Democrat
VA-8:
Purple district in Fairfax county
54% White, 19% Asian, 17% Latino, 8% Black
59.9% Obama, 56.2% Democrat
Likely D
VA-10:
Pink district in Loudoun, Fairfax, and Arlington
57.1% Obama, 57.3% Democrat
Lean D
VA-2:
Green district in Hampton Roads
56.2% Obama, 53% Democrat
VA-5:
Yellow district in West
53.6% Obama, 53.7% Democrat
Solid R:
VA-1:
Blue diestrict in Eastern Virgina
55.8% McCain, 58% Republican
VA-7:
Grey district in Southside/Richmond suburbs
60.2% McCain, 62.1% Republican
VA-6:
Turquoise district based in Shenandoah valley
58.9% McCain, 62.2% Republican
VA-9:
Light blue district in Southwestern Virginia
64.5% McCain, 61.8% Republican.
Admittedly, although favored, Democrats could lose VA-5, VA-2, and VA-10 in the right election, giving them only four absolutely solid seats. That said, historically Republicans have been very unlikely to hold onto southern seats with any sort of Democratic lean.
Thoughts?
I think still we would have margin for bid a 8D+3R map with districts like D+5 or a little better.
Looking to your map, I think Virginia gives the chance for a good Gerrymander finding the limits without do a ugly map.
I would suggest you mix a little your red and your green (South East) districts making the green a little safer.
I like very much to see more people finding good maps for the democrats.
This map help showing the strong pro-republican biass of the current map.
I like the map. But if my NC map with R+4 or better seats wasn’t safe enough in the eyes of just about anyone, then your Likely and Lean D seats also need shoring up. I mean, VA-5 is pretty much D+0, that’s a toss-up.
Your VA-05 is particularly nice. In terms of your VA-10, my experiments with NoVA suggest that the best results for the Democrats puts all of Prince William in NoVA districts and splits Loudoun between NoVA and the Shenandoah.
Inspired by your map, I tried to figure out a maximal Democratic map for Virginia (which is probably code for dummymander). Here’s my result:
VA-01
blue in eastern VA, abusing water contiguity (which is kosher by VA law, I believe)
Obama 54.4%, Democratic 50.1%
VA-02
green in Hampton Roads
Obama 54.6%, Democratic 51.3%
VA-03
purple in southern VA (should be VA-04 for comparison to current districts)
Obama 53.0%, Democratic 50.8%
VA-04
red connecting Richmond to Hampton Roads (should be VA-03 for comparison to current districts)
Obama 71.0%, Democratic 66.9%
VRA: 50.2% African American, 47.9% African American VAP
VA-05
yellow in western VA
Obama 53.3%, Democratic 53.2% (consistent!)
VA-06
teal in northwest VA
Obama 41.1%, Democratic 38.1%
VA-07
gray in central VA
Obama 38.3%, Democratic 36.9%
VA-08
blue in NoVA (Alexandria, central Fairfax)
Obama 60.6%, Democratic 57.8%
VA-09
light blue in southwest VA
Obama 34.3%, Democratic 37.2
VA-10
pink in NoVA (Arlington, north Fairfax, southern Loudoun)
Obama 59.4%, Democratic 58.8%
VA-11
green in NoVA (Prince William, south Fairfax)
Obama 59.8%, Democratic 53.4%
Overall, it creates four safe to likely Democratic, four lean Democratic to tossup, and only three safe Republican districts. If merely making minority white rather majority black districts satisfied the VRA (which I don’t believe it does), it would be really easy to shore up VA-01, VA-02, and VA-03 — while probably ending up with more minority-white districts.