As has been thoroughly discussed in other diaries, New York is likely to lose one House seat in the 2010 census. And given the population trends, the district likely to disappear will be upstate. This presents a problem for Democrats, who now control all but one seat there. If the Democrats keep their monopoly on state government in 2011, they will need to make some uncomfortable compromises: unless a seat is somehow removed from downstate, they will either have to leave one incumbent Democrat without a seat to run in or weaken all upstate Democrats in order to remove Chris Lee. Keeping in mind the pitfalls of the “Dummymander” (PDF), I have made the following choices:
1. To “pair” two upstate Democrats in one seat;
2. To ensure that all downstate seats are safe for current or future Democratic incumbents, including the ones that are not currently safe;
3. To give all but one upstate upstate Democrat a familiar seat that s/he can win;
4. To the extent possible, pack upstate Republican voters in Chris Lee’s seat; and
5. To comply with all contest requirements.
Follow me below the fold for maps, data, and discussion. . .
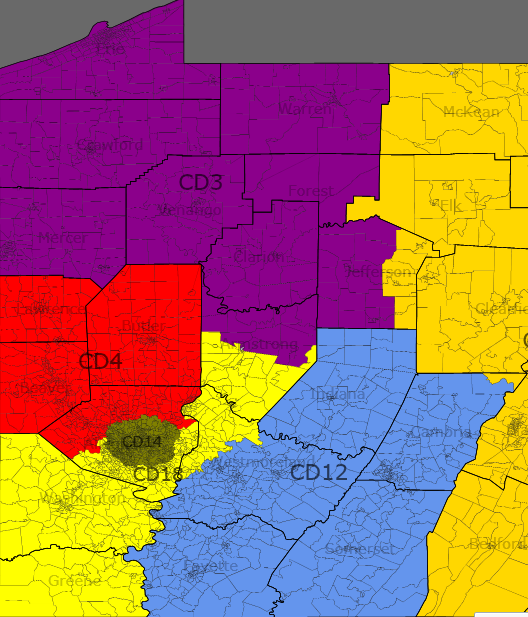
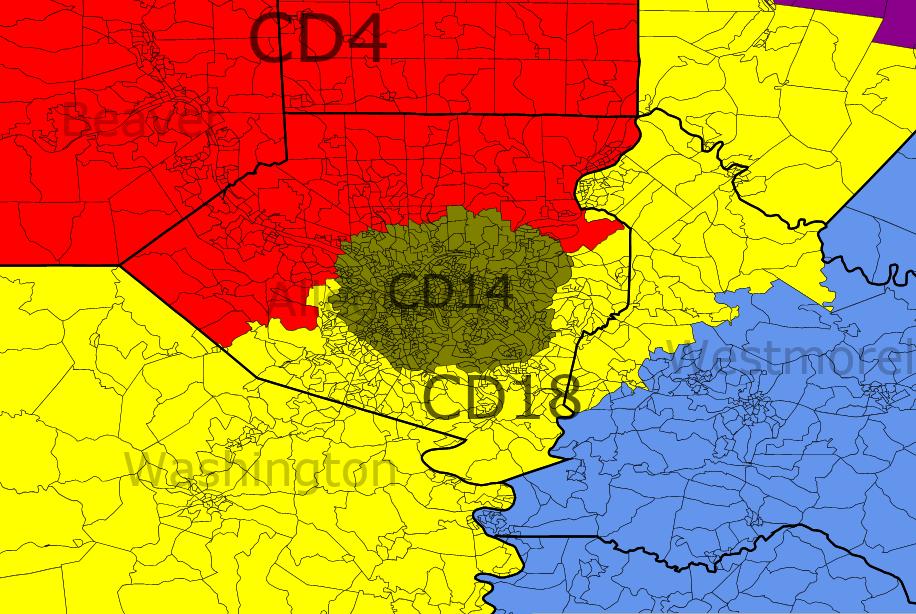
As a preliminary matter, I will refrain from “hiding the ball” and share overview maps; one for upstate, and another for downstate. In the city especially, districts can be difficult to make out, but I will attempt to clarify below.
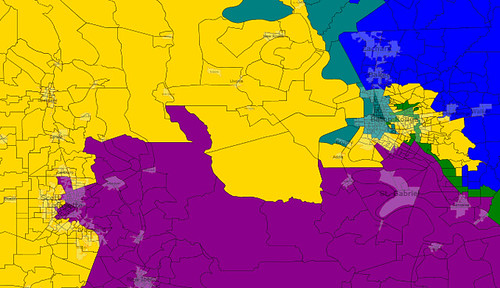
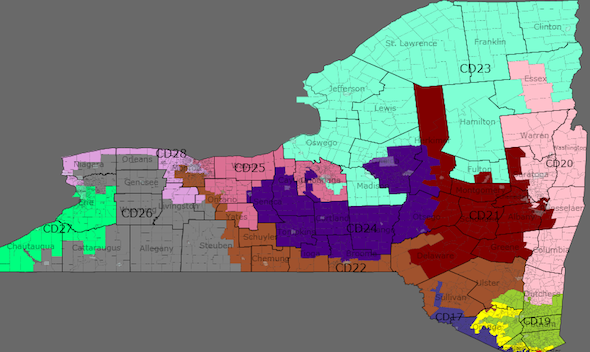
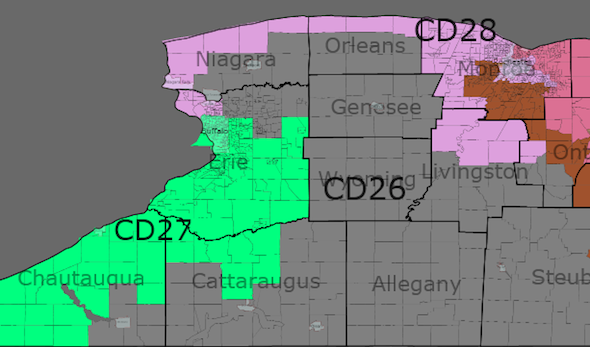
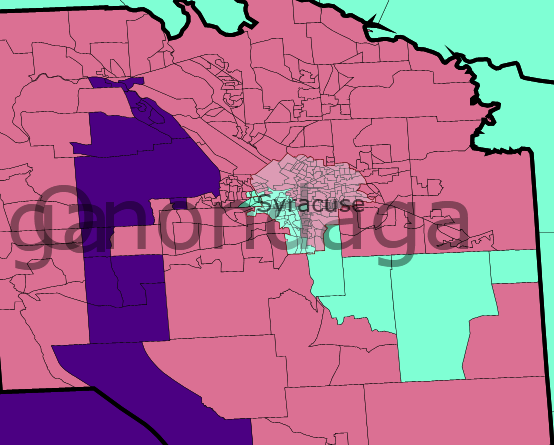
Upstate Overview:
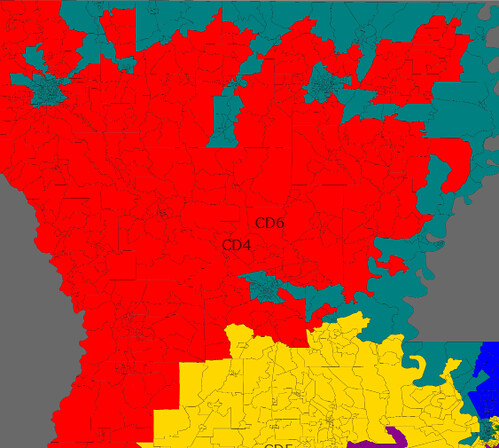
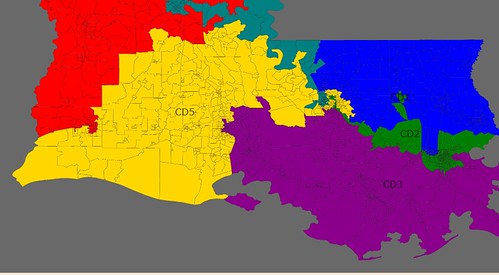
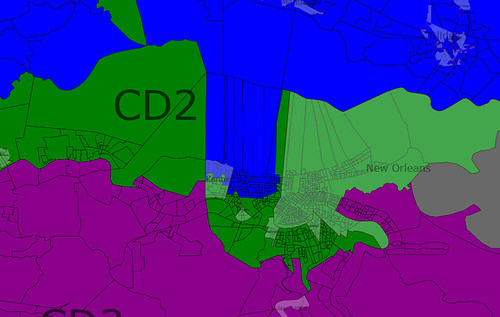
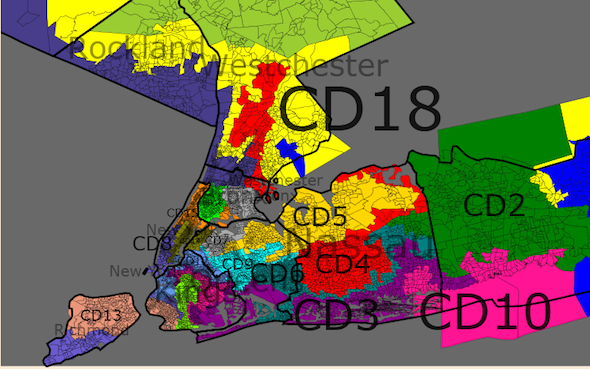
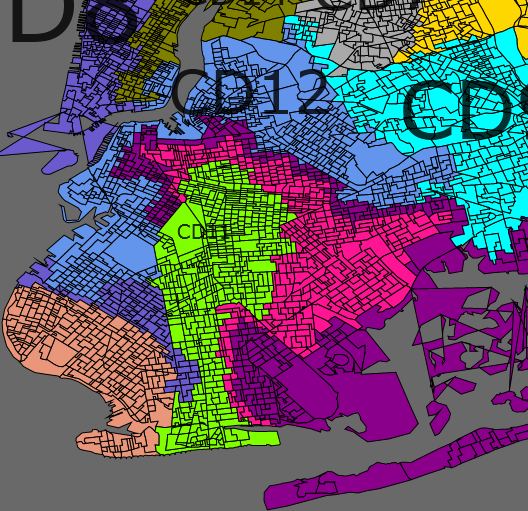
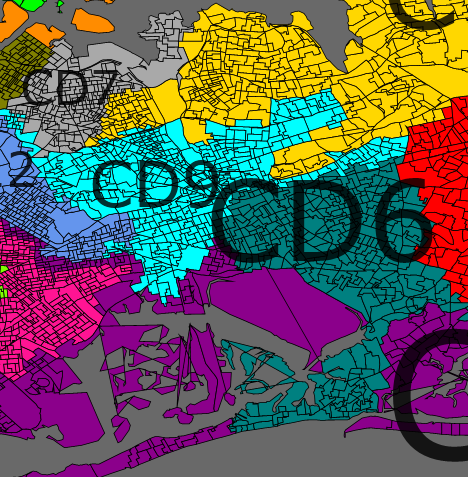
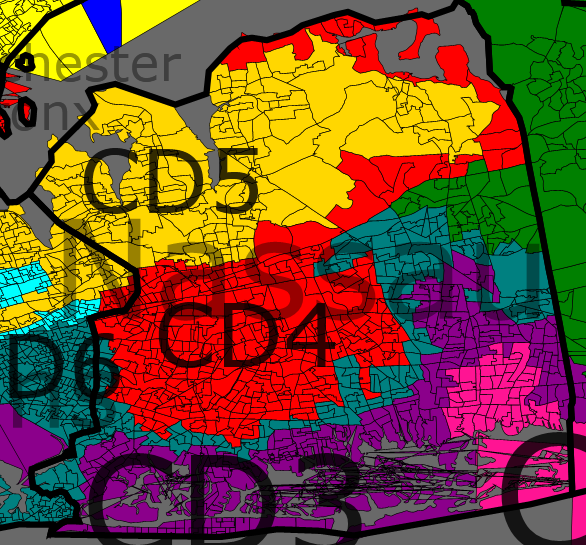
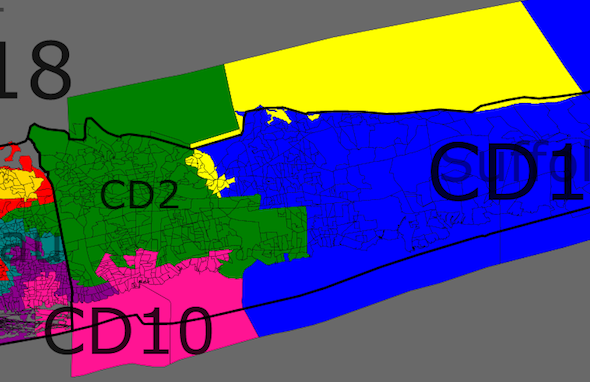
Downstate Overview:
In general, my discussion will move from west to east, and from upstate to downstate. By no coincidence, this means that higher-numbered districts will be discussed first. We begin, therefore, with western and central New York.
| District | Population | Black% | Hispanic% | Asian% | Obama Votes | McCain Votes | Obama% | McCain% | Swing From 2008 Map |
| 28 | 699,770 | 13% | 5% | NA | 191,081 | 130,799 | 59% | 40% | R+20% |
| 27 | 699,850 | 15% | 4% | 1% | 192,759 | 123,020 | 60% | 38% | D+12% |
| 26 | 700,982 | 3% | 2% | 1% | 146,555 | 172,357 | 45% | 53% | R+2% |
| 25 | 699,439 | 5% | 2% | 2% | 187,103 | 154,111 | 54% | 44% | R+3% |
| 24 | 700,615 | 3% | 2% | 2% | 158,656 | 136,049 | 53% | 45% | D+5% |
| 22 | 700,635 | 4% | 3% | 2% | 174,645 | 147,498 | 53% | 45% | R+12% |
Who loses?
Eric Massa currently represents NY-29. In a map with 28 districts, there can obviously no longer be one numbered 29, but by no coincidence, on my map there is also no corresponding district. Massa’s Corning home is now in NY-22, which reaches from the NYC suburbs all the way north to Monroe county and the Rochester suburbs. Maurice Hinchey continues to live in NY-22, and retains most of his political base. However Ithaca is removed and given to NY-24 to strengthen Michael Arcuri. Thus Massa and Hinchey are the two Democratic incumbents I have chosen to pair. My best guess is that Hinchey would retire rather than face this map. I expect that Massa would fare well here. In any case, one of the two must go. For population equity, and (again) to strengthen Arcuri, Dan Maffei’s NY-25 (Syracuse, Wayne, Monroe) is three points more Republican than before. This was one of the more frustrating aspects of my map. However, the district is substantially as it was before, Maffei retains his Syracuse base.
What remains?
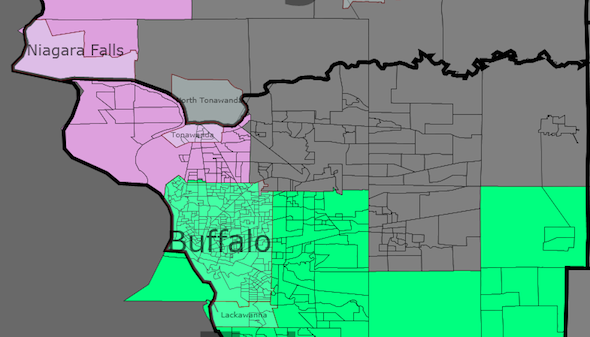
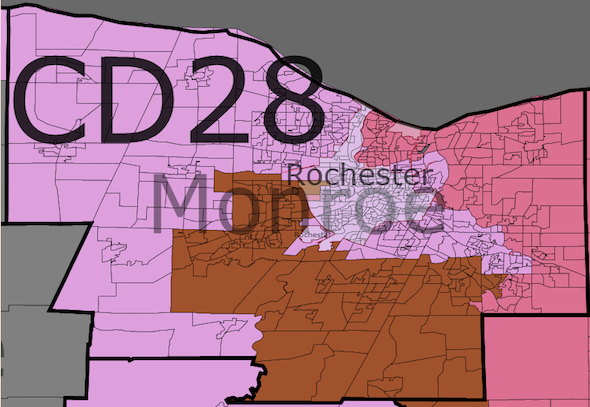
From a thousand miles away, it looks as though I have retained the much-derieded “earmuff” district (i.e. NY-28). However, it is substantially different from before. Louise Slaughter retains most of Rochester (i.e. her base) and Niagara falls, but gives up her half of Buffalo. This is sufficient to cause a 20% Republican swing in NY-28. But Neither Slaughter nor her successors should worry: Obama still won the new district 59/40%. In return, Brian Higgins’s NY-27 picks up the rest of Buffalo, and his district swings 12% more Democratic, making it a safe seat. Chris Lee’s NY-26 (Erie, Wyoming, Allegany, Monroe) expands substantially, picking up all of the nasty bits and becoming two points more Republican. I could have made Lee’s district even more Republican, but this would have required (a) touch-point contiguity (not allowed in this contest), or (b) substantially reconfiguring NY-25, NY-24, and NY-23. I considered option (b), but decided against it mainly because I thought there was real value in leaving the cores of existing districts intact. I believe the incumbents would agree. Finally in this region, NY-24. Michael Arcuri had a close call here in 2008. So he gets a district that is 5% more Democratic. To provide for this, I removed the most Republican precincts to the east and added Ithaca. I would not call the 24th safe, but for Arcuri it should be substantially improved.
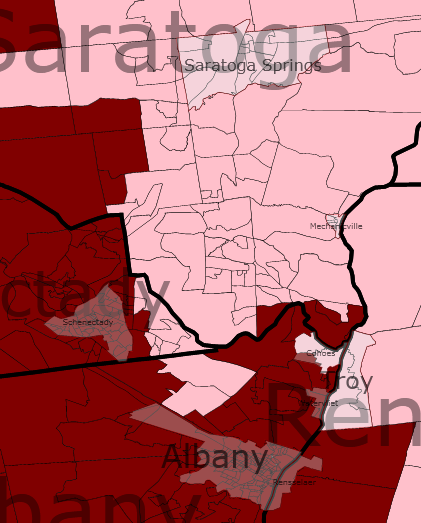
We proceed to eastern Upstate:
| District | Population | Black% | Hispanic% | Asian% | Obama Votes | McCain Votes | Obama% | McCain% | Swing From 2008 Map |
| 23 | 699,639 | 4% | 2% | 1% | 146,382 | 125,538 | 53% | 45% | D+3% |
| 21 | 699,912 | 6% | 3% | 2% | 183,489 | 140,360 | 56% | 43% | R+5% |
| 20 | 700,285 | 4% | 3% | 1% | 176,803 | 149,128 | 53% | 45% | D+5% |
(Note that for the sake of space, I will not reproduce images from above).
Who loses?
Paul Tonko’s NY-21 (Albany, Schenectady, Montgomery) becomes 5 points more Republican. However, at 56/43 Obama, it is still reasonably comfortable for him. And in the event, he retains almost all of his former territory. Suffice to say that if Democrats are having trouble in this district, they are likely losing the House of Representatives.
What Remains?
NY-23 (Jefferson, St. Lawrence, Clinton) becomes 3 points more Democratic, and NY-20 (Saratoga, Dutchess) swings 5 points D. Both land at 53/45 Obama. Bill Owens and Scott Murphy both won their special elections in districts that were substantially the same, except more Republican (the 23rd also picks up some Syracuse precincts). If Owens and Murphy cannot win in these districts as I have strengthened them, then one or both should be sacrificed in redistricting. In that respect, 2010 should be revelatory.
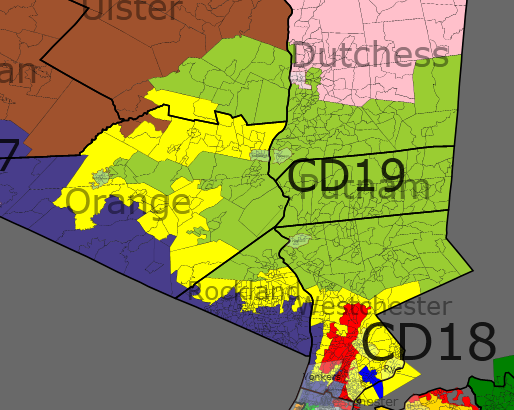
The march south continues with a look at NYC’s northern suburbs:
| District | Population | Black% | Hispanic% | Asian% | Obama Votes | McCain Votes | Obama% | McCain% | Swing From 2008 Map |
| 19 | 700418 | 7% | 10% | 2% | 170,996 | 139,646 | 54% | 45% | D+6% |
| 18 | 700,555 | 10% | 15% | 4% | 165,531 | 118,461 | 58% | 41% | R+7% |
| 17 | 700,144 | 27% | 18% | 4% | 175,408 | 80,686 | 68% | 31% | R+7% |
Who loses?
NY-18 takes the greatest hit here, becoming 7 points more Republican, and even reaching down into Long Island. But Nita Lowey has very little to be concerned about. Her Westchester base, though reduced by being parceled out to several surrounding districts, is largely intact. And at 58/41 Obama, it is difficult to imagine a serious Republican challenge. As above, if there’s a tidal wave here, NY-18 is not the first district Dems will need to worry about.
What Remains?
John Hall’s NY-19 (Putnam, Dutchess, Westchester) gets the biggest boost, becoming 6 points more Democratic. It’s probably fair to say that Sue Kelly is out of the running for good. And because the core of Hall’s existing district is retained, he won’t need to worry about unfamiliar and hostile territory. NY-17 does take on some more hostile territory in Sullivan county, but at 68% Obama, Eliot Engel should not lose much sleep.
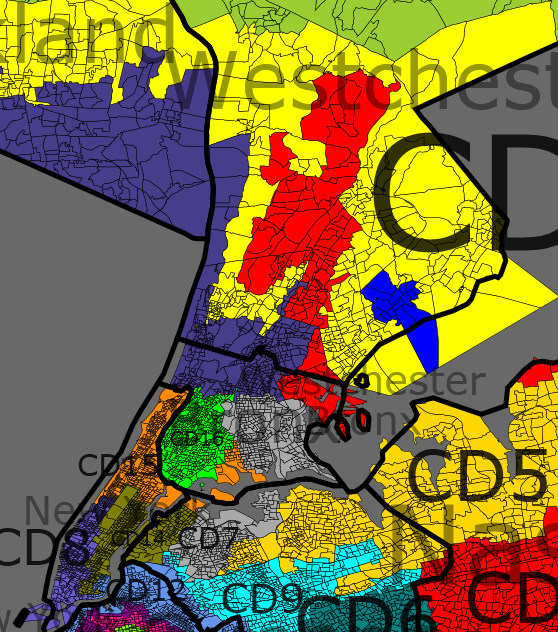
Finally, we protect Michael E. McMahon and make Peter King walk the plank. Into the city!
| District | Population | Black% | Hispanic% | Asian% | Obama Votes | McCain Votes | Obama% | McCain% | Swing from 2008 Map |
| 16 | 701,167 | 30% | 63% | 2% | 160,961 | 8821 | 95% | 5% | 0 |
| 15 | 699,479 | 31% | 50% | 3% | 218,488 | 13,982 | 93% | 6% | 0 |
| 14 | 700,439 | 6% | 14% | 13% | 217,459 | 54,510 | 79% | 20% | D+2% |
| 13 | 700,540 | 9% | 13% | 12% | 108,539 | 85,063 | 56% | 44% | D+14% |
| 12 | 700,623 | 12% | 49% | 10% | 168,574 | 23,627 | 87% | 12% | D+2% |
| 9 | 699,725 | 8% | 21% | 18% | 130,195 | 61,300 | 68% | 32% | D+25% |
| 8 | 700,774 | 3% | 10% | 10% | 192,868 | 84,698 | 69% | 30% | R+9% |
| 7 | 701,294 | 14% | 40% | 14% | 141,199 | 39,762 | 78% | 22% | R+3% |
| 5 | 699,981 | 4% | 22% | 23% | 135,473 | 86,728 | 61% | 39% | R+5% |
The City, Continued:
| District | Population | Black% | Hispanic% | Asian% | Obama Votes | McCain Votes | Obama% | McCain% | Swing From 2008 Map |
| 11 | 700,323 | 50% | 10% | 6% | 166,981 | 39,649 | 80% | 19% | R+21% |
| 10 | 700,640 | 50% | 10% | 2% | 197,163 | 61,690 | 76% | 24% | R+30% |
| 6 | 701,002 | 51% | 13% | 4% | 206,280 | 55,143 | 79% | 21% | R+20% |
| 3 | 700,343 | 16% | 12% | 4% | 168,982 | 112,455 | 60% | 40% | D+25% |
| 4 | 700,408 | 17% | 12% | 6% | 191,113 | 130,871 | 59% | 40% | D+2% |
| 2 | 700,451 | 9% | 14% | 3% | 167,660 | 132,736 | 56% | 44% | R+1% |
| 1 | 699,901 | 4% | 8% | 2% | 163,358 | 144,040 | 53% | 47% | D+2% |
(Note: sorry about the strange table format just above.)
Everything is tied together to some degree here, so I will shift my categorization from above.
Without a doubt, Peter King (NY-3) is the biggest loser. His new district, if you can cal it that, is the purple one that sprawls over my three downstate images from Long Island into Brooklyn. NY-3 is now a 60% Obama district, and probably out of reach for the Republicans (that makes this a 27-1 map). So how did I do it? In a nutshell, I made him walk the plank.
First, I protected the existing white Democrats downstate. Tim Bishop’s NY-1 (Suffolk,The Hamptons) and Carol McCarthy’s NY-4 (Nassau, Hempstead) both reach out over Long Island Sound into Westchester, but are otherwise substantially the same as before. Gary Ackerman’s NY-5 (Great Neck) is barely changed from before. NY-9 (Queens) is quite strengthened. Whites are now just a plurality, but Weiner keeps his home base, so he should be safe. I made some changes around the edges of NY-2 (Suffolk, Plainview), but nothing that should phase Steve Israel.
Keeping in mind my goal of not disturbing the Democratic incumbents, I at first thought that it might not be possible to sufficiently weaken NY-3 with what was left, considering the accommodations needed for VRA districts. With touch-point contiguity, it would have been a fairly quick job, but without that I had to take some care. The problem is that there are a number of contiguous Nassau and Suffolk precincts that are very white and very Republican. (i.e., King’s base). They would have to be parceled out among the VRA districts, but how? First, NY-11 picks up all of the Republican territory possible in Brooklyn, becoming 21% more Republican. But Yvette Clarke retains here home base and her black majority, so she’s in no trouble.
Now the fun part. NY-10 is still based in Brooklyn and majority black. But it is a whopping 30% more Republican now. How? It reaches across Jamaica Bay into Nassau and Suffolk (I like to think of this as the Republican ferry). Towns is still safe, but King is sunk. Most of the rest of former NY-3’s territory is vacuumed into Greg Meeks’s NY-6 (still black majority and based in Queens, but now reaching accross Nassau to touch Suffolk). NY-3 is thus drawn towards Brooklyn, and more Democrats.
I deal with Staten Island in a similar way. Nadler’s NY-8 retains the Upper West Side (and my present apartment), and hugs a shipping lane near New Jersey to Raritan Bay and the southern tip of Staten Island. Lots of Republican precincts there go to NY-8, but as you can see from the chart above, Nadler is in no trouble (he also retains his Republican Brooklyn precincts, but he never had trouble there before, so far as I know). NY-13 gets a big boost, taking on much more of Brooklyn. But it’s not so mangled that Staten Islanders are likely to take out blame on Michael McMahon, who now has a solid Obama district.
Wrapping up, NY-14 (the Upper East Side) is much the same, as is NY-12 (Queens, Brooklyn), so Maloney and Velázquez should be happy. In the rest of the city, my no-change-broken-record continues. Crowley’s 7th (Parkchester, Jackson Heights) is sitting pretty. Rangel’s NY-15 is now about 50% Hispanic, but that is because of demographic changes in Harlem, not my fiddling. Serrano’s ultra-Bronx 16th is as it was, and retains the required Hispanic supermajority. All should be pleased with their very familiar districts.
The political trends were in my mind as I drew this map, and to be honest I am still uncomfortable with upstate. But I think there are at least a few solid districts up there, and even if Republicans make gains, they will not be riding back to the majority on this map on the basis of New York wins.