SSP Daily Digest: 3/25

CA-Sen (PDF): The Field Poll also has approvals and re-elects for Dianne Feinstein. The former stands at 48-33 (more or less in line with her historical averages), while the latter comes in at 46-42 (somewhat below her scores at similar points prior to her previous re-election campaigns). One aside: Is it normal for the Field Poll to go into the field for a two-week period? The dates on this survey are Feb. 28-March 14.

FL-Sen: God, Mike Haridopolos really is such a joke. He’s now had to amend his financial disclosure forms a third time, because he somehow keeps forgetting to account for all the sources of his income. You have to be pretty rich and disconnected not to remember where you’re getting all your money from. So in other words, Haridopolos is a perfect GOP exemplar. (He claims he didn’t disclose the property in question because his mortgage payments exceed the rent he’s taking in… but ya know, he’s still getting checks in each month!)

NM-Sen: GOP Lt. Gov. John Sanchez tells Le Fixe that he is “very close” to getting into the Republican Senate primary and will decide “very soon.”

OH-Sen: Quinnipiac has some numbers out on Sherrod Brown. He has a 43-27 job approval (in January, it was 45-25); a 45-29 lead over Generic R (Jan: 45-33); and almost identical 45-30 re-elects (unchanged). President Obama gets 41-34 over Generic R, but just 45-46 re-elects.

Meanwhile, Dave Catanese caught up with Ken Blackwell, who says he’s intrigued by PPP’s recent smorgasbord poll of the Ohio GOP primary showing him “leading the way” with all of 21% and now plans to take a “serious look” at the race. Hey, thanks a lot, Tom Jensen! No, I really mean it! Ken Blackwell would be entertaining, and he’s also not exactly a very strong candidate. PPP should goad more also-rans into re-thinking their futures.

VA-Sen, VA-03: Dem Rep. Bobby Scott visited Larry Sabato’s class the other day and said he’s still thinking about running for Senate and will decide by July. Scott also called Obama’s actions in Libya “unconstitutional”… hrm. Anyhow, Blue Virginia also notes that Scott could potentially take advantage of an obscure state law which would allow him to run in two primaries at once, meaning he could, say, run against Tim Kaine in the Senate race but if he gets pounded, could hold on to his House seat.

MT-Gov: I wonder what the connection is here: very temporary former Florida Sen. George LeMieux is holding a fundraiser for businessman Neil Livingstone in DC next month. Livingstone is one of several Republicans seeking to replace outgoing Gov. Brian Schweitzer next year. I’m really curious to know why LeMieux is taking an interest in this race.

NH-Gov: I don’t know if Papa Sununu is merely running off his mouth, or if he actually knows something. But he seems to suggest that Dem Gov. John Lynch, already serving a highly unusual fourth two-year term, might seek a fifth next year. He also tosses out a few names for potential Republican challengers: 2010 nominee John Stephen, 2010 Senate primary loser Ovide Lamontagne, state Sen. (and ex-Rep.) Jeb Bradley, and ex-State Sen. Bruce Keogh.

WA-Gov: Seattle Magazine has a lengthy profile of King County Executive Dow Constantine, whose name you occasionally hear mentioned in the gubernatorial context despite most people’s assumptions that Rep. Jay Inslee has first right of refusal on the Dem nomination. The article mentions unnamed insiders who think that Constantine may a better choice than Inslee (whose district’s center of gravity is in Snohomish County) for beating AG and former King County Councilor Rob McKenna. McKenna-unlike any other possible Republican candidate-is capable of winning over suburban moderates in east King County, the only possible road for a Republican to win statewide. (The 49-year-old Constantine’s gubernatorial timeline might be more appropriately 2020… though he has three times as many constituents as Inslee, so he may have the leverage to cut to the front of the line.) Speaking of McKenna, he’s on Step 2 of his Quasi-Moderate Reboot following his attempted equivocation on HCR repeal: now he’s also distancing himself from the new GOP boogeyman Scott Walker, saying he’d never mess with collective bargaining rights.

CA-36: It’s looking like Gov. Jerry Brown’s hoped-for statewide special election on ballot proposals to extend certain tax measures may not happen in June after all, which means the race in the 36th could stand all alone-and face even lower turnout than might otherwise have been expected.

FL-26: We mentioned (thanks to Greg Giroux) Karen Diebel’s unusual FEC filing the other day-she says she plans to run in the non-existent “FL-26.” Now, says Dave Catanese, NRCC chair Pete Sessions was seen squiring Diebel around DC, taking her to a meeting of House Republicans, and raising some eyebrows in the process, seeing as she lost to now-Rep. Sandy Adams in the FL-24 GOP primary last year. Diebel must be hoping that a new Orlando-based district carves out some room for her.

MN-06: If god really loved us, Michele Bachmann would run for pretzeldent. And now she’s saying it just might happen!

Ohio Init.: Here’s what’s going to happen: the Republicans who are busy destroying themselves in Ohio will pass SB5, a bill designed to strip away collective bargaining rights from union members. Then unions and their supporters will get a referendum on SB5 placed on the ballot. If polls and history (see 1958) are any guide, SB5 will get overturned. Republicans, of course, don’t want that to happen, and at least some of them think they stand a better chance if the measure goes up for a vote this November, rather than next November. For that to happen, Gov. John Kasich needs to sign SB5 into law by April 6th. But the Republican Speaker of the House isn’t so sure 2011 will be better for the GOP than 2012, and I’m not sure I disagree with him.

Suffolk Co. Exec.: This sure is an unusual way to end a criminal investigation-and a political career. Steve Levy said he won’t seek re-election to his current post… and he’s turning over his $4 million warchest to the Suffolk Co. DA’s office, which had been probing him for campaign finance violations. Of course, Levy’s political suicide really began in earnest last year, when the one-time Democrat tried to change parties to run for the GOP nomination for governor… only to get dinged at the Republican convention. Quite the capper to an ignominious career best known for immigrant-bashing.

Wisconsin Recall: Democrats now say they have “over fifty percent of the number of petitions they need to recall eight Republican state senators, although they are not over the fifty percent threshold in every district.”

Meanwhile, the Randy Hopper mistress story keeps getting better. It now looks as though his paramour managed to avoid the formal recruitment process that normal people went through in order to land state jobs during the transition period after Gov. Scott Walker was elected. Despite that, she scored a gig, and a pay raise.

WI Sup. Ct.: The Capital Times has a detailed profile of the Wisconsin Supreme Court race, noting in particular the increased enthusiasm for getting rid of David Prosser in light of Scott Walker’s evildoing. Prosser, by the way, continues to blame his fellow women justices for the lack of civility on the court, now claiming that they’ve “ganged up” against him. Remember this, is the guy who screamed at the Chief Justice that she was a “bitch” and he’d “destroy” her.

Models: Nate Silver critiques Harry Enten’s house forecasting model that we mentioned here the other day, saying that Enten has too many variables and not enough data sets. Enten responds here.

WATN?: We mentioned the Idaho GOP’s move to a close primary system a little while back, but I’m linking this article because I was unaware that 2008 ID-01 Dem nominee Larry Grant is now the chair of the Idaho Democratic Party. Grant lost to the infamous Bill Sali in 2006 by a relatively tight 50-45 margin.

Redistricting Roundup:

Arkansas: One place where, seemingly against all odds, Dems control the redistricting trifecta is Arkansas. The only Democrat left in the House delegation is Blue Dog d-bag Mike Ross, and he’d apparently worked out a map with his colleagues in the legislature that would protect his 4th CD seat, but also continue to make the 1st and 2nd CDs (now held by Republicans) potentially competitive. But according to Blue Arkansas, at the last minute, Ross changed his mind and insisted on a plan which would shore up his own district at the expense of the other two. Blue AR says this was particularly galling, because, they say, Ross has been telegraphing his plans to run for governor in 2014. However, Ross didn’t get his way: a little tinkering was done, but not enough to materially change the original plan. Anyhow, I believe that the map in question can be viewed here.

Louisiana: I don’t think there’s much if anything new here, but Politico seems increasingly convinced that Rep. Jeff Landry is on the verge of getting screwed. This of course would not be a surprise, as the teabagging freshman is definitely the low man on the totem pole.

SSP Daily Digest: 3/24

AZ-Sen: Rep. Jeff Flake, long known for his non-insane stance on immigration, has bluntly announced that he’s flip-flopping. Just like John McCain before him, Flake says he no longer supports comprehensive immigration reform and now just wants to discuss border security. Clearly, Flake is terrified of getting teabagged in the senatorial primary, even though he doesn’t have any actual opponents yet. I suspect that Rep. Trent Franks (or someone else with strong movement conservative bona fides) will get into the race, though, and I doubt that Flake’s last-minute conversion will incline the teabaggers to forgive him.

And I also wonder if it might not tick off his patrons at the Club for Growth, who just proudly announced that they’ve raised $350K for him. The CfG is backed by people and organizations who are what you’d call “cheap labor conservatives.” That is, they prefer to see a steady flow of illegal immigrants because they represent a ready pool of workers they can cheaply exploit. The kind of immigration reform that Flake once favored also pleased his corporate masters, because it would have created a temporary worker program-almost as good, but blessed by the law! I doubt that the CfG, which pushed Flake hard to get into the race (and immediately endorsed him once he did) will abandon ship over this offense, but maybe they’ll start focusing their energies on more reliable stooges.

FL-Sen: I’m really glad that Mike Haridopolos is the only announced Republican candidate of any note because he’s such a walking train-wreck (if you can visualize such a thing)-almost every new story about him is yet another disaster. His eye for optics is particularly atrocious: In his role as President of the state Senate, he just removed a piece of ethics legislation from the body’s agenda-despite having co-sponsored the very same bill last year. Even better, you may recall that Haridopolos was just admonished by the Senate for failing to properly disclose his finances on required forms. I love this guy!

MI-Sen: A Republican firm who seems to be affiliated with ex-Rep. (and potential candidate) Pete Hoekstra, Strategic National, released bits and pieces of a survey to Dave Catanese. They claim that Dem Sen. Debbie Stabenow’s approval rating is just 30-38, in contrast with PPP’s poll from yesterday which had her at 46-39. The only head-to-head they released showed Hoekstra trailing just 41-38 (PPP has him back 50-38). To Strategic National’s credit (by the way, we’d never heard of this firm until this year), they released their sample makeup. To their discredit, the sample was 46 R, 44 D & 10 I. In other words, from Mars.

NM-Sen: Could Greg Sowards be the next Christine O’Donnell or Joe Miller? I’d be shocked if you’ve ever heard of this teabagger, but he did spent $300K of his own money to get pasted in the NM-02 primary in 2008. (He also has a fucking funny URL-just Google his name.) With “moderate” Heather Wilson the only big-time candidate in the race so far, a surprising number of winger outfits are giving Sowards a look: He’s in DC visiting with Jim DeMint’s people and the Tea Party Express, among others. Sowards also appeared to get under Rep. Steve Pearce’s skin by saying he didn’t think Pearce would run for the Senate again. Click the link for Pearce’s prickly response.

NV-Sen: Rep. Shelley Berkley (D) will be keynoting the Jefferson-Jackson dinner in rural Churchill County this Friday, which either means she’s spreading out her feelers for a statewide run, just doing someone a favor, enjoys spending time way up in the northern part of the state, or absolutely nothing.

OH-Gov: On top of spaghetti, all covered with cheese, I saw John Kasich, and his poll numbers sucked. Quinnipiac sez he’s at 30-46 approvals, while GOP-affiliated pollster We Ask America says he’s at an astoundingly bad 35-58. Q also asked about SB5 (the anti-union bill) with a couple of different wordings; either way, voters are opposed.

WV-Gov: State House Speaker Rick Thompson’s been cleaning up with the union endorsements (teachers, AFL-CIO), and now he’s racked up a huge one: the United Mine Workers of America.

AK-AL: This story is so disturbing, I won’t even attempt to summarize:

A Republican congressman from Alaska, who also is on the board of directors of the National Rifle Association, now is attempting to distance himself from a Fairbanks militia leader accused in a high-profile firearms, murder and kidnapping plot.

In April 2009, with a video camera rolling, Rep. Don Young signed a “Letter of Declaration” being circulated by the Second Amendment Task Force/Alaska Peacemakers Militia, led by Francis Schaeffer Cox. The “declaration” called on “sovereign Americans” to “alter or abolish” any government that tries to “further tax, restrict or register firearms” or prevents individuals from exercising their “God-given right to self-defense [that] precedes all human legislation.”

CA-36: Democracy for America, the activist organization that emerged from the Howard Dean campaign, is endorsing SoS Debra Bowen, though it’s not clear what kind of support they plan on providing. DFA previously endorsed Bowen when she sought re-election to her current job last year.

IL-10: Activist Ilya Sheyman posts a diary to Daily Kos, saying that he’s “considering running” against Republican Bob Dold! in Illinois’ 10th CD.

NY-01: Republican Randy Altschuler, who lost the second-closest House race in 2010 (only IL-08 was closer), will be in DC “for a series of meeting”-and that’s all Roll Call has to say about it. Supposedly this means he’s considering a rematch against Rep. Tim Bishop, but we don’t even know who his meetings are with. Maybe he’s talking to the Brewery Soft Drink Beer Distr Optical Dental Misc Workers Warehouseman Help Local 830 PAC, for all we know.

OR-01: Blue Oregon scored quite the coup: I believe they are the first local print media outfit to get an interview with Rep. David Wu. They say they talked to him for an hour, and promise that they asked tough questions. The contents of the interview will appear in a multi-part series over the next day (just as soon as they finish transcribing). You can read part one and part two now.

SC-05: I don’t think anyone was expecting that ex-Rep. John Spratt, at age 68 and with 14 terms under his belt, would seek a rematch, and indeed he’s not. At an emotional event to honor Spratt’s many years of service, he said that he might teach, or join a DC think tank, but that whatever he does, “it’ll be part-time.” Godspeed.

Mayors: Kansas City, MO elected the awesomely-named Sly James as mayor in a runoff last night; he beat fellow Dem Mike Burke 54-46. And in Tampa, Dem Bob Buckhorn crushed Republican Rose Ferlita by a 63-37 margin.

Campaign Committees: So it looks like the DCCC and NRCC are engaged in a minor skirmish, but with Rahm Emanuel gone, it seems like the Chicago Way means, you come at me with a butter knife, I come at you with a spork. Anyhow, the D-Trip announced it was targeting robocalls and a bit of other media at ten Republicans (click link for districts) regarding Social Security and Medicare, so the NRCC did the exact same thing, except about gas prices. The NRCC also released what it claims is are television ads (but what our friend Nathan Gonzales would call a “video press releases”) against Heath Shuler and Nick Rahall. I’ll bet the amount spent on these buys isn’t enough to buy John Shimkus a meatball sub.

Redistricting Roundup:

California: The new chair of the CA GOP spazzed about the selection of Q2 Data and Research as the redistricting commission’s map-drawing technical consultant, hollering that the firm has ties “to the Democrat Party.” Zing! Only problem is that the commission (which of course includes Republicans) voted 13-0 to pick Q2.

Maryland: Last year, Maryland passed new legislation requiring that, for the purposes of redistricting, the state count prisoners as residents where they last lived, rather than where they are serving their sentences. State agencies just certified a count of 22,000 prisoners, and while some Baltimore-area legislative districts gained a bit as a result, the overall effects were slight. (Side note: The US government refused to share “last known address” data concerning the 1,500 inmates incarcerated in Maryland’s lone federal prison.) The only other states with similar legislation are Delaware and New York; while this information affects local as well as state redistricting efforts, congressional redistricting is based on US Census data, and I’m pretty sure these laws don’t cover that.

Virginia: Winners were announced in the college competition to redistrict the state of Virginia. You can find the maps at the link. I don’t think they got any babka, though.

Mexican Immigrants and the 2012 Mexican Presidential Election

By: Inoljt, http://mypolitikal.com/

There are quite a number of Mexican citizens living in America. Much political attention has been paid to these people by both American political parties. Liberals hope that the votes of their children will carve out a new permanent Democratic majority. Conservatives, on the other hand, relentlessly campaign against undocumented immigrants and “amnesty.”

When immigrant rallies occur, conservative media frequently focus on immigrants from Mexico waving Mexican flags. The implication is that these people are more loyal to Mexico than the United States.

Let’s take this thought a bit further, to a subject which most conservatives don’t think about. Like the United States, Mexico will have a presidential election in 2012. There are a lot of Mexican citizens in the United States (whether documented or undocumented). What if they voted?

More below.

So far they have not. Before the 2006 presidential election, Mexicans living abroad had to physically be present in Mexico to vote. Given the difficulty and expense of doing this (for all expatriates, not just Mexican), this effectively disenfranchised the Mexican expatriate population.

Before the 2006 presidential election, a new law was passed. This allowed Mexicans living abroad to register for an “overseas” ballot. The expectations were quite high; imagine the power of Mexico’s enormous expatriate vote to affect domestic Mexican politics.

As it turns out, however, only 32,632 Mexican citizens living in America bothered to take the offer. Most of them probably didn’t know about the procedure, or perhaps found it too complex. Apparently Mexican immigrants are just as disconnected to Mexican politics as they are to American politics (or more disconnected, in all probability).

Whether turn-out will be just as low in 2012 is still a mystery. Still, it’s pretty fascinating to consider what might happen if expatriate voting actually went into high-gear. What if the current ban on campaigning abroad was overturned? Imagine the PRI holding a political rally in California (or better yet, Arizona!). How about the PAN running advertisements on Univision?

Probably nothing more would piss nativists off than having Mexican political parties physically campaigning in the United States for the Mexican immigrant vote. It’s a humorous, if slightly unrealistic, thought.

MI-Sen: Stabenow in Better Shape

Public Policy Polling (PDF) (3/18-20, Michigan voters, Dec. 2010 in parens)

Debbie Stabenow (D-inc): 50 (45)

Pete Hoekstra (R): 38 (44)

Undecided: 12 (11)

Debbie Stabenow (D-inc): 48 (45)

Terri Lynn Land (R): 38 (41)

Undecided: 14 (14)

Debbie Stabenow (D-inc): 52

Saul Anuzis (R): 35

Undecided: 13

Debbie Stabenow (D-inc): 52

Randy Hekman (R): 33

Undecided: 15

MoE: ±4.4%

Remember last week how I said that Sherrod Brown’s new BFF must be John Kasich? Well, I’ll bet Debbie Stabenow would love to take Gov. Rick Snyder out for a soda pop right about now. I can explain it all to you in one blockquote:

Party        December | March

Democrat:       35    |   41

Republican:     35    |   28

Independent:    29    |   31

Those are the party self-identification breakdowns in PPP’s newest poll versus their last poll. And guess what? The March sample is almost identical to the 2008 exit polls, which was 41 D, 29 R & 29 I. It’s simple: If our voters come back, we win. And if guys like Rick Snyder, John Kasich, and Scott Walker keep helping us, they will.

CT-Sen: Murphy leads in primary, Dems crush in general

Susan Bysiewicz & Chris Murphy

Public Policy Polling for Daily Kos & SEIU (3/17-20, Democratic primary voters, no trendlines):

Chris Murphy (D): 40

Susan Bysiewicz (D): 38

Undecided: 21

(MoE: ±4.9%)

Fifth CD Rep. Chris Murphy holds a narrow lead over former Secretary of State Susan Bysiewicz in the Democratic primary-which won’t be held for more than a year, and which could feature additional candidates (a few other people are poking their noses around the race). Murphy has a nine-point lead with men, but Bysiewicz’s advantage with women is just three points. She does win African Americans by a large margin, but they only make up 11% of the primary electorate in our sample. The biggest difference between the candidates is in their favorables: Murphy scores an impressive 51-14 among Democrats, while Bysiewicz is at 45-27.

Even though no Republicans have officially declared their candidacies yet, we tested the general election (registered voters) as well:

Susan Bysiewicz (D): 44

Mark Boughton (R): 34

Undecided: 22

Chris Murphy (D): 52

Mark Boughton (R): 29

Undecided: 19

Susan Bysiewicz (D): 45

Michael Fedele (R): 35

Undecided: 20

Chris Murphy (D): 51

Michael Fedele (R): 29

Undecided: 20

Susan Bysiewicz (D): 45

Scott Frantz (R): 30

Undecided: 24

Chris Murphy (D): 51

Scott Frantz (R): 27

Undecided: 22

Susan Bysiewicz (D): 50

Linda McMahon (R): 39

Undecided: 12

Chris Murphy (D): 54

Linda McMahon (R): 38

Undecided: 9

Susan Bysiewicz (D): 42

Rob Simmons (R): 39

Undecided: 19

Chris Murphy (D): 49

Rob Simmons (R): 34

Undecided: 18

(MoE: ±3.4%)

If I were Susan Bysiewicz, I’d be pretty pleased with these numbers-even the most popular Republicans can’t crawl their way into the 40s. But if I were Chris Murphy, I’d be even more stoked, and it’s not hard to see why: He crushes the nobodies by twenty-plus-point margins, bodyslams Linda McMahon by sixteen and hold even the semi-popular Rob Simmons to a fifteen point spread. Again, the difference lies in the favorables: Statewide, all voters like Murphy by a 40-27 spread. Bysiewicz, on the other hand, is under water at 31-41. It’s a testament to how weak Republicans are in Connecticut that they do so poorly against her, with only Simmons making the race even appear to be competitive.

And that’s just the nature of the state. Barack Obama’s job approval here is a healthy 55-39, while freshman Democratic Sen. Richard Blumenthal is at 53-32. New Dem Gov. Dan Malloy doesn’t fare as well, but his 39-47 rating is almost certainly due to the fact that he’s actually trying to pass a responsible budget. You’ll also be pleased to know that Joe Lieberman (if you still remember who he is) has sunk all the way to a 29-58 job approval score, and he’s negative with Democrats, independents, and Republicans (in order of descending disgust).

I’m an avowed Chris Murphy partisan, but I’m a Democrat first and always, and I’m just glad to see that the Republicans will have an incredibly hard time making this race competitive. 2010 was their high-water mark, and even then, despite Linda McMahon’s zillions, they still lost by twelve points. It’s difficult to imagine them doing better in 2012.

Redistricting California (Part 4): Hypothetical Unicameral Legislature

In the last part of my redistricting California series, here is a map of what a 120-district unicameral legislature, the Senate and Assembly merged, might look like. I did this map at the same time as the Assembly map.

Majority-White: 54

Majority-Black: 1

Majority-Hispanic: 16

Majority-Minority: 49

Safe Dem: 56

Likely Dem: 13

Lean Dem: 6

Toss-Up: 10

Lean GOP: 14

Likely GOP: 11

Safe GOP: 10

Outer NorCal

Photobucket

LD-01: Humboldt County, Mendocino County, most of Sonoma County

Demographics: 78% White, 13% Hispanic

2008 President: Obama 68%, McCain 29% (SAFE DEM: D+15)

LD-02: Most of southern Sonoma County

Demographics: 73% White, 18% Hispanic

2008 President: Obama 74%, McCain 24% (SAFE DEM: D+21)

LD-03: Marin County, Petaluma in Sonoma County

Demographics: 78% White, 12% Hispanic, 5% Asian

2008 President: Obama 77%, McCain 21% (SAFE DEM: D+24)

LD-04: Del Norte County, Siskiyou County, Trinity County, Shasta County, Modoc County, Lassen County

Demographics: 83% White, 7% Hispanic

2008 President: McCain 60%, Obama 38% (SAFE GOP: R+14)

LD-05: Tehama County, Glenn County, Colusa County, most of Butte County

Demographics: 77% White, 15% Hispanic

2008 President: McCain 51%, Obama 47% (LEAN GOP: R+5)

LD-06: Sutter County, Yuba County, Sierra County, Plumas County, most of Nevada County, Oroville in Butte County

Demographics: 72% White, 15% Hispanic, 6% Asian

2008 President: McCain 52%, Obama 46% (LIKELY GOP: R+6)

LD-07: Lake County, Napa County, Vallejo in Solano County

Demographics: 58% White, 18% Hispanic, 10% Asian, 9% Black

2008 President: Obama 67%, McCain 31% (SAFE DEM: D+14)

LD-08: Yolo County, Vacaville and Winters in Solano County

Demographics: 60% White, 23% Hispanic, 8% Asian

2008 President: Obama 62%, McCain 36% (LIKELY DEM: D+9)

LD-09: Most of Solano County, southern and eastern Sacramento County

Demographics: 60% White, 16% Hispanic, 10% Asian, 9% Black

2008 President: Obama 56%, McCain 43% (LEAN DEM: D+3)

LD-10: Southern Sacramento

Demographics: 40% White, 20% Asian, 19% Hispanic, 15% Black

2008 President: Obama 65%, McCain 34% (SAFE DEM: D+12)

LD-11: Central Sacramento

Demographics: 50% White, 18% Hispanic, 15% Asian, 11% Black

2008 President: Obama 69%, McCain 29% (SAFE DEM: D+16)

LD-12: Northern Sacramento

Demographics: 61% White, 16% Hispanic, 9% Black, 8% Asian

2008 President: Obama 62%, McCain 36% (LIKELY DEM: D+9)

LD-13: Placer County, part of southern Nevada County

Demographics: 81% White, 11% Hispanic

2008 President: McCain 54%, Obama 44% (LIKELY GOP: R+8)

LD-14: Northwestern Sacramento County, southeastern Placer County

Demographics: 74% White, 10% Hispanic, 5% Black, 5% Asian

2008 President: McCain 50%, Obama 48% (LEAN GOP: R+3)

LD-15: El Dorado County, Citrus Heights and Folsom in Sacramento County

Demographics: 82% White, 10% Hispanic

2008 President: McCain 54%, Obama 44% (LIKELY GOP: R+8)

San Francisco/Oakland/East Bay

Photobucket

LD-16: Western San Francisco

Demographics: 50% White, 36% Asian, 6% Hispanic

2008 President: Obama 82%, McCain 16% (SAFE DEM: D+29)

LD-17: Northeastern San Francisco

Demographics: 49% White, 24% Asian, 17% Hispanic, 7% Black

2008 President: Obama 86%, McCain 12% (SAFE DEM: D+33)

LD-18: Southeastern San Francisco, Daly City

Demographics: 41% Asian, 23% Hispanic, 22% White, 11% Black

2008 President: Obama 82%, McCain 16% (SAFE DEM: D+29)

LD-19: Martinez, Richmond

Demographics: 39% White, 21% Hispanic, 19% BLack, 17% Asian

2008 President: Obama 80%, McCain 18% (SAFE DEM: D+27)

LD-20: Berkeley, Emeryville

Demographics: 49% White, 22% Black, 16% Asian, 9% Hispanic

2008 President: Obama 91%, McCain 7% (SAFE DEM: D+38)

LD-21: Oakland

Demographics: 31% Black, 26% Hispanic, 20% White, 18% Asian

2008 President: Obama 87%, McCain 11% (SAFE DEM: D+34)

LD-22: South San Francisco, San Mateo, Pacifica

Demographics: 52% White, 21% Hispanic, 21% Asian

2008 President: Obama 73%, McCain 25% (SAFE DEM: D+20)

LD-23: Most of San Mateo County, small part of northwestern Santa Clara County

Demographics: 58% White, 22% Hispanic, 12% Asian

2008 President: 74% Obama, 24% McCain (SAFE DEM: D+21)

LD-24: Silicon Valley

Demographics: 52% White, 29% Asian, 13% Hispanic

2008 President: 75% Obama, 23% McCain (SAFE DEM: D+22)

LD-25: Pleasant Hill, Lafayette, Orinda

Demographics: 72% White, 12% Hispanic, 10% Asian

2008 President: Obama 67%, McCain 31% (SAFE DEM: D+14)

LD-26: Eastern Contra Costa County

Demographics: 56% White, 23% Hispanic, 9% Black, 8% Asian

2008 President: Obama 64%, McCain 35% (SAFE DEM: D+11)

LD-27: San Ramon, eastern Alameda County

Demographics: 76% White, 10% Asian, 9% Hispanic

2008 President: Obama 59%, McCain 39% (LIKELY DEM: D+6)

LD-28: San Leandro

Demographics: 40% White, 26% Hispanic, 18% Asian, 10% Black

2008 President: Obama 75%, McCain 23% (SAFE DEM: D+22)

LD-29: Hayward, Union City, Fremont

Demographics: 35% White, 34% Asian, 20% Hispanic, 5% Black

2008 President: Obama 73%, McCain 25% (SAFE DEM: D+20)

LD-30: Milpitas, Santa Clara

Demographics: 42% White, 35% Asian, 16% Hispanic

2008 President: Obama 70%, McCain, 28% (SAFE DEM: D+17)

LD-31: Northern San Jose

Demographics: 35% Hispanic, 29% Asian, 29% White

2008 President: Obama 73%, McCain 25% (SAFE DEM: D+20)

LD-32: Eastern San Jose

Demographics: 44% Hispanic, 33% Asian, 16% White

2008 President: Obama 70%, McCain 29% (SAFE DEM: D+17)

LD-33: Downtown San Jose

Demographics: 62% White, 16% Hispanic, 15% Asian

2008 President: Obama 67%, McCain 32% (SAFE DEM: D+14)

LD-34: Palo Alto, Cupertino, Monte Sereno, western Stanislaus County

Demographics: 62% White, 18% Hispanic

2008 President: Obama 63%, McCain 35% (SAFE DEM: D+10)

LD-35: Santa Cruz County, Gilroy

Demographics: 61% White, 31% Hispanic

2008 President: Obama 76%, McCain 22% (SAFE DEM: D+23)

Central

Photobucket

LD-36: Turlock, Merced County

Demographics: 44% White, 42% Hispanic

2008 President: Obama 52%, McCain 46% (TOSS-UP: R+1)

LD-37: Lodi, Tracy, Escalon, Ripon

Demographics: 57% White, 27% Hispanic, 8% Asian

2008 President: McCain 50%, Obama 48% (LEAN GOP: R+4)

LD-38: Stockton

Demographics: 34% White, 33% Hispanic, 18% Asian, 10% Black

2008 President: Obama 64%, McCain 34% (SAFE DEM: D+11)

LD-39: Lathrop, Manteca, Modesto

Demographics: 58% White, 27% Hispanic, 6% Asian

2008 President: Obama 52%, McCain 46% (TOSS-UP: R+1)

LD-40: Eastern Central Valley, eastern Stanislaus County, eastern Madera County

Demographics: 74% White, 18% Hispanic

2008 President: McCain 55%, Obama 43% (LIKELY GOP: R+9)

LD-41: Western Madera County, northern Fresno

Demographics: 51% White, 36% Hispanic, 5% Asian

2008 President: McCain 52%, Obama 47% (LIKELY GOP: R+6)

LD-42: Southern Fresno

Demographics: 47% Hispanic, 28% White, 13% Asian, 9% Black

2008 President: Obama 64%, McCain 35% (SAFE DEM: D+11)

LD-43: San Benito County, Salinas

Demographics: 48% Hispanic, 37% White, 7% Asian

2008 President: Obama 67%, McCain 31% (SAFE DEM: D+14)

LD-44: Most of Monterey and San Luis Obispo Counties

Demographics: 70% White, 22% Hispanic

2008 President: Obama 57%, McCain 41% (LEAN DEM: D+4)

LD-46: Western Fresno County, eastern Fresno

Demographics: 45% Hispanic, 42% White, 6% Asian

2008 President: McCain 53%, Obama 46% (LIKELY GOP: R+7)

LD-47: Eastern Fresno, Visalia

Demographics: 47% Hispanic, 45% White

2008 President: McCain 57%, Obama 41% (SAFE GOP: R+11)

LD-48: Most of Tulare, all of Inyo, Ridgecrest in Kern County

Demographics: 47% Hispanic, 44% White

2008 President: McCain 57%, Obama 41% (SAFE GOP: R+11)

LD-49: Kings County, northwestern Kern County

Demographics: 46% Hispanic, 40% White, 6% Black

2008 President: McCain 58%, Obama 40% (SAFE GOP: R+12)

Outer SoCal

Photobucket

LD-45: San Luis Obispo, Pismo Beach, Santa Maria, Lompoc

Demographics: 58% White, 32% Hispanic

2008 President: Obama 49.1%, McCain 48.9% (LEAN GOP: R+3)

LD-50: Bakersfield

Demographics: 44% Hispanic, 42% White, 8% Black

2008 President: McCain 50%, Obama 49% (LEAN GOP: R+3)

LD-51: Central and eastern Kern County

Demographics: 59% White, 29% Hispanic

2008 President: McCain 62%, Obama 37% (SAFE GOP: R+16)

LD-52: Santa Barbara, Ojai, Ventura

Demographics: 60% White, 32% Hispanic

2008 President: Obama 69%, McCain 29% (SAFE DEM: D+16)

LD-53: Northern and eastern Ventura County

Demographics: 72% White, 19% Hispanic

2008 President: Obama 50%, McCain 48% (LEAN GOP: R+3)

LD-55: Santa Clarita

Demographics: 63% White, 22% Hispanic, 6% Asian, 6% black

2008 President: McCain 50%, Obama 48% (LEAN GOP: R+4)

LD-56: Lancaster, Palmdale, Adelanto, Victorville

Demographics: 50% White, 31% Hispanic, 12% Black

2008 President: Obama 51%, McCain 47% (TOSS-UP: R+2)

LD-57: Hesperia, Victorville, Barstow, California City

Demographics: 61% White, 25% Hispanic, 7% Black

2008 President: McCain 57%, Obama 41% (SAFE GOP: R+11)

LD-92: Redlands, Yucaipa

Demographics: 68% White, 20% Hispanic, 5% Black

2008 President: McCain 55%, Obama 43% (SAFE GOP: R+10)

LD-107: Temecula, Desert Hot Springs

Demographics: 67% White, 23% Hispanic

2008 President: McCain 51%, Obama 47% (LEAN GOP: R+5)

LD-108: Palm Springs, Palm Desert, Indio

Demographics: 50% Hispanic, 44% White

2008 President: Obama 52%, McCain 46% (TOSS-UP: R+1)

LD-120: Blythe, Imperial County, eastern San Diego County

Demographics: 56% Hispanic, 36% White

2008 President: McCain 51%, Obama 47% (LEAN GOP: R+5)

Los Angeles/San Bernardino

Photobucket

LD-54: Oxnard, Camarillo

Demographics: 50% White, 39% Hispanic, 6% Asian

2008 President: Obama 58%, McCain 41% (LEAN DEM: D+5)

LD-58: Western San Fernando Valley

Demographics: 52% White, 28% Hispanic, 13% Asian

2008 President: Obama 63%, McCain 35% (SAFE DEM: D+10)

LD-59: Southeastern San Fernando Valley

Demographics: 50% Hispanic, 33% White, 8% Asian

2008 President: Obama 73%, McCain 25% (SAFE DEM: D+20)

LD-60: San Fernando

Demographics: 57% Hispanic, 26% White, 9% Asian

2008 President: Obama 69%, McCain 29% (SAFE DEM: D+16)

LD-61: Far southeastern San Fernando Valley

Demographics: 47% Hispanic, 37% White, 7% Asian, 5% Black

2008 President: Obama 75%, McCain 23% (SAFE DEM: D+22)

LD-62: Burbank, Glendale

Demographics: 53% White, 28% Hispanic, 11% Asian

2008 President: Obama 63%, McCain 35% (SAFE DEM: D+10)

LD-63: South Pasadena

Demographics: 46% Hispanic, 29% White, 17% Asian

2008 President: Obama 73%, McCain 25% (SAFE DEM: D+20)

LD-64: San Gabriel, El Monte, Baldwin Park

Demographics: 57% Hispanic, 28% Asian, 12% White

2008 President: Obama 66%, McCain 32% (SAFE DEM: D+13)

LD-65: South El Monte, Industry, La Habra Heights

Demographics: 56% Hispanic, 20% Asian, 19% White

2008 President: Obama 62%, McCain 36% (LIKELY DEM: D+9)

LD-66: Covina, Walnut, Diamond Bar

Demographics: 41% Hispanic, 26% White, 25% Asian, 5% Black

2008 President: Obama 59%, McCain 39% (LIKELY DEM: D+6)

LD-67: Port Hueneme, Malibu, Santa Monica

Demographics: 65% White, 22% Hispanic, 7% Asian

2008 President: Obama 69%, McCain 29% (SAFE DEM: D+16)

LD-68: West Side L.A.

Demographics: 65% White, 15% Hispanic, 12% Asian

2008 President: Obama 74%, McCain 24% (SAFE DEM: D+21)

LD-69: Beverly Hills, West Hollywood

Demographics: 73% White, 10% Hispanic, 9% Asian

2008 President: Obama 75%, McCain 23% (SAFE DEM: D+22)

LD-70: Inglewood

Demographics: 47% Black, 35% Hispanic, 7% White, 7% Asian

2008 President: Obama 91%, McCain 7% (SAFE DEM: D+38)

LD-71: Culver City, Hawthorne

Demographics: 45% Hispanic, 26% Black, 16% White, 9% Asian

2008 President: Obama 82%, McCain 16% (SAFE DEM: D+29)

LD-72: South Central L.A., Compton

Demographics: 52% Black, 45% Hispanic

2008 President: Obama 95%, McCain 4% (SAFE DEM: D+42)

LD-73: Downtown L.A. (yellow)

Demographics: 50% Hispanic, 25% White, 17% Asian

2008 President: Obama 82%, McCain 15% (SAFE DEM: D+29)

LD-74: Downtown L.A. (yellow green)

Demographics: 76% Hispanic, 9% Asian, 7% Black, 6% White

2008 President: Obama 82%, McCain 16% (SAFE DEM: D+29)

LD-75: Downtown L.A. (pink)

Demographics: 64% Hispanic, 17% Asian, 13% Black

2008 President: Obama 83%, McCain 15% (SAFE DEM: D+30)

LD-76: South Central, Vernon

Demographics: 74% Hispanic, 24% Black

2008 President: Obama 92%, McCain 7% (SAFE DEM: D+39)

LD-77: Commerce, Maywood, Bell

Demographics: 90% Hispanic, 5% Asian

2008 President: Obama 82%, McCain 16% (SAFE DEM: D+29)

LD-78: Montebello, Pico Rivera, Whittier

Demographics: 68% Hispanic, 16% Asian, 12% White

2008 President: Obama 70%, McCain 28% (SAFE DEM: D+17)

LD-79: El Segundo, Beach Cities

Demographics: 47% White, 25% Hispanic, 16% Asian, 8% Black

2008 President: Obama 61%, McCain 37% (LIKELY DEM: D+8)

LD-80: Palos Verdes, Torrance

Demographics: 50% White, 24% Hispanic, 18% Asian

2008 President: Obama 54%, McCain 44% (TOSS-UP: D+1)

LD-81: Carson, part of Long Beach

Demographics: 46% Hispanic, 21% White, 15% Black, 15% Asian

2008 President: Obama 74%, McCain 24% (SAFE DEM: D+21)

LD-82: South Gate, Paramount, Lynwood

Demographics: 80% Hispanic, 10% Black, 5% White

2008 President: Obama 83%, McCain 15% (SAFE DEM: D+30)

LD-83: Downey, Bellflower, Signal Hill

Demographics: 43% Hispanic, 32% White, 11% Black, 11% Asian

2008 President: Obama 63%, McCain 35% (SAFE DEM: D+10)

LD-84: Artesia, Norwalk, Lakewood, La Mirada

Demographics: 43% Hispanic, 28% White, 21% Asian, 5% Black

2008 President: Obama 58%, McCain 40% (LEAN DEM: D+5)

LD-85: La Canada Flintridge, Pasadena

Demographics: 34% White, 30% Hispanic, 21% Asian, 11% Black

2008 President: Obama 69%, McCain 29% (SAFE DEM: D+16)

LD-86: Monrovia, Glendora, San Dimas

Demographics: 45% White, 31% Hispanic, 16% Asian

2008 President: Obama 52%, McCain 46% (TOSS-UP: R+1)

LD-87: Claremont, Upland, Rancho Cucamonga

Demographics: 54% White, 28% Hispanic, 8% Black, 7% Asian

2008 President: Obama 51%, McCain 47% (TOSS-UP: R+2)

LD-88: Pomona, Montclair, Chino Hills

Demographics: 51% Hispanic, 27% White, 11% Asian, 8% Black

2008 President: Obama 60%, McCain 38% (LIKELY DEM: D+7)

LD-89: Chino, Ontario, Fontana

Demographics: 59% Hispanic, 25% White, 8% Black

2008 President: Obama 62%, McCain 36% (LIKELY DEM: D+9)

LD-90: Rialto, Colton

Demographics: 56% Hispanic, 23% White, 14% Black

2008 President: Obama 69%, McCain 29% (SAFE DEM: D+16)

LD-91: San Bernardino, Loma Linda, Grand Terrace

Demographics: 44% Hispanic, 32% White, 14% Black

2008 President: Obama 62%, McCain 36% (LIKELY DEM: D+9)

LD-93: Calimesa, Beaumont, Banning

Demographics: 63% White, 27% Hispanic

2008 President: McCain 53%, Obama 45% (LIKELY GOP: R+8)

LD-103: Corona, Norco

Demographics: 49% White, 37% Hispanic, 5% Asian, 5% Black

2008 President: Obama 49%, McCain 49% (LEAN GOP: R+4)

LD-104: Riverside

Demographics: 43% Hispanic, 42% White, 7% Black

2008 President: Obama 56%, McCain 42% (LEAN DEM: D+3)

LD-105: Moreno Valley

Demographics: 38% White, 35% Hispanic, 16% Black, 8% Asian

2008 President: Obama 61%, McCain 38% (LIKELY DEM: D+8)

LD-106: Perris, Lake Elsinore, Murrieta

Demographics: 58% White, 29% Hispanic, 6% Black

2008 President: McCain 54%, Obama 45% (LIKELY GOP: R+8)

Orange County

LD-94: Long Beach, Seal Beach

Demographics: 50% White, 27% Hispanic, 12% Asian, 8% Black

2008 President: Obama 57%, McCain 41% (LEAN DEM: D+4)

LD-95: Huntington Beach, Costa Mesa

Demographics: 62% White, 21% Hispanic, 12% Asian

2008 President: McCain 51%, Obama 47% (LEAN GOP: R+5)

LD-96: Newport Beach, Irvine

Demographics: 74% White, 13% Asian, 9% Hispanic

2008 President: Obama 51%, McCain 47% (TOSS-UP: R+2)

LD-97: Anaheim

Demographics: 51% Hispanic, 30% White, 13% Asian

2008 President: Obama 55%, McCain 43% (TOSS-UP: D+2)

LD-98: Garden Grove, Stanton

Demographics: 33% Hispanic, 33% Asian, 30% White

2008 President: McCain 52%, Obama 46% (LIKELY GOP: R+6)

LD-99: Santa Ana

Demographics: 78% Hispanic, 11% White, 7% Asian

2008 President: Obama 68%, McCain 30% (SAFE DEM: D+15)

LD-100: Cypress, Buena Park, Fullerton

Demographics: 45% White, 31% Hispanic, 19% Asian

2008 President: Obama 49%, McCain 49% (LEAN GOP: R+4)

LD-101: Placentia, Yorba Linda, Brea

Demographics: 63% White, 20% Hispanic, 12% Asian

2008 President: McCain 57%, Obama 41% (SAFE GOP: R+11)

LD-102: Orange, Tustin

Demographics: 55% White, 25% Hispanic, 15% Asian

2008 President: McCain 50%, Obama 48% (LEAN GOP: R+5)

LD-109: Rancho Santa Margarita, Laguna Niguel

Demographics: 74% White, 13% Hispanic, 9% Asian

2008 President: McCain 55%, Obama 44% (LIKELY GOP: R+9)

LD-110: San Juan Capistrano, Dana Point, San Clemente, Camp Pendleton, Oceanside

Demographics: 63% White, 26% Hispanic

2008 President: McCain 55%, Obama 43% (SAFE GOP: R+10)

San Diego

Photobucket

LD-111: Vista, Carlsbad

Demographics: 63% White, 24% Hispanic, 5% Asian

2008 President: McCain 50%, Obama 48% (LEAN GOP: R+5)

LD-112: Encinitas, Solana Beach, Del Mar

Demographics: 71% White, 13% Hispanic, 11% Asian

2008 President: Obama 52%, McCain 46% (TOSS-UP: R+1)

LD-113: San Diego (purple)

Demographics: 64% White, 19% Asian, 11% Hispanic

2008 President: Obama 59%, McCain 39% (LIKELY DEM: D+6)

LD-114: San Diego (red), Lemon Grove

Demographics: 54% Whtie, 21% Hispanic, 11% Asian, 8% Black

2008 President: Obama 61%, McCain 38% (LIKELY DEM: D+8)

LD-115: San Diego (gold)

Demographics: 49% White, 32% Hispanic, 10% Black, 6% Asian

2008 President: Obama 72%, McCain 26% (SAFE DEM: D+19)

LD-116: Coronado, Imperial Beach, San Diego (teal)

Demographics: 41% Hispanic, 23% White, 17% Asian, 15% Black

2008 President: Obama 63%, McCain 36% (SAFE DEM: D+10)

LD-117: National City, Chula Vista

Demographics: 53% Hispanic, 27% White, 13% Asian

2008 President: Obama 61%, McCain 38% (LIKELY DEM: D+8)

LD-118: Santee, Poway

Demographics: 65% White, 26% Hispanic, 5% Asian

2008 President: McCain 57%, Obama 42% (SAFE GOP: R+11)

LD-119: El Cajon, La Mesa

Demographics: 71% White, 17% Hispanic, 5% Black

2008 President: McCain 53%, Obama 46% (LIKELY GOP: R+7)

SSP Daily Digest: 3/21

IN-Sen: An unnamed “Democratic strategist” quoted by The Hill suggests that ex-Rep. Tim Roemer (whose name hadn’t really come up before this year) is unlikely to run for Senate. Honestly, I’m not sure if the wankerish Roemer would really excite anyone… but we don’t seem to have a long list of possible names for this race.

OH-Sen: PPP has another “everyone and the kitchen sink” primary polls, this time of the Republican senatorial primary in Ohio. In this case, the kitchen sink is named “Kenneth Blackwell,” and he comes in first in an eleventy-billion-way test, with all of 17%. I don’t think I’ve even heard Blackwell (last seen losing the 2006 gubernatorial race to Ted Strickland very badly) as a possible contender. Click the link for the other numbers.

VA-Sen: I’ve got a new name you can root for: Tim Donner, a wealthy television production executive who is considering whether to challenge George Allen in the Republican primary. A spokesman tells Dave Catanese he’s a “couple weeks away” from making a decision. It’s not 100% clear whether he’s a teabagger, but I suspect he is, given that his mouthpiece attacked bona fide teabagger (and hopeless Some Dude) Jamie Radtke for “working in government since she graduated from college,” and because Donner thinks none of the candidates currently running “believe in the concept of a citizen legislature.” That sounds like something a teabagger trying to channel Patrick Henry might say, no? At the very least, we should be hoping he’ll rough Macaca up with a million or few.

WV-Gov: This was expected, but it’s still an important get: State House Speaker Rick Thompson (D) scored the backing of the AFL-CIO, a key endorsement in what will likely be a low-turnout special primary. (As we noted last week, Thompson also picked up the support of a couple of teachers unions.) The election is May 14th.

CA-36: Marta Evry at Calitics takes a look at the ActBlue fundraising numbers so far for the key Democrats in the race. The numbers are a moving target, but as of Friday, Janice Hahn had taken in $49K from 200 donors, while Debra Bowen had pulled in $41K but from a much larger 474 donors. Oh, and Marcy Winograd has now achieved joke status, with $1K raised. Also, some teabagger also joined the race, making him the fourth Republican to get in.

Wisconsin Recall: Some very good sleuthing by Madison TV station WKOW27: The alleged mistress of GOP state Sen. Randy Hopper (the name you can’t forget) recently scored a government job, and Hopper said: “I want to keep my involvement of anything as a private matter. So, I’m going to maintain that.” He didn’t maintain that for very long, calling the station back and denying his involvement with the hiring. I’m not sure Jack McCoy ever got a witness to change his story so quickly – and incredibly. Even better, discovers WKOW, the woman in question got a 35% pay boost over the person who previously held the job. Scott Walker’s government austerity in action.

In other news, Greg Sargent says that GOP polling firm Public Opinion Strategies is in the field with a survey testing anti-union messages on recall target Alberta Darling’s behalf.

DCCC: Biden alert! The VPOTUS was in Philadelphia on Friday, raising a cool $400K for the D-Triple-C. A long list of PA pols was in attendance, including ex-Rep. Patrick Murphy and a couple of unsuccessful 2010 candidates, Bryan Lentz and John Callahan. Also nice to see present: Arlen Specter, a guy whose age, brief tenure as an elected Dem, and inglorious exit from office would give him more than enough reason to stay away from this sort of thing forever. Too bad he didn’t have the sense to join our team decades ago!

Redistricting Roundup:

With the bulk of census data out, redistricting stories are coming fast and furious now.

Arkansas: Talk Business has copies of a few different congressional maps proposed by various lawmakers, as well as descriptions of some others. Click the link to have a look.

California: Ugh, gross: One of two finalist consulting firms to help California’s new redistricting commission has hardcore Republican leanings, while two of four finalist law firms are similarly oriented. Of course, this is exactly what you risk when you leave things to a supposedly independent panel (that features a ridiculous level of Republican over-representation).

Florida: One Democratic consultant thinks that Florida’s population growth suggests that new districts (the state is getting two) could be anchored to regions that would favor two Republicans in particular: ex-LG Jeff Kottkamp and state Sen. Paula Dockery. Kottkamp lost the GOP primary for AG last year, while Dockery dropped out of the gubernatorial primary.

Iowa: The Hawkeye State’s independent redistricting commission will release its first proposes congressional and state maps on March 31st. (Remember, IA loses a House seat.) As the Des Moines Register points out, “Either chamber of the Iowa Legislature or Republican Gov. Terry Branstad can reject proposals twice. If they don’t like the third, the Iowa Supreme Court decides the boundaries.”

Louisiana: A bunch more proposed maps have been released by the state lege. Republican state House Speaker Jim Tucker’s plans can be found here, while Democratic state Senate President Joel Chaisson’s are toward the end of this document.

Missouri: Show Me State lawmakers are starting their work on redistricting, but if they don’t have a congressional plan by May 13th, then it’ll get kicked over to the courts. State legislative maps aren’t due until September.

Mississippi: I’m not really sure I’m getting this: The NAACP is suing the state of Mississippi over its redistricting plans, but the legislature hasn’t even passed anything yet. It seems like this case would fail from the get-go on ripeness grounds (i.e., a court would say that the dispute isn’t ready to be heard because the plaintiff doesn’t have actual maps to complain about), so I’m not really sure what the NAACP’s angle is here.

Pennsylvania: PoliticsPA talked to some insiders who are crediting Dave Wasserman’s sources and saying that his most recent map is apparently pretty close to the plan that the state’s Republicans are supposedly reaching consensus on. (Maybe both share the same sources, though – who knows?) Click through for all the details. The most salient feature is something a lot of people here have also proposed: a matchup between Jason Altmire and Mark Critz, the two most junior Democrats in the delegation, in order to deal with PA’s loss of a seat.

Virginia: Lawmakers are potentially looking to release state legislative maps as early as the end of the month – which makes sense, since VA holds its House and Senate elections this November.

California’s Unusual Black Vote in 2010

By: Inoljt, http://mypolitikal.com/

The black vote is one of the most reliably Democratic constituencies out there. Blacks commonly give Democratic candidates more than 90% of the vote; Democratic presidential candidates in 2000, 2004, and 2008 won 90%, 89%, and 95% of blacks respectively.

Blacks were as reliably Democratic as ever in the 2010 midterm elections. The black vote undoubtedly saved many a Democrat from defeat. Exit polls indicate that 89% of blacks nationwide voted for a Democratic congressman.

In California, however, blacks seemed to have been quite a bit more Republican than this.

More below.

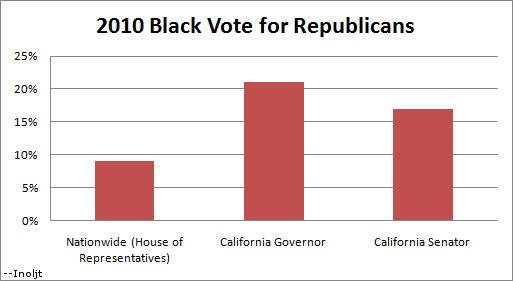
The table below indicates the black support, according to exit polls, gained by Republicans in California’s statewide races:

2010   Black Vote Democratic Republican
Nationwide   (House of Representatives) 89 9
California   Governor 77 21
California   Senator 80 17

This can be graphed as below:

Photobucket

Now, a word of caution before analyzing these results: exit polls are notoriously unreliable. It is entirely possible that a bad sample skewed these results (although since it appears that the polls for the two California races were separately done, this may be less likely).

If the exit polls prove correct, however, California blacks voted significantly more Republican than blacks elsewhere in the nation. Generally speaking, it is quite a feat for a Republican to get more than 15% of the black vote.

Yet in 2010 Republican candidates in California did this twice. These were not especially impressive candidates; both lost pretty badly. Nevertheless, they got a degree of black support one would only expect Republican to pull during a landslide victory.

Whether this degree of black support is something recent, or  whether blacks in California have  always voted this way, is hard to  tell. According to exit polls, in 2008 they gave 94% of the vote to the Democratic candidate. In 2004 they gave 86% of the vote for Democratic Senator Barbara Boxer (this   was an election she won by a landslide). On the other hand, in 2004 a relatively paltry 70% voted for Democratic gubernatorial candidate Phil Angelides (who lost by a landslide). To round these numbers up, Senator John Kerry got 81% of the black vote that year.

Looking at the results does seem to indicate that blacks in California have been consistently more Republican than blacks nationwide, if not to the extent they were in 2010.

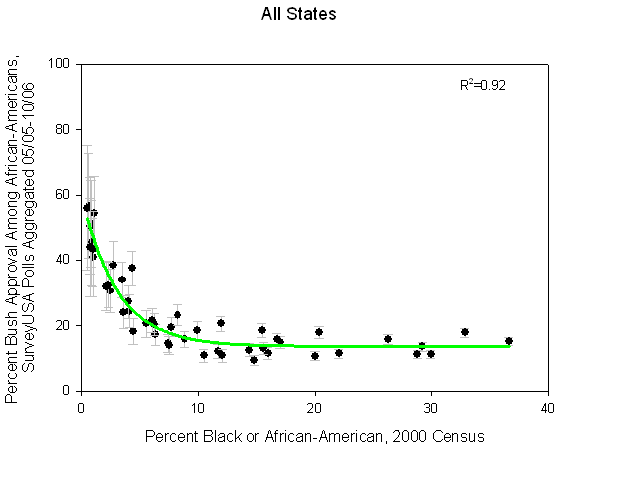
There are several reasons why this might have happened. Several years ago a blogger named dreaminonempty did a fascinating analysis, in which (s)he found that the blacks living in extremely non-black states tended to support Democrats less. For instance, blacks residing in states with higher black populations were more disapproving of President George W. Bush. This was the graph the blogger created:

Photobucket

Califonia is a state with a relatively low black population. Moreover, blacks in California are unusually integrated and getting more so. Places traditionally associated with the black community are rapidly diversifying. For instance, today Oakland is barely more than one-fourth black and Compton is less than one-third black.

California, then, constitutes a good example of dreaminonempty’s hypothesis. Its relatively racially integrated communities may have something to do with a less monolithically Democratic black vote.

Republicans should not start celebrating yet, however. Their relative strength amongst the black vote has very little to do with Republican success at appealing to minorities, and much more to do with the characteristics of California’s black community. If the party is ever to regain competitiveness in California, it must begin reaching out to minorities. Judging by the 2010 election results, this is still a challenge the party has yet to overcome.

Redistricting California (Part 3): State Assembly and BoE

Here are my maps of the California State Assembly and the Board of Equalization, the tax board. To make each BoE district, I colored over 20 Assembly districts.

Majority-White: 37

Majority-Black: 1

Majority-Hispanic: 11

Majority-Minority: 31

Safe Dem: 35

Likely Dem: 9

Lean Dem: 3

Toss-Up: 12

Lean GOP: 7

Likely GOP: 8

Safe GOP: 6

Outer NorCal

Photobucket

AD-01: Rural North Coast, northern Sonoma County

Demographics: 75% White, 15% Hispanic

2008 President: Obama 70%, McCain 28% (SAFE DEM: D+17)

AD-02: Marin County, southern Sonoma County

Demographics: 78% White, 13% Hispanic

2008 President: Obama 77%, McCain 22% (SAFE DEM: D+24)

AD-03: Most of Sacramento Valley and Northern Mountains

Demographics: 79% White, 12% Hispanic

2008 President: McCain 59%, Obama 38% (SAFE GOP: R+13)

AD-04: Rest of Sacramento Valley

Demographics: 75% White, 13% Hispanic, 5% Asian

2008 President: McCain 49%, Obama 48% (LEAN GOP: R+3)

AD-05: All of Lake, Napa, and Yolo Counties; northern Solano County

Demographics: 63% White, 22% Hispanic, 7% Asian

2008 President: Obama 64%, McCain 34% (SAFE DEM: D+11)

AD-06: Southern Solano County; most of suburban Sacramento

Demographics: 55% White, 16% Hispanic, 12% Asian, 12% Black

2008 President: Obama 59%, McCain 39% (LIKELY DEM: D+6)

AD-07: Southern Sacramento

Demographics: 39% White, 20% Hispanic, 20% Asian, 14% Black

2008 President: Obama 67%, McCain 31% (SAFE DEM: D+14)

AD-08: Northern Sacramento

Demographics: 61% White, 16% Hispanic, 9% Black, 8% Asian

2008 President: Obama 64%, McCain 34% (SAFE DEM: D+11)

AD-09: Placer County, small parts of Sacramento and Nevada Counties

Demographics: 79% White, 11% Hispanic

2008 President: McCain 53%, Obama 45% (LIKELY GOP: R+7)

AD-10: All of El Dorado, Alpine, and Mono Counties; northwestern Sacramento suburbs

Demographics: 79% White, 10% Hispanic

2008 President: McCain 52%, Obama 46% (LIKELY GOP: R+6)

San Francisco

Photobucket

AD-11: Western San Francisco, Daly City

Demographics: 41% Asian, 39% White, 12% Hispanic

2008 President: Obama 81%, McCain 17% (SAFE DEM: D+28)

AD-12: Eastern San Francisco

Demographics: 41% White, 26% Asian, 18% Hispanic, 10% Black

2008 President: Obama 86%, McCain 12% (SAFE DEM: D+33)

AD-13: Martinez, Richmond, Berkeley

Demographics: 44% White, 19% Black, 17% Hispanic, 16% Asian

2008 President: Obama 86%, McCain 12% (SAFE DEM: D+33)

AD-14: Oakland

Demographics: 30% Black, 28% White, 20% Hispanic, 18% Asian

2008 President: Obama 88%, McCain 10% (SAFE DEM: D+35)

AD-15: Most of San Mateo County

Demographics: 58% White, 19% Asian, 17% Hispanic

2008 President: Obama 73%, McCain 26% (SAFE DEM: D+20)

AD-16: Silicon Valley

Demographics: 51% White, 22% Asian, 20% Hispanic

2008 President: Obama 76%, McCain 22% (SAFE DEM: D+23)

AD-17: Northern Contra Costa County (Pittsburg, Concord, Antioch)

Demographics: 61% White, 19% Hispanic, 10% Asian, 6% Black

2008 President: Obama 68% McCain 30% (SAFE DEM: D+15)

AD-18: Southern Contra Costa County, eastern Alameda County

Demographics: 75% White, 10% Hispanic, 9% Asian

2008 President: Obama 59%, McCain 40% (LIKELY DEM: D+6)

AD-19: San Leandro, Hayward, Union City

Demographics: 37% White, 25% Hispanic, 24% Asian, 9% Black

2008 President: Obama 74%, McCain 24% (SAFE DEM: D+21)

AD-20: Newark, Milpitas

Demographics: 41% White, 34% Asian, 17% Hispanic

2008 President: Obama 71%, McCain 27% (SAFE DEM: D+18)

AD-21: Eastern San Jose

Demographics: 35% Hispanic, 35% Asian, 22% White

2008 President: Obama 70%, McCain 29% (SAFE DEM: D+17)

AD-22: Western San Jose

Demographics: 49% White, 28% Hispanic, 16% Asian

2008 President: Obama 69%, McCain 29% (SAFE DEM: D+16)

AD-23: Santa Cruz County, southwestern Santa Clara County

Demographics: 66% White, 18% Hispanic, 11% Asian

2008 President: Obama 72%, McCain 26% (SAFE DEM: D+19)

AD-24: Eastern Santa Clara County, western Stanislaus County, Merced County

Demographics: 45% White, 42% Hispanic, 6% Asian

2008 President: Obama 55%, McCain 43% (TOSS-UP: D+2)

Central

Photobucket

AD-25: Northern San Joaquin County (Lodi, Stockton)

Demographics: 42% White, 31% Hispanic, 15% Asian, 7% Black

2008 President: Obama 56%, McCain 42% (LEAN DEM: D+3)

AD-26: Southern San Joaquin County, Modesto

Demographics: 58% White, 27% Hispanic, 6% Asian

2008 President: Obama 52%, McCain 46% (TOSS-UP: R+1)

AD-27: Eastern Stanislaus County, eastern Central Valley

Demographics: 64% White, 27% Hispanic

2008 President: McCain 55%, Obama 43% (LIKELY GOP: R+9)

AD-28: Fresno

Demographics: 39% Hispanic, 37% White, 11% Asian, 8% Black

2008 President: Obama 57%, McCain 41% (LEAN DEM: D+4)

AD-29: Most of Fresno County, all of Inyo County

Demographics: 46% White, 42% Hispanic, 5% Asian

2008 President: McCain 55%, Obama 43% (LIKELY GOP: R+9)

AD-30: Reedley, all of Tulare County

Demographics: 51% Hispanic, 41% White

2008 President: McCain 56%, Obama 43% (SAFE GOP: R+10)

AD-31: Monterey and San Benito Counties

Demographics: 46% White, 41% Hispanic, 6% Asian

2008 President: Obama 67%, McCain 31% (SAFE DEM: D+14)

AD-32: San Luis Obispo County, Santa Maria, Lompoc

Demographics: 64% White, 27% Hispanic

2008 President: Obama 50%, McCain 49% (LEAN GOP: R+3)

AD-33: Kings County, most of Kern County

Demographics: 45% Hispanic, 43% White, 5% Black

2008 President: McCain 58%, Obama 40% (SAFE GOP: R+12)

AD-34: Bakersfield

Demographics: 51% White, 34% Hispanic, 7% Black

2008 President: McCain 57%, Obama 41% (SAFE GOP: R+11)

Outer SoCal

Photobucket

AD-35: Santa Barbara, Ventura, Oxnard

Demographics: 52% White, 38% Hispanic

2008 President: Obama 68%, McCain 31% (SAFE DEM: D+15)

AD-36: Most of Ventura County

Demographics: 69% White, 22% Hispanic, 5% Asian

2008 President: Obama 51%, McCain 48% (TOSS-UP: R+2)

AD-37: Santa Clarita, Lancaster, Palmdale

Demographics: 57% White, 26% Hispanic, 10% Black, 5% Asian

2008 President: Obama 50%, McCain 48% (LEAN GOP: R+3)

AD-38: California City, Barstow, Victorville, northeastern L.A. County

Demographics: 60% White, 26% Hispanic, 8% Black

2008 President: McCain 56%, Obama 42% (SAFE GOP: R+10)

AD-61: San Bernardino, Big Bear Lake, Twentynine Palms

Demographics: 46% White, 34% Hispanic, 12% Black

2008 President: Obama 53%, McCain 45% (TOSS-UP: EVEN)

AD-62: Redlands, Hemet

Demographics: 62% White, 26% Hispanic

2008 President: McCain 53%, Obama 45% (LIKELY GOP: R+7)

AD-63: Corona, Moreno Valley

Demographics: 40% White, 39% Hispanic, 12% Black, 6% Asian

2008 President: Obama 57%, McCain 41% (LEAN DEM: D+4)

AD-64: Riverside, Norco

Demographics: 46% White, 38% Hispanic, 7% Black, 5% Asian

2008 President: Obama 53%, McCain 45% (TOSS-UP: D+1)

AD-65: Lake Elsinore, Murrieta, Temecula

Demographics: 62% White, 26% Hispanic, 5% Black

2008 President: McCain 55%, Obama 43% (LIKELY GOP: R+9)

AD-66: Palm Springs, Cathedral City, Indio

Demographics: 51% White, 42% Hispanic

2008 President: Obama 53%, McCain 46% (TOSS-UP: EVEN)

AD-80: Blythe, Imperial County, eastern San Diego County

Demographics: 50% Hispanic, 42% White

2008 President: McCain 51%, Obama 47% (LEAN GOP: R+5)

Los Angeles/Orange County

Photobucket

AD-39: Western San Fernando Valley

Demographics: 52% White, 27% Hispanic, 13% Asian

2008 President: Obama 64%, McCain 34% (SAFE DEM: D+11)

AD-40: Eastern San Fernando Valley (San Fernando)

Demographics: 63% Hispanic, 22% White, 7% Asian

2008 President: Obama 73%, McCain 25% (SAFE DEM: D+20)

AD-41: Burbank

Demographics: 45% Hispanic, 39% White, 8% Asian

2008 President: Obama 72%, McCain 26% (SAFE DEM: D+19)

AD-42: Glendale (Mike Gatto)

Demographics: 40% White, 37% Hispanic, 16% Asian

2008 President: Obama 68%, McCain 30% (SAFE DEM: D+15)

AD-43: San Gabriel, El Monte, Baldwin Park

Demographics: 55% Hispanic, 24% Asian, 17% White

2008 President: Obama 63%, McCain 35% (SAFE DEM: D+10)

AD-44: Covina, West Covina, Diamond Bar

Demographics: 47% Hispanic, 24% Asian, 22% White

2008 President: Obama 61%, McCain 37% (LIKELY DEM: D+8)

AD-45: Santa Monica, Malibu, Port Hueneme

Demographics: 65% White, 21% Hispanic, 8% Asian

2008 President: Obama 71%, McCain 28% (SAFE DEM: D+18)

AD-46: Beverly Hills, West Hollywood

Demographics: 70% White, 12% Asian, 11% Hispanic

2008 President: Obama 76%, McCain 23% (SAFE DEM: D+23)

AD-47: Inglewood, Hawthorne

Demographics: 51% Black, 37% Hispanic, 6% White

2008 President: Obama 91%, McCain 8% (SAFE DEM: D+38)

AD-48: Culver City, Compton (I had to make this district snake around AD-47 to make that one majority-black)

Demographics: 47% Hispanic, 32% Black, 10% White, 8% Asian

2008 President: Obama 88%, McCain 11% (SAFE DEM: D+35)

AD-49: Downtown L.A.

Demographics: 53% Hispanic, 21% Asian, 18% White

2008 President: Obama 81%, McCain 17% (SAFE DEM: D+28)

AD-50: Downtown L.A.

Demographics: 74% Hispanic, 12% Black, 8% Asian, 5% White

2008 President: Obama 85%, McCain 13% (SAFE DEM: D+32)

AD-51: Vernon, Bell, Bell Gardens

Demographics: 80% Hispanic, 16% Black

2008 President: Obama 89%, McCain 10% (SAFE DEM: D+36)

AD-52: Monterey Park, Montebello, Whittier

Demographics: 74% Hispanic, 14% Asian

2008 President: Obama 73%, McCain 25% (SAFE DEM: D+20)

AD-53: Beach Cities, Torrance (Betsy Butler)

Demographics: 48% White, 24% Hispanic, 18% Hispanic, 6% Black

2008 President: Obama 59%, McCain 39% (LIKELY DEM: D+6)

AD-54: Palos Verdes, Carson, part of Long Beach

Demographics: 40% Hispanic, 31% White, 14% Asian, 11% Black

2008 President: Obama 66%, McCain 32% (SAFE DEM: D+13)

AD-55: South Gate, Downey

Demographics: 69% Hispanic, 13% White, 10% Black, 6% Asian

2008 President: Obama 76%, McCain 22% (SAFE DEM: D+23)

AD-56: Lakewood, Bellflower, Norwalk

Demographics: 42% Hispanic, 31% White, 18% Asian, 6% Black

2008 President: Obama 59%, McCain 39% (LIKELY DEM: D+6)

AD-57: La Canada Flintridge, Pasadena, South Pasadena, Monrovia

Demographics: 36% White, 29% Hispanic, 22% Asian, 9% Black

2008 President: Obama 65%, McCain 33% (SAFE DEM: D+12)

AD-58: Glendora, Claremont, Upland, Rancho Cucamonga

Demographics: 53% White, 30% Hispanic, 7% Asian, 6% Black

2008 President: Obama 50%, McCain 48% (TOSS-UP: R+3)

AD-59: Pomona, Chino, Montclair

Demographics: 53% Hispanic, 28% White, 9% Asian, 8% Black

2008 President: Obama 59%, McCain 39% (LIKELY DEM: D+6)

AD-60: Ontario, Fontana, Rialto, Colton

Demographics: 59% Hispanic, 22% White, 12% Black

2008 President: Obama 69%, McCain 29% (SAFE DEM: D+16)

AD-67: Long Beach, Seal Beach, Huntington Beach

Demographics: 56% White, 23% Hispanic, 11% Asian, 6% Black

2008 President: Obama 53%, McCain 45% (TOSS-UP: D+1)

AD-68: Fountain Valley, Costa Mesa, Newport Beach, Irvine, Laguna Hills, Laguna Beach

Demographics: 68% White, 15% Hispanic, 13% Asian

2008 President: Obama 51%, McCain 48% (TOSS-UP: R+2)

AD-69: Anaheim, Stanton, Garden Grove

Demographics: 43% Hispanic, 32% White, 20% Asian

2008 President: Obama 51%, McCain 48% (TOSS-UP: R+2)

AD-70: Santa Ana

Demographics: 65% Hispanic, 15% Asian, 15% White

2008 President: Obama 60%, McCain 38% (LIKELY DEM: D+7)

AD-71: Northern Orange County (Cypress, Buena Park, Brea, Fullerton)

Demographics: 50% White, 28% Hispanic, 16% Asian

2008 President: McCain 51%, Obama 47% (LEAN GOP: R+5)

AD-72: Yorba Linda, Orange, Tustin

Demographics: 59% White, 22% Hispanic, 15% Asian

2008 President: McCain 53%, Obama 45% (LIKELY GOP: R+7)

AD-73: Rancho Santa Margarita, Laguna Niguel, San Juan Capistrano, Dana Point

Demographics: 74% White, 15% Hispanic, 7% Asian

2008 President: McCain 55%, Obama 44% (LIKELY GOP: R+9)

San Diego

Photobucket

AD-74: Camp Pendleton, Oceanside, Vista, Carlsbad

Demographics: 59% White, 27% Hispanic, 5% Asian, 5% Black

2008 President: McCain 51%, Obama 47% (LEAN GOP: R+4)

AD-75: Encinitas, Solana Beach, Del Mar

Demographics: 66% White, 17% Asian, 11% Hispanic

2008 President: Obama 54%, McCain 44% (TOSS-UP: D+1)

AD-76: Northern San Diego, Lemon Grove

Demographics: 61% White, 18% Hispanic, 10% Asian, 7% Black

2008 President: Obama 60%, McCain 38% (LIKELY DEM: D+7)

AD-77: Southern San Diego

Demographics: 36% White, 35% Hispanic, 14% Black, 11% Asian

2008 President: Obama 72%, McCain 26% (SAFE DEM: D+19)

AD-78: Coronado Beach, National City, Chula Vista, Imperial Beach

Demographics: 49% Hispanic, 30% White, 13% Asian, 5% Black

2008 President: Obama 59%, McCain 39% (LIKELY DEM: D+6)

AD-79: Poway, El Cajon, Santee, La Mesa

Demographics: 73% White, 15% Hispanic

2008 President: McCain 56%, Obama 43% (SAFE GOP: R+10)

Board of Equalization

Photobucket

BOE-1: San Francisco and Sacramento Areas

Demographics: 51% White, 20% Hispanic, 17% Asian, 7% Black

2008 President: Obama 72%, McCain 26% (SAFE DEM: D+19)

BOE-2: Outer NorCal and Central

Demographics: 58% White, 29% Hispanic

2008 President: McCain 49%, Obama 49% (LEAN GOP: R+4)

BOE-3: Outer SoCal, Orange County, San Diego

Demographics: 49% White, 34% Hispanic, 9% Asian

2008 President: Obama 53%, McCain 46% (TOSS-UP: R+0)

BOE-4: Los Angeles

Demographics: 45% Hispanic, 29% White, 13% Asian, 10% Black

2008 President: Obama 70%, McCain 28% (SAFE DEM: D+17)

MO-Sen: GOP Primary Poll Has Steelman Leading

Public Policy Polling (PDF) (3/6-9, “usual Missouri Republican primary voters,” no trendlines):

Sarah Steelman (R): 31

Todd Akin (R): 24

Ed Martin (R): 9

Ann Wagner (R): 2

Undecided/other: 34

Sarah Steelman (R): 37

Ed Martin (R): 18

Ann Wagner (R): 11

Undecided/other: 34

(MoE: ±4.9%)

I don’t have much to say here except that the primary vote share (either with or without Akin) almost perfectly correlates with how well known these candidates are – as in, a correlation of 1. Put another way, if you add each person’s “don’t know” share on the favorable/unfavorable question to their vote share on the horserace question, you get just about the same number for all candidates. This says to me that Ed Martin has a lot of work to do to get his name out there, and that Todd Akin (who has only just now ramped up to “considering” status) should not be scared off by Sarah Steelman’s early lead.

And just for fun:

Mike Huckabee (R): 29

Newt Gingrich (R): 19

Sarah Palin (R): 14

Mitt Romney (R): 13

Ron Paul (R): 7

Mitch Daniels (R): 4

Tim Pawlenty (R): 3

Haley Barbour (R): 2

Other/undecided: 10

(MoE: ±4.9%)