California’s Unusual Black Vote in 2010

By: Inoljt, http://mypolitikal.com/

The black vote is one of the most reliably Democratic constituencies out there. Blacks commonly give Democratic candidates more than 90% of the vote; Democratic presidential candidates in 2000, 2004, and 2008 won 90%, 89%, and 95% of blacks respectively.

Blacks were as reliably Democratic as ever in the 2010 midterm elections. The black vote undoubtedly saved many a Democrat from defeat. Exit polls indicate that 89% of blacks nationwide voted for a Democratic congressman.

In California, however, blacks seemed to have been quite a bit more Republican than this.

More below.

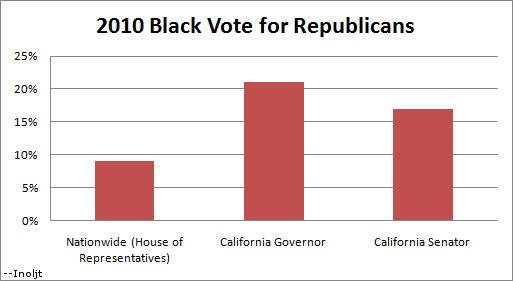
The table below indicates the black support, according to exit polls, gained by Republicans in California’s statewide races:

2010   Black Vote Democratic Republican
Nationwide   (House of Representatives) 89 9
California   Governor 77 21
California   Senator 80 17

This can be graphed as below:

Photobucket

Now, a word of caution before analyzing these results: exit polls are notoriously unreliable. It is entirely possible that a bad sample skewed these results (although since it appears that the polls for the two California races were separately done, this may be less likely).

If the exit polls prove correct, however, California blacks voted significantly more Republican than blacks elsewhere in the nation. Generally speaking, it is quite a feat for a Republican to get more than 15% of the black vote.

Yet in 2010 Republican candidates in California did this twice. These were not especially impressive candidates; both lost pretty badly. Nevertheless, they got a degree of black support one would only expect Republican to pull during a landslide victory.

Whether this degree of black support is something recent, or  whether blacks in California have  always voted this way, is hard to  tell. According to exit polls, in 2008 they gave 94% of the vote to the Democratic candidate. In 2004 they gave 86% of the vote for Democratic Senator Barbara Boxer (this   was an election she won by a landslide). On the other hand, in 2004 a relatively paltry 70% voted for Democratic gubernatorial candidate Phil Angelides (who lost by a landslide). To round these numbers up, Senator John Kerry got 81% of the black vote that year.

Looking at the results does seem to indicate that blacks in California have been consistently more Republican than blacks nationwide, if not to the extent they were in 2010.

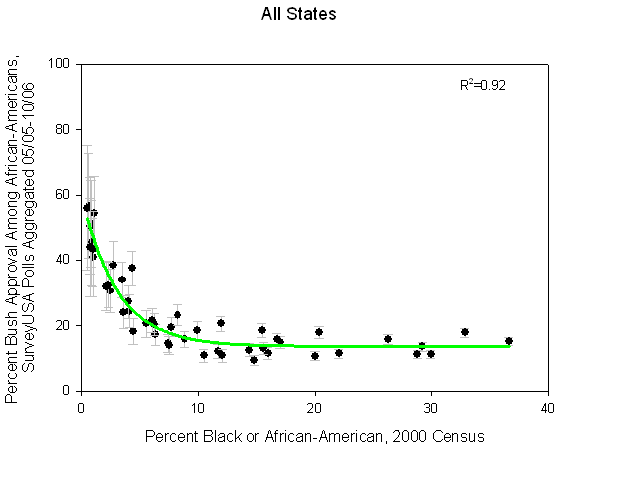
There are several reasons why this might have happened. Several years ago a blogger named dreaminonempty did a fascinating analysis, in which (s)he found that the blacks living in extremely non-black states tended to support Democrats less. For instance, blacks residing in states with higher black populations were more disapproving of President George W. Bush. This was the graph the blogger created:

Photobucket

Califonia is a state with a relatively low black population. Moreover, blacks in California are unusually integrated and getting more so. Places traditionally associated with the black community are rapidly diversifying. For instance, today Oakland is barely more than one-fourth black and Compton is less than one-third black.

California, then, constitutes a good example of dreaminonempty’s hypothesis. Its relatively racially integrated communities may have something to do with a less monolithically Democratic black vote.

Republicans should not start celebrating yet, however. Their relative strength amongst the black vote has very little to do with Republican success at appealing to minorities, and much more to do with the characteristics of California’s black community. If the party is ever to regain competitiveness in California, it must begin reaching out to minorities. Judging by the 2010 election results, this is still a challenge the party has yet to overcome.
Examining Turn-Out by Race in California

California constitutes one of the most diverse states in the United States. Here is how the Census estimates its population composition:

California’s   Ethnic Composition
Asian 12.7%
Black 6.6%
Hispanic 37.0%
Mixed 2.6%
Native   American 1.2%
Pacific   Islander 0.4%
White 41.7%

(Note that the numbers do not add up to 100, due to the way the Census tracks ethnicity.)

The people who actually vote in California, however, do not reflect this composition.

More below.

California’s electorate in the 2008 presidential election is quite different from its actual ethnic composition:

2008   Electorate: Exit Polls
Asian 6%
Black 10%
Hispanic 18%
Other 3%
White 63%

These numbers were taken from exit polls – and one should be warned that exit polls are very, very inaccurate. The numbers above should not be taken for the truth, but rather as a rough approximation of it.

Nevertheless, one can take something out of the exit polls: blacks and whites punched far above their demographic weight, while Asians and Hispanics punched far below theirs. This pattern isn’t so much a racial one as much as an immigrant versus non-immigrant one.

Since blacks and whites are mainly non-immigrant communities, they vote more often than immigrant communities. Blacks and whites thus are overrepresented in the electorate. There was little racial divide between black and white turn-out, which is quite remarkable, given the lower socioeconomic status of blacks. All in all the percentage of California’s 2008 electorate was about 50% more black and white than California’s overall population.

Hispanics are the ones hurt most by this. The difference between the Hispanic portion of the electorate and the Hispanic portion of the overall population is quite striking: the electorate is just half as Hispanic as the population. Most of this is attributable to the legal status of many Hispanic immigrants, the relative youth of the Hispanic population, the lower socioeconomic status of Hispanics, and the immigrant-heavy nature Hispanic community (this is different from the first factor in that immigrants are inherently less likely to vote even if they are citizens).

It is not Hispanics, however, who are least likely to vote: it is Asians. There are several similarities and differences between the two groups. Unlike Hispanics, the Asian population is not skewed downwards, and Asians generally have a high socioeconomic status. On the other hand, Asians are much more of an immigrant community than Hispanics: a remarkable four out of five adult Asians in California constituted immigrants, according to a 2002 study. Only 59% of adult Asians were citizens (who can vote), according to the study.

The low voting rates of Hispanics and Asians naturally reduce their political power. Hispanics, at around one-fifth of the California electorate, are influential – but imagine how much more influential the Hispanic vote would be if they voted their numbers. As for Asians, their low turn-out makes their community almost a non-factor in California politics.

This will probably change, of course. A century ago one could have written the exact same words about another immigrant-heavy group that did not vote: Irish-Americans.

–Inoljt, http://mypolitikal.com/

The White Vote in Washington D.C.

By: Inoljt, http://mypolitikal.com/

When Republicans attack American liberalism, they prefer to use San Francisco as a punch bag. Indeed, San Francisco does constitute quite a liberal city; in the 2008 presidential election, 84.0% of the good folk of San Francisco preferred Democratic candidate Barack Obama over Senator John McCain.

San Francisco was far from the most Democratic-voting city in 2008, however. Mr. Obama’s percentage total was greater in several places; Washington D.C., for instance, pummeled San Francisco in the contest of who votes more loyally Democratic. In the capital of America, an astonishing 92.5% of voters supported the Illinois senator.

Most people who will hear this will probably start thinking something quite politically incorrect. The line of thought goes that “Washington is full of black people, all the blacks voted for Obama, so of course it voted that way.”

This is half true and half false.

More below.

It is true that the capital’s black population voted uniformly for the president – something that occurs with almost all Democratic candidates. The census, however, estimates that blacks compose only 54.4% of Washington’s overall population. This may surprise a lot of Americans who think the city is all-black. Even if every single black person in Washington voted Democratic, Mr. Obama still is quite a ways off from 92.5%.

Let’s look at another place with similar demographics to Washington D.C. – Montgomery County, Alabama where the Civil Rights movement started. Like Washington, Montgomery’s population is 52.9% black. Unlike Washington (where Mr. Obama won 92.5% of the vote), however, Montgomery only gave Mr. Obama 59.3% of the vote. Blacks are not responsible for this 33% difference; there is not much variation in how African-Americans voted in both cities.

The trick is with the white population. According to exit polls, Mr. Obama won 10% of whites in the state of Alabama. The results from Montgomery County reflect this low level of support.

In Washington, however, Mr. Obama won an astounding 86% of the white vote, according to exit polls. This is how the Illinois senator was able to get up to 92.5% of the vote in Washington, which is about one-third white. If white people alone had voted in Washington, Mr. Obama would still have done better than he did in San Francisco.

It would be quite interesting to explore why whites in the capital vote so loyally Democratic. Washington, of course, constitutes the center of the federal government; it would not be unusual for much of the white population to work for the government and thus vote more Democratic. But what type of work do they do – do they deliver the mail for the Post Office, or do they run the Post Office? Is Washington’s white population composed of  mostly working-class, union-type Democrats? Or is it composed mostly of  “wine-track” liberals, the type that populate cities like San  Francisco and Seattle?

Whatever the answer, this statistic remains one of the most curious and interesting ones to come out of the 2008 presidential election. Indeed, until now this blogger  was unaware that such one-sided Democratic voting patterns existed among  whites anywhere in the nation. To get 86% of the vote anywhere is a burdensome feat. For a Democrat to get that support from whites is something that one does not see often in the United States.

A Startling Fact About the Black Electorate

By: Inoljt, http://mypolitikal.com/

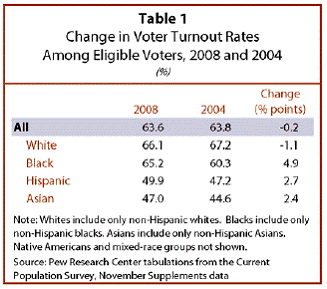
In the 2008 presidential election, 65.3% of eligible blacks voted – a voting rate about equal to the 66.1% of eligible whites who voted.

A Startling Fact About the Black Electorate

This is actually quite amazing. Indeed, in demographic terms this should not be happening.

The reason why below.

Here is why. Voter participation is affected by many categories. Age, for instance, is one factor. Young people, busy with their lives and politically less involved, have historically low voting rates. The elderly, on the other hand, vote in high numbers. Immigrants are also less likely to vote – thus the immigrant-heavy Hispanic and Asian communities have quite low voting rates, as the chart above indicates.

These two specific factors affect blacks and whites about equally. Others, however, hit blacks harder. As a whole, the black electorate is much poorer than the white electorate, and poor people are less likely to vote in the United States. In the 1988 presidential election, voter turn-out amongst the bottom fifth of Americans was 36.4%. Amongst the top fifth of Americans it was 63.1%. Education levels have a positive correlation with turn-out – and education attainment is lower amongst blacks than whites. More blacks also live in the South, where turn-out has been historically lower than the national mean. Finally, there are millions of blacks disenfranchised as ex-felons.

Demographically, therefore, blacks should be voting less than whites – and yet they are not.

This has startling implications. It means that a black person is far more likely to vote than a white person of similar circumstances. Indeed, according to the Census “the odds of voting in 2008 were about twice as high for blacks,” than whites once age, region, sex, income and educational attainment were factored in.

In other words, a black plumber was twice as likely to vote as a white plumber, a black lawyer twice as likely to vote as a white one. It is only because lawyers are more likely to vote than plumbers – and because the ratio of poor plumbers to rich lawyers is higher amongst blacks than whites – that voting participation is equal amongst blacks and whites.

This phenomenon is not just limited to 2008. In 2004 black voters in the South composed 17.9% of the overall Southern electorate, equal to their share of eligible voters. Consider that Southern blacks are poorer, less educated, and more likely to be in jail than Southern whites – yet still vote at the same rates as Southern whites. This means that a 30-year-old black male making $60,000 was much more likely to vote than his white counterpart.

So the next time that a political pundit talks about low black turn-out, don’t believe it. Person to person, man to man, blacks vote more often than any other race.

The Solid South

By: Inoljt, http://thepolitikalblog.wordpr…

It is a popular today to say that the South has switched from voting Democratic to Republican. Many people are fond of looking at previous electoral maps. Hey, isn’t that funny – the states have completely switched parties. It’s like the Republicans have recreated the Solid South.

That statement is unequivocally false. Most people have no idea how unbelievably Democratic the Solid South was. For half a century, Democrats in the Deep South did about as well as the Communist Party did in Soviet Union elections.

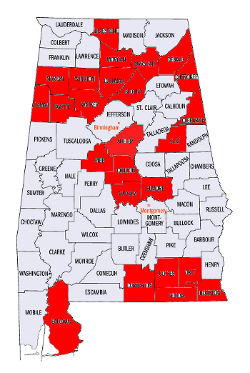
Let’s take a look at a model Republican southern state: Alabama. John McCain won 60.32% of the vote here, his second best showing in the South. Below are the counties in which Mr. McCain won over 70% of the vote (all my statistics below are from http://www.uselectionatlas.org/ – an amazing website).

Photobucket

That’s a lot of counties. The Republicans are doing quite well – about as well as the Democrats used to do in Alabama, many would say.

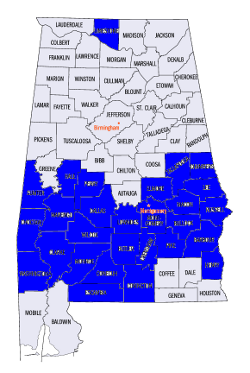
Here is another map, filled with blue counties.

It is the 1940 presidential election. I invite you to guess – what do these blue counties represent? Counties in which Roosevelt won over 70% of the vote? 80%? 90%? Remember, Roosevelt was quite a popular guy. He must have done pretty well in Alabama, part of the Solid South.

Photobucket

Continued below the flip.

In fact, the blue counties are those in which Roosevelt won over 95% of the vote in 1940. In all, he won 85.22% of the good folk of Alabama.

Those are incredible numbers. If today that result occurred, we would all cry fraud.

Of course, fraud – of a sort – was occurring in Alabama at that time. As everybody knows, blacks were not allowed to vote at that time. Notice how all but one of the blue counties surround Alabama’s Black Belt. What is less well known, however, is that many poor whites (more likely to vote Republican) were also unable to vote. The poll tax didn’t hurt just African-Americans, after all.

Different southern states enacted different voting restrictions with an intent to continue Democratic dominance. Some were more strict; some were less so. Republicans in North Carolina, for example, generally held Democrats to below 60% of the vote; they even won the state in 1928. On the other hand, South Carolina probably disenfranchised the most voters.

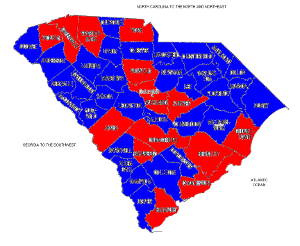
Here is the result:

Photobucket

The blue indicates a county that gave the Republican candidate less than 10% of the vote – for nine straight elections, from 1912 to 1944. From 1900 to 1944, South Carolina’s average vote (per election) went 94.89% Democratic, 3.98% Republican.

How did South Carolina achieve this amazing result?

A revealing clue is provided by looking at the voting count numbers. For example, in the year 1912 a total of 50,405 people voted in South Carolina (48,357 of whom supported the Democrat). At that time the census had just reapportioned electoral votes; South Carolina had a total of nine.

By comparing South Carolina to states with similar populations, one can get an idea of how many potential voters were disenfranchised. Kansas, for example, had ten electoral votes; 365,560 people in the state voted that year. West Virginia had eight electoral votes; 268,828 people voted in that state (remember, this was before women’s suffrage). In South Carolina, therefore, several times more citizens “should” have voted than actually did.

In conclusion, to state that the Solid South always voted Democratic is a misnomer. Even to say that it voted extremely Democratic might still be inaccurate. It would be like saying I’m interested in politics. Technically its true, but the picture the words imply far and away understates the reality.