The Future of the Asian-American Vote

Asians are one of the most ignored constituencies in American politics. When most politicians think about the Asian vote, they don’t.

Yet the Asian-American population is increasing, both in absolute terms and relative ones. By 2050, the Census estimates that Asians will compose 7.8% of the American population. Although their voting rates will still fall far short of this, the population is becoming more influential. Predicting their future voting path therefore has some utility.

In previous posts, this blogger has argued that the Latino vote will likely trend Republican, as Latinos follow the path of previous immigrants and become more assimilated.

Will the same happen for Asian-Americans?

More below.

Probably not:

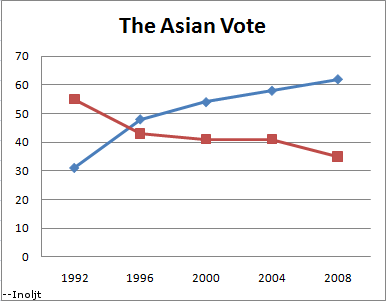
Photobucket

As the graph above shows, the Asian vote has steadily moved Democratic, in quite a significant manner. In 1992 Republican President George H.W. Bush won 55% of the Asian vote while losing the popular vote. 12 years later, his son won only 41% of Asians, despite winning the popular vote.

The trend also does not look bright for the Republican Party. Asian-Americans who have been born in the United States are, if anything, more Democratic than those who immigrated into the country (to be fair, the latter group dominates the Asian population and will continue to do so unless immigration is drastically curtailed).

Take, for instance, the Vietnamese-American population – strong supporters of the Republican Party. The Asian American Legal Defense and Education Fund, after conducting an extensive exit poll of Asians (perhaps the only detailed exit poll of the group in the country), found that:

Vietnamese American voters gave McCain the strongest support of all Asian ethnic groups at 67%. However, further analysis of Vietnamese American voters revealed 69% of those born in the U.S. and 60% of those 18-29 years old voted for Obama. Among Vietnamese American respondents, 15% were born in the U.S. and 25% were between the ages of 18 and 29.

The analysis goes on to conclude that:

AALDEF’s exit poll data shows that younger, U.S.-born, more recently naturalized, and English proficient Asian American citizens voted for Barack Obama for President by wide margins. Older, foreign-born citizens with limited English proficiency and who had been naturalized more than ten years ago voted in greater proportions for McCain.

There are several explanations for why this is happening. One quite plausible argument is that immigration has shifted the Asian-American population from Orange County anti-communists to Silicon Valley liberals.

Another revealing insight can be gained by comparing Asians to another very Democratic group: Jews. In many ways the two have a startling amount in common. Both groups are highly educated; both are primarily located in urban metropolitan areas; both have achieved substantial success in American society; and both have encountered quite similar types of discrimination. Even the stereotypes are similar.

Given these similarities, it is very conceivable that Asians could end up voting like Jews – one of the most liberal-minded groups in the nation.

–Inoljt, http://mypolitikal.com/
Examining Turn-Out by Race in California

California constitutes one of the most diverse states in the United States. Here is how the Census estimates its population composition:

California’s   Ethnic Composition
Asian 12.7%
Black 6.6%
Hispanic 37.0%
Mixed 2.6%
Native   American 1.2%
Pacific   Islander 0.4%
White 41.7%

(Note that the numbers do not add up to 100, due to the way the Census tracks ethnicity.)

The people who actually vote in California, however, do not reflect this composition.

More below.

California’s electorate in the 2008 presidential election is quite different from its actual ethnic composition:

2008   Electorate: Exit Polls
Asian 6%
Black 10%
Hispanic 18%
Other 3%
White 63%

These numbers were taken from exit polls – and one should be warned that exit polls are very, very inaccurate. The numbers above should not be taken for the truth, but rather as a rough approximation of it.

Nevertheless, one can take something out of the exit polls: blacks and whites punched far above their demographic weight, while Asians and Hispanics punched far below theirs. This pattern isn’t so much a racial one as much as an immigrant versus non-immigrant one.

Since blacks and whites are mainly non-immigrant communities, they vote more often than immigrant communities. Blacks and whites thus are overrepresented in the electorate. There was little racial divide between black and white turn-out, which is quite remarkable, given the lower socioeconomic status of blacks. All in all the percentage of California’s 2008 electorate was about 50% more black and white than California’s overall population.

Hispanics are the ones hurt most by this. The difference between the Hispanic portion of the electorate and the Hispanic portion of the overall population is quite striking: the electorate is just half as Hispanic as the population. Most of this is attributable to the legal status of many Hispanic immigrants, the relative youth of the Hispanic population, the lower socioeconomic status of Hispanics, and the immigrant-heavy nature Hispanic community (this is different from the first factor in that immigrants are inherently less likely to vote even if they are citizens).

It is not Hispanics, however, who are least likely to vote: it is Asians. There are several similarities and differences between the two groups. Unlike Hispanics, the Asian population is not skewed downwards, and Asians generally have a high socioeconomic status. On the other hand, Asians are much more of an immigrant community than Hispanics: a remarkable four out of five adult Asians in California constituted immigrants, according to a 2002 study. Only 59% of adult Asians were citizens (who can vote), according to the study.

The low voting rates of Hispanics and Asians naturally reduce their political power. Hispanics, at around one-fifth of the California electorate, are influential – but imagine how much more influential the Hispanic vote would be if they voted their numbers. As for Asians, their low turn-out makes their community almost a non-factor in California politics.

This will probably change, of course. A century ago one could have written the exact same words about another immigrant-heavy group that did not vote: Irish-Americans.

–Inoljt, http://mypolitikal.com/