Examining Turn-Out by Race in California

California constitutes one of the most diverse states in the United States. Here is how the Census estimates its population composition:

California’s   Ethnic Composition
Asian 12.7%
Black 6.6%
Hispanic 37.0%
Mixed 2.6%
Native   American 1.2%
Pacific   Islander 0.4%
White 41.7%

(Note that the numbers do not add up to 100, due to the way the Census tracks ethnicity.)

The people who actually vote in California, however, do not reflect this composition.

More below.

California’s electorate in the 2008 presidential election is quite different from its actual ethnic composition:

2008   Electorate: Exit Polls
Asian 6%
Black 10%
Hispanic 18%
Other 3%
White 63%

These numbers were taken from exit polls – and one should be warned that exit polls are very, very inaccurate. The numbers above should not be taken for the truth, but rather as a rough approximation of it.

Nevertheless, one can take something out of the exit polls: blacks and whites punched far above their demographic weight, while Asians and Hispanics punched far below theirs. This pattern isn’t so much a racial one as much as an immigrant versus non-immigrant one.

Since blacks and whites are mainly non-immigrant communities, they vote more often than immigrant communities. Blacks and whites thus are overrepresented in the electorate. There was little racial divide between black and white turn-out, which is quite remarkable, given the lower socioeconomic status of blacks. All in all the percentage of California’s 2008 electorate was about 50% more black and white than California’s overall population.

Hispanics are the ones hurt most by this. The difference between the Hispanic portion of the electorate and the Hispanic portion of the overall population is quite striking: the electorate is just half as Hispanic as the population. Most of this is attributable to the legal status of many Hispanic immigrants, the relative youth of the Hispanic population, the lower socioeconomic status of Hispanics, and the immigrant-heavy nature Hispanic community (this is different from the first factor in that immigrants are inherently less likely to vote even if they are citizens).

It is not Hispanics, however, who are least likely to vote: it is Asians. There are several similarities and differences between the two groups. Unlike Hispanics, the Asian population is not skewed downwards, and Asians generally have a high socioeconomic status. On the other hand, Asians are much more of an immigrant community than Hispanics: a remarkable four out of five adult Asians in California constituted immigrants, according to a 2002 study. Only 59% of adult Asians were citizens (who can vote), according to the study.

The low voting rates of Hispanics and Asians naturally reduce their political power. Hispanics, at around one-fifth of the California electorate, are influential – but imagine how much more influential the Hispanic vote would be if they voted their numbers. As for Asians, their low turn-out makes their community almost a non-factor in California politics.

This will probably change, of course. A century ago one could have written the exact same words about another immigrant-heavy group that did not vote: Irish-Americans.

–Inoljt, http://mypolitikal.com/
Solving a Mystery in Philadelphia Voting Patterns

A long time ago, I posted a series of posts analyzing the swing state Pennsylvania. One section of this series focused specifically on the city of Philadelphia. This section analyzed Philadelphia’s vote by precinct results and mapped out the results of several previous elections.

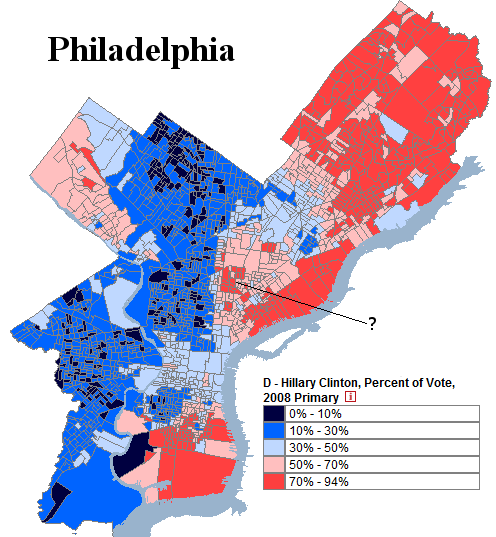
Of particular interest was the difference between the results of the 2008 presidential election and the 2008 Democratic primary, which illustrated a political divide not seen in presidential elections: between Democratic-leaning white Catholics in the northeast and Democratic-voting blacks in the west.

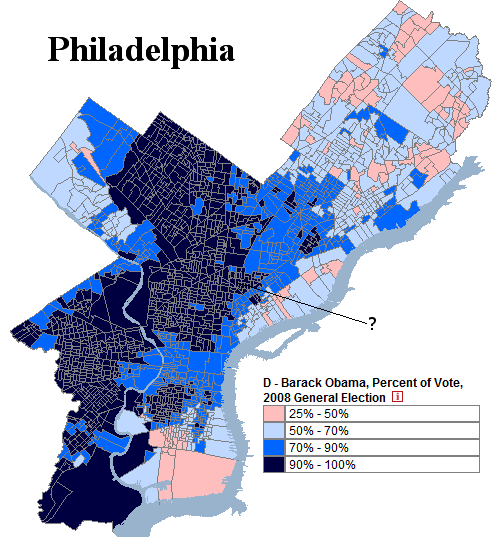
Here is Philadelphia in the 2008 Democratic primary. Take a note at the region the question mark points to, which this post will discuss:

Photobucket

More below.

(Note: Both images are taken from a website which maps historical Philadelphia election results.)

Here is Philadelphia in the 2008 presidential election:

Photobucket

Most of the different voting patterns between these two elections is fairly easy to explain: blacks in west Philadelphia voted for  Barack Obama both times, while white Catholics in the northeast voted strongly for Hillary Clinton in the primary and then lukewarmly Barack Obama in the general election. There is generally a scaling relationship between the two groups: as an area gets more white and less black, its support for Mr. Obama decreases in both elections.

There was, however, a group of precincts in Philadelphia which did not follow this model. These precincts are marked by the question mark in both maps. This group behaved quite strangely. It gave incredibly strong support to Ms. Clinton in the primary and then even stronger support to Mr. Obama in the general election. In the map of the 2008 primary, a number of these precincts cast more than 70% of their ballot to Ms. Clinton. All of them then vote more than 90% Democratic in the general election.

This behavior was quite puzzling, and something that the model did not explain. Initially this author hypothesized that these voters were white liberals in gentrifying areas of Philadelphia and then eventually forgot about the mystery.

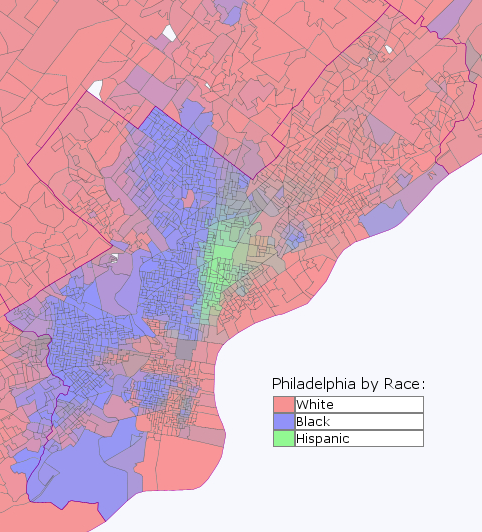
The answer, as it turns out, was not white liberals. Here it is:

Photobucket

The mysterious precincts were Hispanic!

The above image was created using Daves Redistricting Application. Due to the tremendous efforts of David  Bradlee, one can map the ethnic composition of every state in incredibly detail.

This provides some interesting insight into the behavior of Hispanics in inner-cities. If what holds for Philadelphia also holds for other cities (which is not a 100% certainty), inner-city Hispanics strongly supported both Hillary Clinton and then Barack Obama.

It is an insight provided by Daves Application which can be extended to many other areas and groups.

–Inoljt

The Latino Vote

They’re considered a minority in the United States, composing a rapidly growing sub-set of the population. The majority are immigrants; public sentiment, aroused by nativism, is sometimes hostile towards them. They vote heavily Democratic, but because many are immigrants they turn-out in numbers not as great as the share of the population they compose.

I’m not talking about Latinos. I’m talking about white Catholics in the early 20th century.

Today, Democrats hope that the Latino vote will be an essential part of a permanent majority, the keys to an unyielding period of Democratic dominance. Latinos were a major part of Obama’s victory in states such as Nevada, New Mexico, and Colorado. They’ve turned California blue for the foreseeable future. Red states Arizona and Texas are home to millions of Latinos, who represent a threat to the Republican character of those two states. Opportunity beckons.

Or so it seems.

In reality, however, it seems that the path of the Latino vote is the same as that of the white Catholic vote. The more Catholics that entered the country and the more time that passed, the more assimilated they became. In the early 20th century, Catholics were seen as an “other,” as Italian and Irish immigrants not fully part of the Unite States. Today, however, such sentiment is long gone. We regard white Catholics as normal, dull. The days of anti-Catholic discrimination are long gone.

With it has disappeared the Democratic hold over the Catholic vote. JFK won nearly 80% of Catholics because he was Catholic, and because in that time there was still anti-Catholic sentiment. 40 years later, John Kerry lost the Catholic vote, despite being a Catholic.

Will Latinos follow the same path? It seems likely. A large part of what connects Latinos to the Democratic Party is that they are an immigrant community – and Democrats have always represented immigrants. If – when – they assimilate, and the word Latino becomes just another synonym for white, Latinos will behave much as white Catholics do today. Which is to say that they will vote no different from the rest of America.

–Inoljt, http://thepolitikalblog.wordpr…