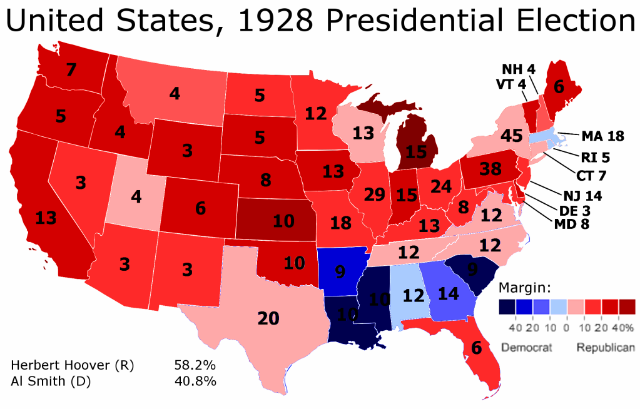
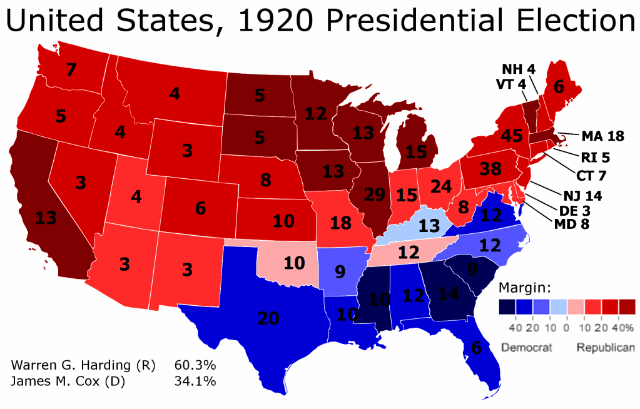
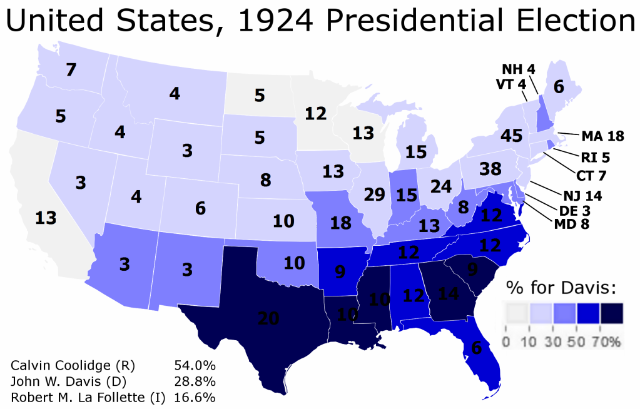
This is the second part of two posts analyzing in more detail the 1928 presidential election.
The Great Realignment
The previous post noted that:
In 1928 the Democratic Party nominated Governor Al Smith of New York. Mr. Smith was nominated as a Catholic Irish-American New Yorker who directly represented Democratic-voting white ethnics. Mr. Smith’s Catholicism, however, constituted an affront to Democratic-voting white Southerners, who at the time were the most important part of the party’s base.
The 1928 presidential election thus saw a mass movement of white Southerners away from the Democrats, corresponding with a mass movement of white ethnics towards the Democrats. This was the beginning of the great realignment of the South to the Republican Party and the Northeast to the Democratic Party.
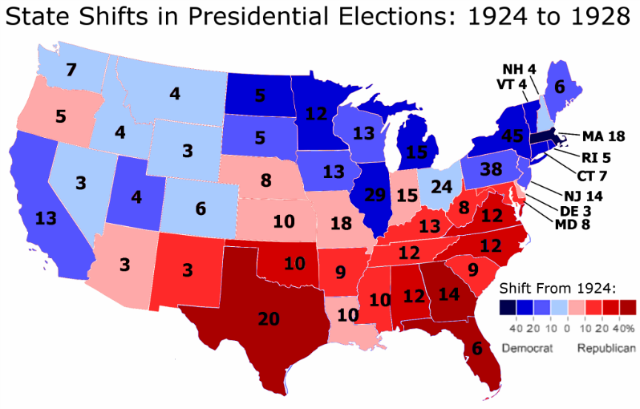
This change can be illustrated with a map detailing the state-by-state shift from the 1924 presidential election to the 1928 presidential election:
There are a number of things that stand out with this map.
More below.
The first, as has been previously noted, is the degree to which the shift replicates the current electoral map.
This is not all, however. Two other things are very, very out-of-whack here. To get a hint at what these are, it is useful to compare the 1924 to 1928 state-by-state voting shift to that of different elections.
One example is the change from 2004 to 2008.
In 2008 President Barack Obama improved by 9.7% from the performance of the previous Democratic candidate, Senator John Kerry. In 1928 Governor Al Smith improved by 7.8% from the performance of Democratic candidate John Davis. The shift from 1924 to 1928 is therefore roughly comparable to the shift from 2004 to 2008.
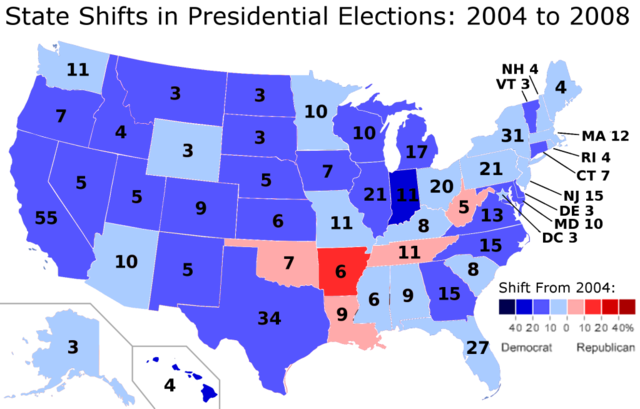
Here is a map of that shift:
Although both Democratic candidates improved by roughly the same percentage from the previous election, where and how they improved look completely different.
In 2008, Mr. Obama generally improved everywhere. In only five states does he do worse than Mr. Kerry. This is the famous Appalachian corridor with which Mr. Obama was so weak.
Moreover, the degree of movement is generally modest. Only two states – Hawaii and Indiana – have more than a 20-point shift from how they voted in 2004. No state shifts more than 40 points (although Hawaii certainly comes close, going from a 8.7% Democratic margin to a 45.3% Democratic margin).
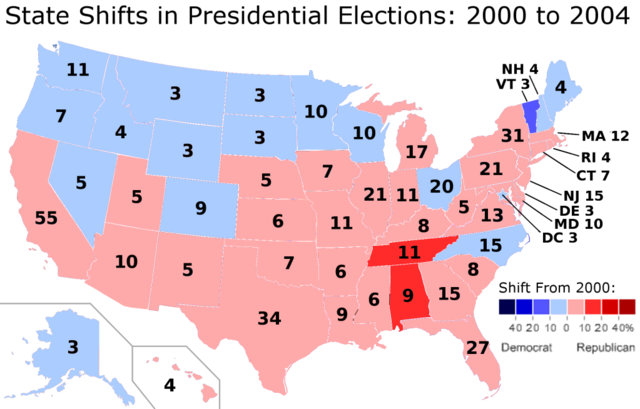
These two patterns: uniform and moderate movement (i.e. when a candidate does better in the popular vote, said candidate does better in almost every state, and states generally do not have wild swings from how they voted from the previous election) are not just confined to 2008. Here is the shift from 2000 to 2004, when President George W. Bush improved by 2.9% from his performance four years earlier:
One again we see that the national shift right brought most of the states with them, and that only three states shifted more than 10% from 2000.
Let’s take another look at 1928 to finish:
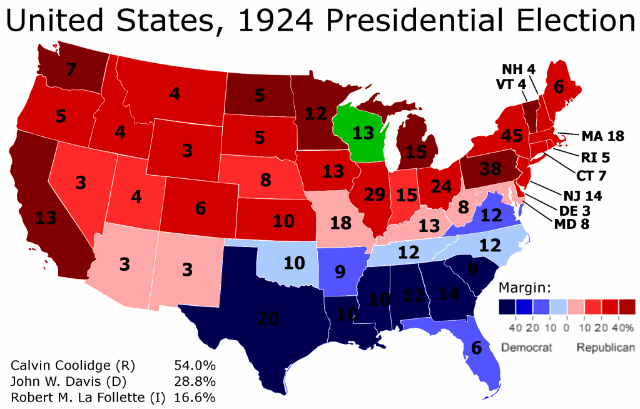
Here neither pattern is present. In 1928, the country moved 7.8% more Democratic from 1924. Despite this, Democratic candidate Al Smith did worse in 23 out of 48 states. Three states – Florida, Georgia, and Texas – voted more than 40% more Republican than they did in the previous election. In Texas, Republicans went from 19.8% of the vote in 1924 to 51.8% of the vote in 1928. Fifteen states voted more than 10% more Republican than they did in 1924.
In comparison, in 2008 only one state – Arkansas – voted more than 10% more Republican than it did in 2004 (and it did so by the barest of margins: 10.1%). This was despite Mr. Obama’s improvement from 2004 being roughly equivalent to Mr. Smith’s improvement from 1924.
A lot of interest has gone into Mr. Obama’s weakness in Appalachia. But Mr. Smith’s Southern problem in 1928 (i.e. the fact that he was a Catholic) makes Mr. Obama’s Appalachian problem look puny.
If Mr. Smith improved by 7.8% from the performance of his Democratic predecessor with so much weakness in the South, the shift in the states that voted more Democratic must have been huge. And indeed, the New Yorker gained more than 20-point shifts in nine states. In Massachusetts, Democrats went from 24.9% of the vote in 1924 to 50.2% in 1928.
All in all, the 1928 presidential election was the scene of some enormous movement on a state-by-state basis. In 2008 only two states shifted more than 20 points from 2004, as Mr. Obama did 9.7% better than Mr. Kerry. In 1928, on the other hand, sixteen states shifted more than 20 points from 1928, as Mr. Smith did 7.8% better than the previous Democratic candidate.
This is what a realigning election looks like – extreme movement on from one state to the next, enormous differences by region, and a powerful correlation between which states shift Democratic and which states are voting Democratic almost a century later.
P.S. For those interested, here is a table of the state-by-state voting shift from the 1924 presidential election to the 1928 presidential election:
| State | 1928 Republican Margin | 1924 Republican Margin | Change |
| Alabama | -2.84% | –40.80% | 37.96% |
| Arizona | 15.34% | 5.79% | 9.55% |
| Arkansas | -20.96% | -31.93% | 10.97% |
| California | 30.50% | 48.97% | -18.47% |
| Colorado | 30.78% | 35.04% | -4.26% |
| Connecticut | 8.06% | 34.01% | -25.95% |
| Delaware | 30.42% | 20.90% | 9.52% |
| Florida | 16.72% | -28.82% | 45.54% |
| Georgia | -13.19% | -55.77% | 42.58% |
| Idaho | 29.30% | 30.76% | -1.46% |
| Illinois | 14.65% | 35.48% | -20.83% |
| Indiana | 20.09% | 16.56% | 3.53% |
| Iowa | 24.20% | 38.39% | -14.19% |
| Kansas | 44.96% | 37.94% | 7.02% |
| Kentucky | 18.82% | 2.95% | 15.87% |
| Louisiana | -52.58% | -56.21% | 3.63% |
| Maine | 37.66% | 50.20% | -12.54% |
| Maryland | 14.74% | 4.00% | 10.74% |
| Massachusetts | -1.09% | 37.40% | -38.49% |
| Michigan | 41.44% | 62.24% | -20.80% |
| Minnesota | 16.94% | 44.38% | -27.44% |
| Mississippi | -64.20% | -81.79% | 17.59% |
| Missouri | 11.43% | 5.79% | 5.64% |
| Montana | 17.89% | 23.12% | -5.23% |
| Nebraska | 27.01% | 17.51% | 9.50% |
| Nevada | 13.07% | 19.81% | -6.74% |
| New Hampshire | 17.63% | 25.11% | -7.48% |
| New Jersey | 19.97% | 34.76% | -14.79% |
| New Mexico | 18.16% | 5.50% | 12.66% |
| New York | 2.35% | 26.63% | -24.28% |
| North Carolina | 9.87% | -19.16% | 29.03% |
| North Dakota | 10.34% | 40.72% | -30.38% |
| Ohio | 30.43% | 34.63% | -4.20% |
| Oklahoma | 28.28% | -5.59% | 33.87% |
| Oregon | 30.04% | 26.83% | 3.21% |
| Pennsylvania | 31.35% | 46.26% | -14.91% |
| Rhode Island | -0.61% | 23.17% | -23.78% |
| South Carolina | -82.85% | -94.35% | 11.50% |
| South Dakota | 20.98% | 36.34% | -15.36% |
| Tennessee | 7.72% | -9.21% | 16.93% |
| Texas | 3.67% | -53.92% | 57.59% |
| Utah | 7.72% | 19.32% | -11.60% |
| Vermont | 34.00% | 62.55% | -28.55% |
| Virginia | 8.01% | -29.69% | 37.70% |
| Washington | 35.75% | 42.08% | -6.33% |
| West Virginia | 17.39% | 5.38% | 12.01% |
| Wisconsin | 9.24% | 28.96% | -19.72% |
| Wyoming | 28.31% | 36.28% | -7.97% |
| Total | 25.22% | 17.42% | -7.80% |
–Inoljt
