By: Inoljt, http://thepolitikalblog.wordpr…
It is a popular today to say that the South has switched from voting Democratic to Republican. Many people are fond of looking at previous electoral maps. Hey, isn’t that funny – the states have completely switched parties. It’s like the Republicans have recreated the Solid South.
That statement is unequivocally false. Most people have no idea how unbelievably Democratic the Solid South was. For half a century, Democrats in the Deep South did about as well as the Communist Party did in Soviet Union elections.
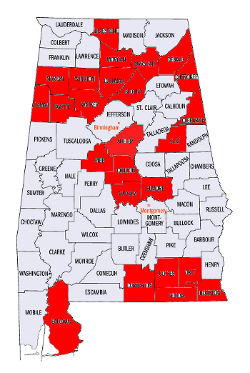
Let’s take a look at a model Republican southern state: Alabama. John McCain won 60.32% of the vote here, his second best showing in the South. Below are the counties in which Mr. McCain won over 70% of the vote (all my statistics below are from http://www.uselectionatlas.org/ – an amazing website).
That’s a lot of counties. The Republicans are doing quite well – about as well as the Democrats used to do in Alabama, many would say.
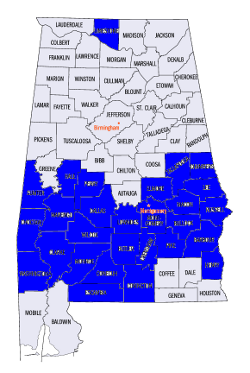
Here is another map, filled with blue counties.
It is the 1940 presidential election. I invite you to guess – what do these blue counties represent? Counties in which Roosevelt won over 70% of the vote? 80%? 90%? Remember, Roosevelt was quite a popular guy. He must have done pretty well in Alabama, part of the Solid South.

Continued below the flip.
In fact, the blue counties are those in which Roosevelt won over 95% of the vote in 1940. In all, he won 85.22% of the good folk of Alabama.
Those are incredible numbers. If today that result occurred, we would all cry fraud.
Of course, fraud – of a sort – was occurring in Alabama at that time. As everybody knows, blacks were not allowed to vote at that time. Notice how all but one of the blue counties surround Alabama’s Black Belt. What is less well known, however, is that many poor whites (more likely to vote Republican) were also unable to vote. The poll tax didn’t hurt just African-Americans, after all.
Different southern states enacted different voting restrictions with an intent to continue Democratic dominance. Some were more strict; some were less so. Republicans in North Carolina, for example, generally held Democrats to below 60% of the vote; they even won the state in 1928. On the other hand, South Carolina probably disenfranchised the most voters.
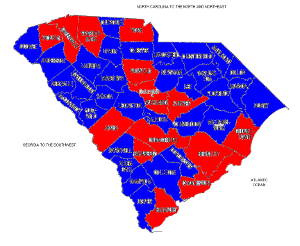
Here is the result:

The blue indicates a county that gave the Republican candidate less than 10% of the vote – for nine straight elections, from 1912 to 1944. From 1900 to 1944, South Carolina’s average vote (per election) went 94.89% Democratic, 3.98% Republican.
How did South Carolina achieve this amazing result?
A revealing clue is provided by looking at the voting count numbers. For example, in the year 1912 a total of 50,405 people voted in South Carolina (48,357 of whom supported the Democrat). At that time the census had just reapportioned electoral votes; South Carolina had a total of nine.
By comparing South Carolina to states with similar populations, one can get an idea of how many potential voters were disenfranchised. Kansas, for example, had ten electoral votes; 365,560 people in the state voted that year. West Virginia had eight electoral votes; 268,828 people voted in that state (remember, this was before women’s suffrage). In South Carolina, therefore, several times more citizens “should” have voted than actually did.
In conclusion, to state that the Solid South always voted Democratic is a misnomer. Even to say that it voted extremely Democratic might still be inaccurate. It would be like saying I’m interested in politics. Technically its true, but the picture the words imply far and away understates the reality.
